
|
|||||
|
 | |
| |
| |
| |
| |
| |
|
Gene: CUL7 |
Gene summary for CUL7 |
| Gene information | Species | Human | Gene symbol | CUL7 | Gene ID | 9820 |
| Gene name | cullin 7 | |
| Gene Alias | 3M1 | |
| Cytomap | 6p21.1 | |
| Gene Type | protein-coding | GO ID | GO:0000003 | UniProtAcc | Q14999 |
Top |
Malignant transformation analysis |
| Identification of the aberrant gene expression in precancerous and cancerous lesions by comparing the gene expression of stem-like cells in diseased tissues with normal stem cells |
| Entrez ID | Symbol | Replicates | Species | Organ | Tissue | Adj P-value | Log2FC | Malignancy |
| 9820 | CUL7 | HCC1_Meng | Human | Liver | HCC | 6.88e-21 | 8.04e-02 | 0.0246 |
| 9820 | CUL7 | HCC1 | Human | Liver | HCC | 5.77e-03 | 1.96e+00 | 0.5336 |
| 9820 | CUL7 | HCC2 | Human | Liver | HCC | 1.60e-04 | 1.45e+00 | 0.5341 |
| 9820 | CUL7 | S014 | Human | Liver | HCC | 5.85e-13 | 5.68e-01 | 0.2254 |
| 9820 | CUL7 | S015 | Human | Liver | HCC | 3.77e-13 | 5.93e-01 | 0.2375 |
| 9820 | CUL7 | S016 | Human | Liver | HCC | 6.25e-10 | 3.65e-01 | 0.2243 |
| 9820 | CUL7 | S027 | Human | Liver | HCC | 4.52e-04 | 4.54e-01 | 0.2446 |
| 9820 | CUL7 | S028 | Human | Liver | HCC | 8.41e-15 | 4.45e-01 | 0.2503 |
| 9820 | CUL7 | S029 | Human | Liver | HCC | 3.61e-11 | 4.50e-01 | 0.2581 |
| 9820 | CUL7 | male-WTA | Human | Thyroid | PTC | 2.45e-18 | 1.29e-01 | 0.1037 |
| 9820 | CUL7 | PTC01 | Human | Thyroid | PTC | 5.65e-09 | 4.76e-02 | 0.1899 |
| 9820 | CUL7 | PTC04 | Human | Thyroid | PTC | 1.07e-06 | 1.33e-01 | 0.1927 |
| 9820 | CUL7 | PTC05 | Human | Thyroid | PTC | 2.33e-03 | 1.63e-01 | 0.2065 |
| 9820 | CUL7 | PTC06 | Human | Thyroid | PTC | 5.39e-15 | 2.66e-01 | 0.2057 |
| 9820 | CUL7 | PTC07 | Human | Thyroid | PTC | 8.03e-07 | 1.99e-01 | 0.2044 |
| 9820 | CUL7 | ATC09 | Human | Thyroid | ATC | 2.86e-04 | 2.49e-01 | 0.2871 |
| 9820 | CUL7 | ATC12 | Human | Thyroid | ATC | 4.43e-17 | 2.50e-01 | 0.34 |
| 9820 | CUL7 | ATC13 | Human | Thyroid | ATC | 4.34e-65 | 1.09e+00 | 0.34 |
| 9820 | CUL7 | ATC1 | Human | Thyroid | ATC | 1.01e-03 | 2.64e-01 | 0.2878 |
| 9820 | CUL7 | ATC4 | Human | Thyroid | ATC | 1.54e-16 | 3.23e-01 | 0.34 |
| Page: 1 2 |
| Tissue | Expression Dynamics | Abbreviation |
| Liver | 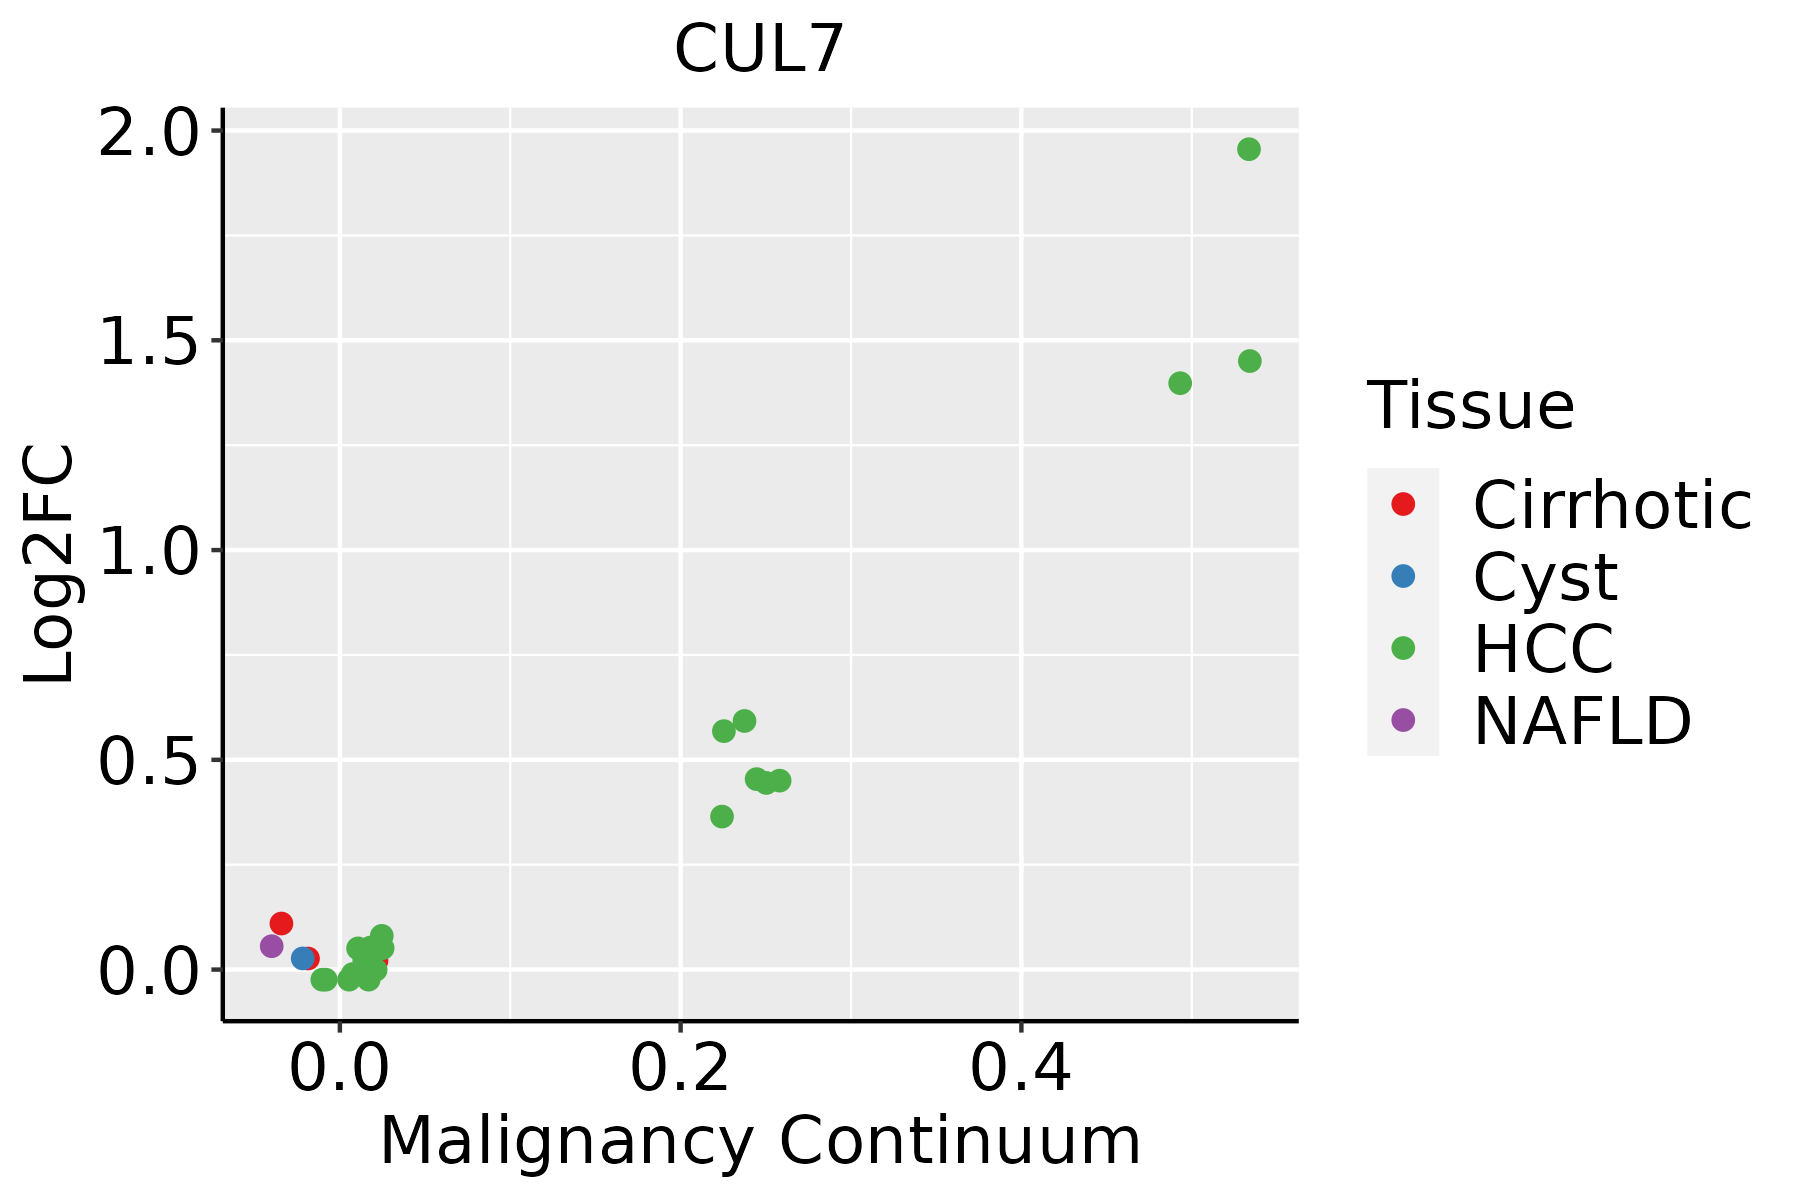 | HCC: Hepatocellular carcinoma |
| NAFLD: Non-alcoholic fatty liver disease | ||
| Thyroid | 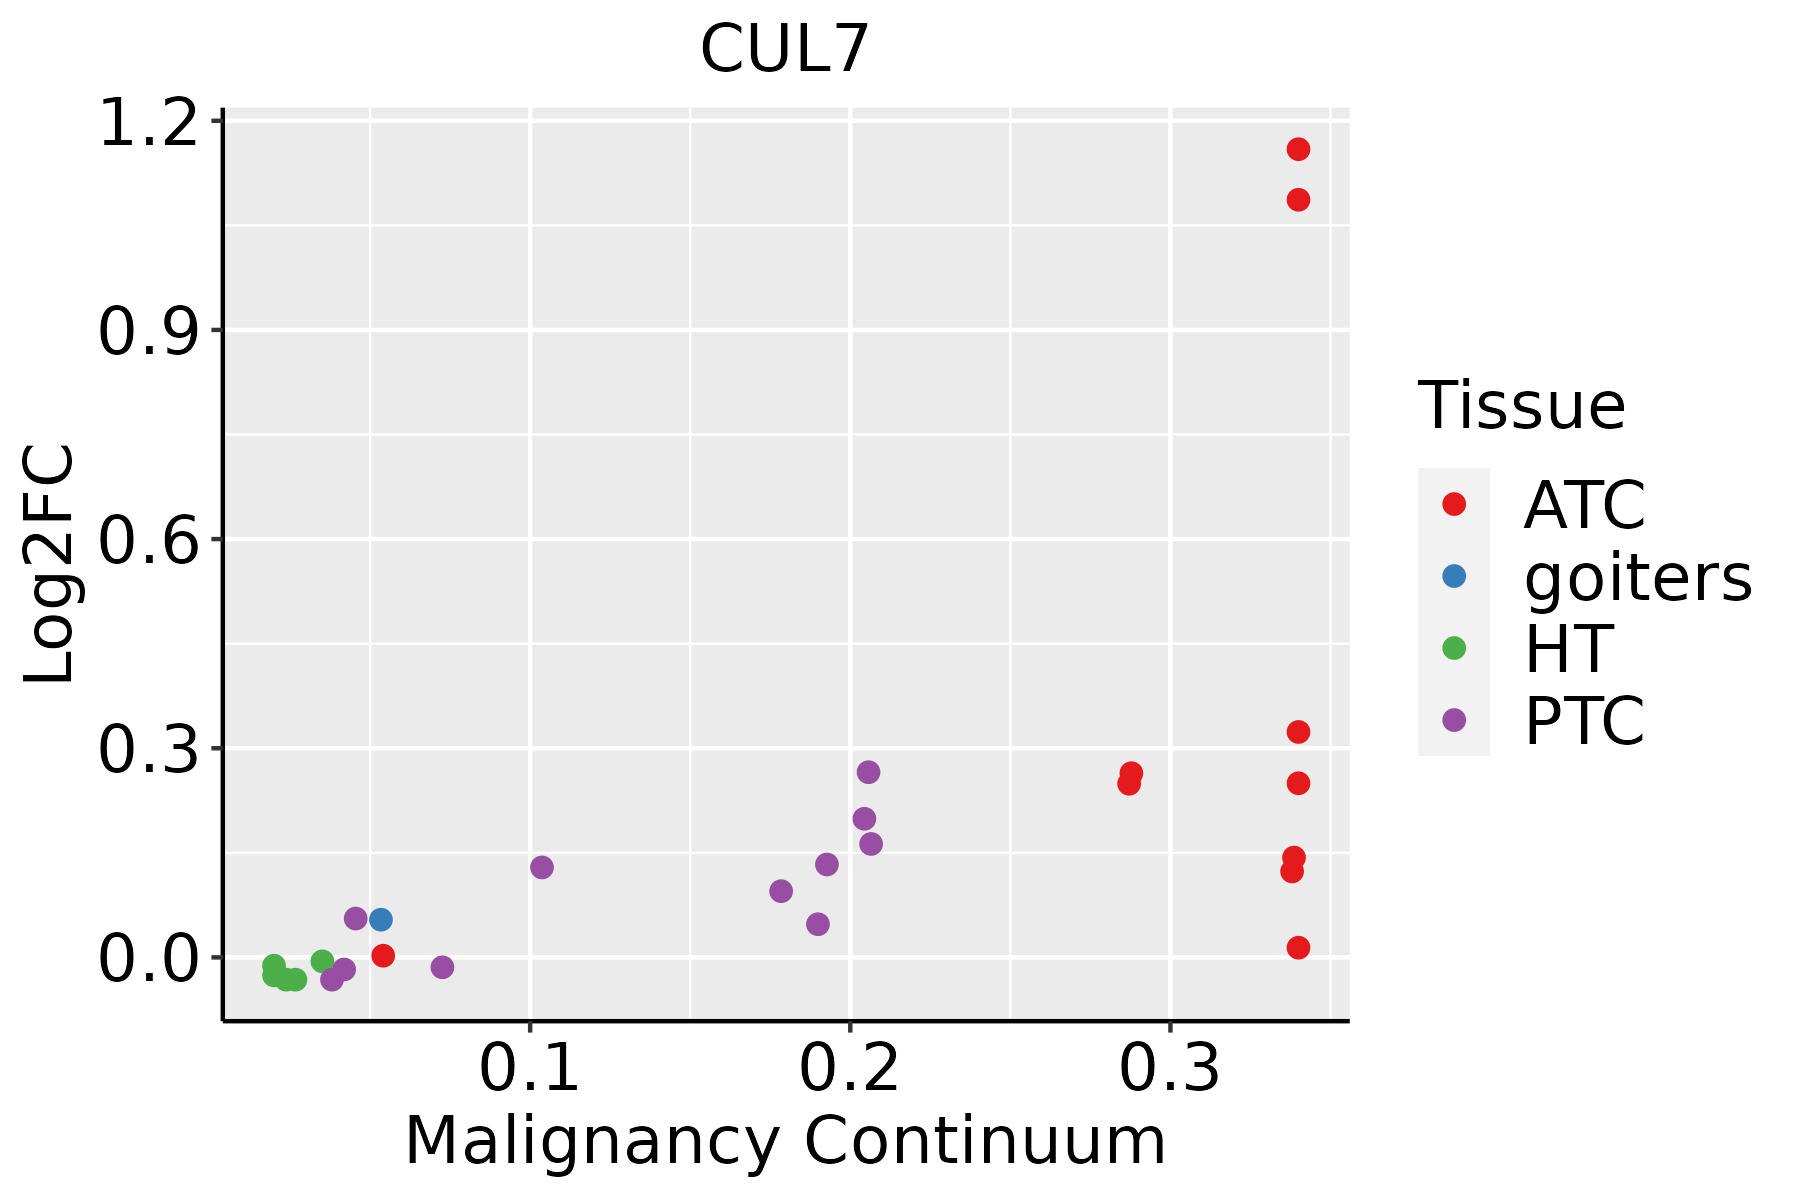 | ATC: Anaplastic thyroid cancer |
| HT: Hashimoto's thyroiditis | ||
| PTC: Papillary thyroid cancer |
| ∗log2FC in expression of this searched gene in stem-like cells from each diseased tissue sample relative to stem-like cells in normal samples in each tissue plotted against the malignancy continuum. Samples are colored based on if they are from different disease stage. |
Top |
Malignant transformation related pathway analysis |
| Find out the enriched GO biological processes and KEGG pathways involved in transition from healthy to precancer to cancer |
| Tissue | Disease Stage | Enriched GO biological Processes |
| Colorectum | AD |  |
| Colorectum | SER |  |
| Colorectum | MSS |  |
| Colorectum | MSI-H |  |
| Colorectum | FAP |  |
| ∗Top 15 enriched GO BP terms are showed in the bar plot of each disease state in each tissue. Each row represents a significant GO biological process which is colored according to the -log10(p.adjust). |
| Page: 1 2 3 4 5 6 7 8 9 |
| GO ID | Tissue | Disease Stage | Description | Gene Ratio | Bg Ratio | pvalue | p.adjust | Count |
| GO:002260422 | Liver | HCC | regulation of cell morphogenesis | 188/7958 | 309/18723 | 4.84e-11 | 1.82e-09 | 188 |
| GO:014001411 | Liver | HCC | mitotic nuclear division | 174/7958 | 287/18723 | 3.74e-10 | 1.23e-08 | 174 |
| GO:000734611 | Liver | HCC | regulation of mitotic cell cycle | 255/7958 | 457/18723 | 4.96e-09 | 1.30e-07 | 255 |
| GO:00070302 | Liver | HCC | Golgi organization | 99/7958 | 157/18723 | 1.54e-07 | 2.85e-06 | 99 |
| GO:001076922 | Liver | HCC | regulation of cell morphogenesis involved in differentiation | 65/7958 | 96/18723 | 5.17e-07 | 8.37e-06 | 65 |
| GO:000028111 | Liver | HCC | mitotic cytokinesis | 51/7958 | 71/18723 | 5.20e-07 | 8.38e-06 | 51 |
| GO:003134611 | Liver | HCC | positive regulation of cell projection organization | 193/7958 | 353/18723 | 2.28e-06 | 3.08e-05 | 193 |
| GO:001077022 | Liver | HCC | positive regulation of cell morphogenesis involved in differentiation | 53/7958 | 79/18723 | 8.69e-06 | 1.02e-04 | 53 |
| GO:0048285 | Liver | HCC | organelle fission | 254/7958 | 488/18723 | 1.07e-05 | 1.23e-04 | 254 |
| GO:000091011 | Liver | HCC | cytokinesis | 100/7958 | 173/18723 | 3.38e-05 | 3.39e-04 | 100 |
| GO:006164011 | Liver | HCC | cytoskeleton-dependent cytokinesis | 60/7958 | 100/18723 | 3.09e-04 | 2.20e-03 | 60 |
| GO:001072011 | Liver | HCC | positive regulation of cell development | 155/7958 | 298/18723 | 5.39e-04 | 3.48e-03 | 155 |
| GO:000189011 | Liver | HCC | placenta development | 81/7958 | 144/18723 | 5.91e-04 | 3.75e-03 | 81 |
| GO:0000280 | Liver | HCC | nuclear division | 220/7958 | 439/18723 | 6.90e-04 | 4.25e-03 | 220 |
| GO:0007088 | Liver | HCC | regulation of mitotic nuclear division | 63/7958 | 110/18723 | 1.24e-03 | 6.85e-03 | 63 |
| GO:001097511 | Liver | HCC | regulation of neuron projection development | 220/7958 | 445/18723 | 1.68e-03 | 8.78e-03 | 220 |
| GO:00507674 | Liver | HCC | regulation of neurogenesis | 181/7958 | 364/18723 | 3.00e-03 | 1.40e-02 | 181 |
| GO:00507693 | Liver | HCC | positive regulation of neurogenesis | 116/7958 | 225/18723 | 3.67e-03 | 1.63e-02 | 116 |
| GO:006145811 | Liver | HCC | reproductive system development | 205/7958 | 427/18723 | 1.16e-02 | 4.27e-02 | 205 |
| GO:0050775 | Liver | HCC | positive regulation of dendrite morphogenesis | 23/7958 | 37/18723 | 1.25e-02 | 4.53e-02 | 23 |
| Page: 1 2 3 4 5 |
| Pathway ID | Tissue | Disease Stage | Description | Gene Ratio | Bg Ratio | pvalue | p.adjust | qvalue | Count |
| hsa0412041 | Liver | HCC | Ubiquitin mediated proteolysis | 110/4020 | 142/8465 | 1.67e-13 | 3.74e-12 | 2.08e-12 | 110 |
| hsa0412051 | Liver | HCC | Ubiquitin mediated proteolysis | 110/4020 | 142/8465 | 1.67e-13 | 3.74e-12 | 2.08e-12 | 110 |
| Page: 1 |
Top |
Cell-cell communication analysis |
| Identification of potential cell-cell interactions between two cell types and their ligand-receptor pairs for different disease states |
| Ligand | Receptor | LRpair | Pathway | Tissue | Disease Stage |
| Page: 1 |
Top |
Single-cell gene regulatory network inference analysis |
| Find out the significant the regulons (TFs) and the target genes of each regulon across cell types for different disease states |
| TF | Cell Type | Tissue | Disease Stage | Target Gene | RSS | Regulon Activity |
| ∗The dot plots of a searched regulon are shown for all cell subpopulations in each disease state of each tissue based on the regulon specific score inferred using pySCENIC and by calculating the average expression. |
| Page: 1 |
Top |
Somatic mutation of malignant transformation related genes |
| Annotation of somatic variants for genes involved in malignant transformation |
| Hugo Symbol | Variant Class | Variant Classification | dbSNP RS | HGVSc | HGVSp | HGVSp Short | SWISSPROT | BIOTYPE | SIFT | PolyPhen | Tumor Sample Barcode | Tissue | Histology | Sex | Age | Stage | Therapy Types | Drugs | Outcome |
| CUL7 | SNV | Missense_Mutation | rs759549960 | c.1402C>T | p.Arg468Trp | p.R468W | Q14999 | protein_coding | deleterious(0) | probably_damaging(0.997) | TCGA-A1-A0SF-01 | Breast | breast invasive carcinoma | Female | <65 | I/II | Chemotherapy | tc | SD |
| CUL7 | SNV | Missense_Mutation | c.2122N>A | p.Leu708Met | p.L708M | Q14999 | protein_coding | deleterious(0) | probably_damaging(0.974) | TCGA-A8-A076-01 | Breast | breast invasive carcinoma | Female | >=65 | I/II | Hormone Therapy | anastrozole | SD | |
| CUL7 | SNV | Missense_Mutation | novel | c.4943G>A | p.Arg1648Gln | p.R1648Q | Q14999 | protein_coding | deleterious(0) | probably_damaging(0.983) | TCGA-A8-A07R-01 | Breast | breast invasive carcinoma | Female | >=65 | III/IV | Ancillary | zoledronic | SD |
| CUL7 | SNV | Missense_Mutation | c.1729G>C | p.Glu577Gln | p.E577Q | Q14999 | protein_coding | deleterious(0) | probably_damaging(0.998) | TCGA-AC-A23H-01 | Breast | breast invasive carcinoma | Female | >=65 | I/II | Unknown | Unknown | PD | |
| CUL7 | SNV | Missense_Mutation | novel | c.5326C>A | p.Gln1776Lys | p.Q1776K | Q14999 | protein_coding | deleterious_low_confidence(0.04) | benign(0.059) | TCGA-AC-A3HN-01 | Breast | breast invasive carcinoma | Female | >=65 | I/II | Unknown | Unknown | SD |
| CUL7 | SNV | Missense_Mutation | c.5294N>A | p.Arg1765Gln | p.R1765Q | Q14999 | protein_coding | deleterious_low_confidence(0.04) | benign(0.219) | TCGA-AN-A0FZ-01 | Breast | breast invasive carcinoma | Female | <65 | III/IV | Unknown | Unknown | SD | |
| CUL7 | SNV | Missense_Mutation | novel | c.2117N>T | p.Gln706Leu | p.Q706L | Q14999 | protein_coding | deleterious(0.04) | benign(0.023) | TCGA-BH-A0BW-01 | Breast | breast invasive carcinoma | Female | >=65 | I/II | Chemotherapy | adriamycin | CR |
| CUL7 | SNV | Missense_Mutation | novel | c.5264T>C | p.Leu1755Pro | p.L1755P | Q14999 | protein_coding | tolerated_low_confidence(0.06) | possibly_damaging(0.808) | TCGA-BH-A0HA-01 | Breast | breast invasive carcinoma | Female | <65 | I/II | Unknown | Unknown | SD |
| CUL7 | SNV | Missense_Mutation | c.1339N>C | p.Phe447Leu | p.F447L | Q14999 | protein_coding | deleterious(0) | probably_damaging(0.997) | TCGA-D8-A1XK-01 | Breast | breast invasive carcinoma | Female | <65 | I/II | Chemotherapy | doxorubicine+cyclophosphamide | SD | |
| CUL7 | SNV | Missense_Mutation | rs776538724 | c.523C>T | p.Arg175Trp | p.R175W | Q14999 | protein_coding | tolerated(0.06) | benign(0.378) | TCGA-E9-A226-01 | Breast | breast invasive carcinoma | Female | <65 | III/IV | Hormone Therapy | tamoxiphen | PD |
| Page: 1 2 3 4 5 6 7 8 9 10 11 12 13 14 |
Top |
Related drugs of malignant transformation related genes |
| Identification of chemicals and drugs interact with genes involved in malignant transfromation |
| (DGIdb 4.0) |
| Entrez ID | Symbol | Category | Interaction Types | Drug Claim Name | Drug Name | PMIDs |
| Page: 1 |

Copyright 2023-Present -The University of Texas Health Science Center at Houston |