
|
|||||
|
 | |
| |
| |
| |
| |
| |
|
Gene: CUL5 |
Gene summary for CUL5 |
| Gene information | Species | Human | Gene symbol | CUL5 | Gene ID | 8065 |
| Gene name | cullin 5 | |
| Gene Alias | CUL-5 | |
| Cytomap | 11q22.3 | |
| Gene Type | protein-coding | GO ID | GO:0000082 | UniProtAcc | Q93034 |
Top |
Malignant transformation analysis |
| Identification of the aberrant gene expression in precancerous and cancerous lesions by comparing the gene expression of stem-like cells in diseased tissues with normal stem cells |
| Entrez ID | Symbol | Replicates | Species | Organ | Tissue | Adj P-value | Log2FC | Malignancy |
| 8065 | CUL5 | HTA11_3410_2000001011 | Human | Colorectum | AD | 3.00e-07 | -4.93e-01 | 0.0155 |
| 8065 | CUL5 | HTA11_866_3004761011 | Human | Colorectum | AD | 2.92e-02 | -3.79e-01 | 0.096 |
| 8065 | CUL5 | HTA11_99999970781_79442 | Human | Colorectum | MSS | 2.69e-05 | -3.10e-01 | 0.294 |
| 8065 | CUL5 | HTA11_99999974143_84620 | Human | Colorectum | MSS | 2.16e-05 | -3.48e-01 | 0.3005 |
| 8065 | CUL5 | A015-C-203 | Human | Colorectum | FAP | 6.83e-22 | -2.87e-01 | -0.1294 |
| 8065 | CUL5 | A002-C-201 | Human | Colorectum | FAP | 3.97e-09 | -4.00e-01 | 0.0324 |
| 8065 | CUL5 | A001-C-119 | Human | Colorectum | FAP | 7.23e-03 | -3.48e-01 | -0.1557 |
| 8065 | CUL5 | A001-C-108 | Human | Colorectum | FAP | 2.34e-14 | -3.14e-01 | -0.0272 |
| 8065 | CUL5 | A002-C-205 | Human | Colorectum | FAP | 2.82e-12 | -3.85e-01 | -0.1236 |
| 8065 | CUL5 | A015-C-006 | Human | Colorectum | FAP | 5.78e-10 | -4.90e-01 | -0.0994 |
| 8065 | CUL5 | A015-C-106 | Human | Colorectum | FAP | 7.01e-09 | -2.29e-01 | -0.0511 |
| 8065 | CUL5 | A002-C-114 | Human | Colorectum | FAP | 1.01e-08 | -1.99e-01 | -0.1561 |
| 8065 | CUL5 | A015-C-104 | Human | Colorectum | FAP | 5.64e-23 | -3.68e-01 | -0.1899 |
| 8065 | CUL5 | A001-C-014 | Human | Colorectum | FAP | 7.81e-10 | -3.07e-01 | 0.0135 |
| 8065 | CUL5 | A002-C-016 | Human | Colorectum | FAP | 1.67e-16 | -3.67e-01 | 0.0521 |
| 8065 | CUL5 | A015-C-002 | Human | Colorectum | FAP | 2.60e-07 | -3.96e-01 | -0.0763 |
| 8065 | CUL5 | A001-C-203 | Human | Colorectum | FAP | 1.61e-07 | -1.96e-01 | -0.0481 |
| 8065 | CUL5 | A002-C-116 | Human | Colorectum | FAP | 4.51e-23 | -3.90e-01 | -0.0452 |
| 8065 | CUL5 | A014-C-008 | Human | Colorectum | FAP | 2.27e-07 | -3.77e-01 | -0.191 |
| 8065 | CUL5 | A018-E-020 | Human | Colorectum | FAP | 3.58e-12 | -4.21e-01 | -0.2034 |
| Page: 1 2 3 4 5 6 7 8 |
| Tissue | Expression Dynamics | Abbreviation |
| Colorectum (GSE201348) |  | FAP: Familial adenomatous polyposis |
| CRC: Colorectal cancer | ||
| Colorectum (HTA11) |  | AD: Adenomas |
| SER: Sessile serrated lesions | ||
| MSI-H: Microsatellite-high colorectal cancer | ||
| MSS: Microsatellite stable colorectal cancer | ||
| Esophagus | 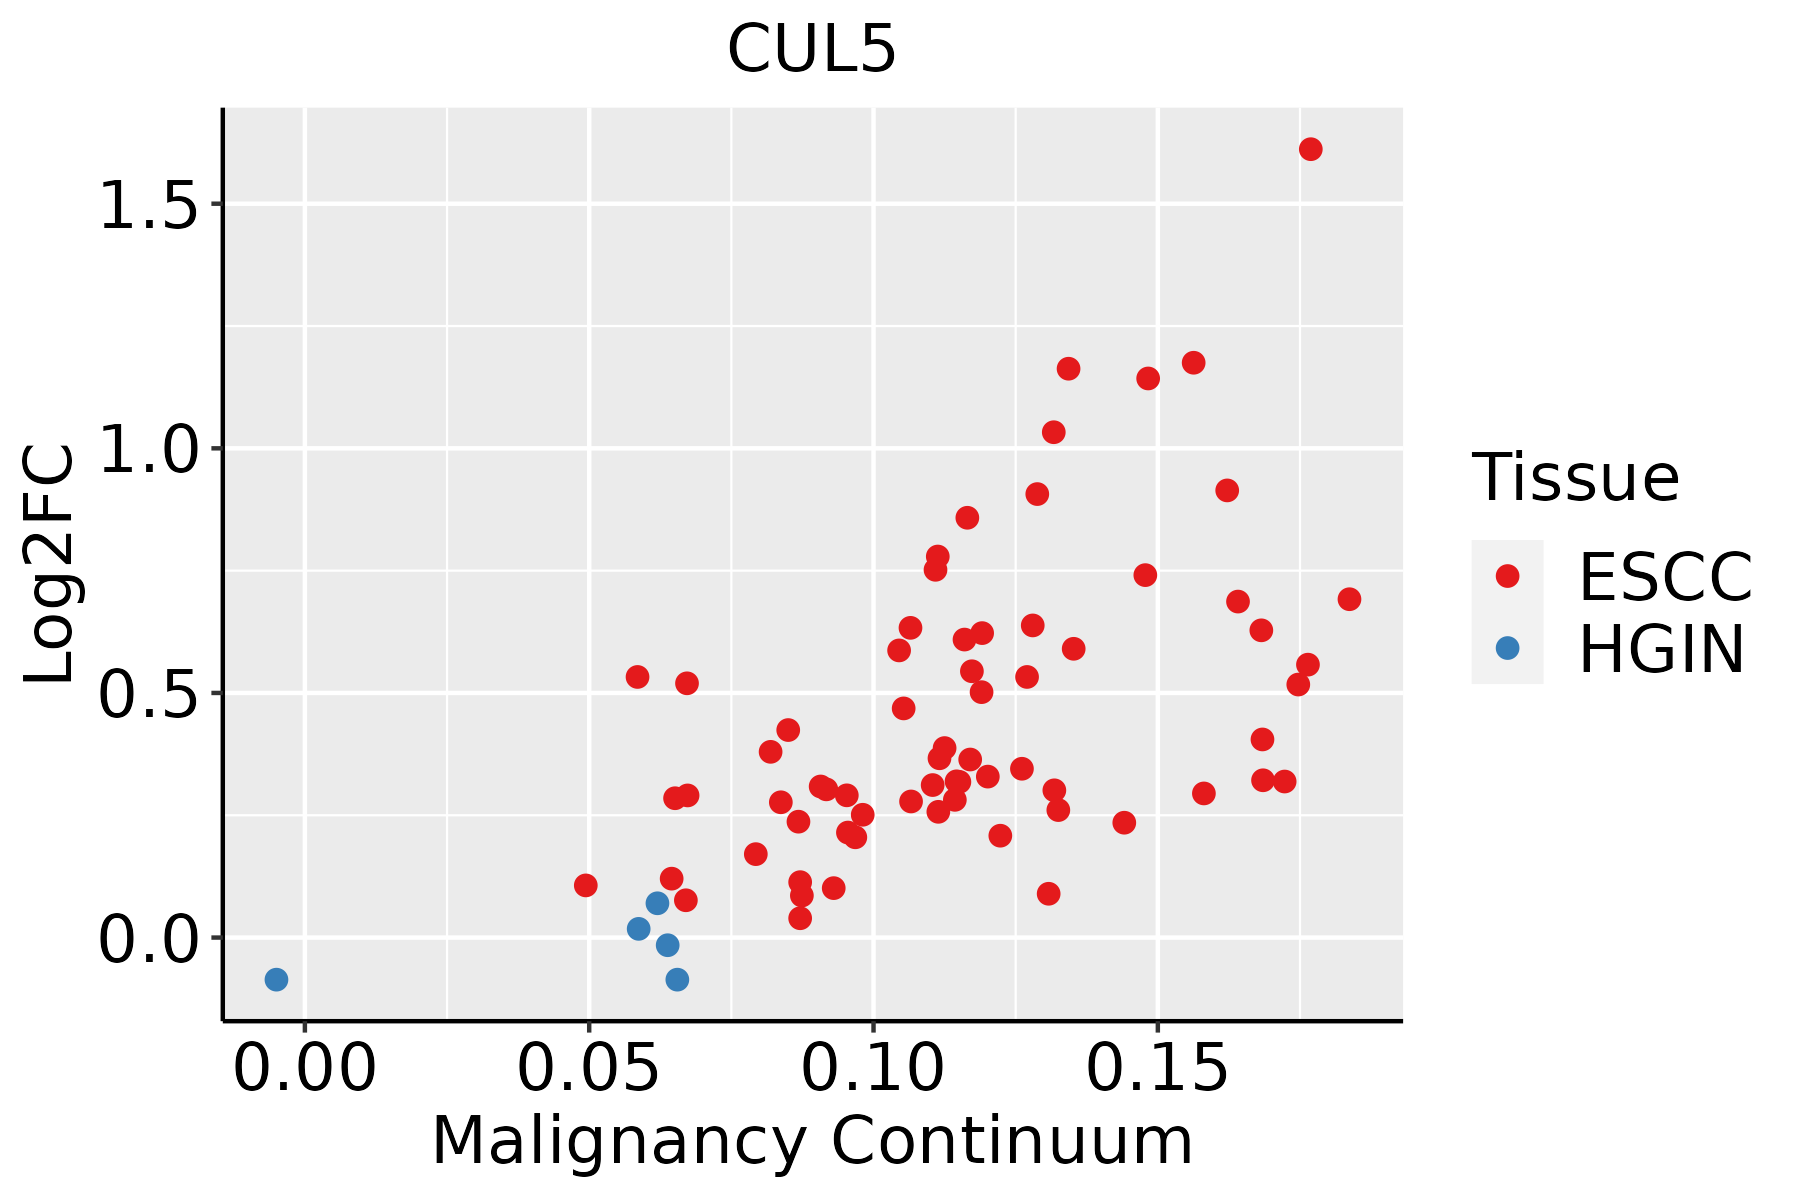 | ESCC: Esophageal squamous cell carcinoma |
| HGIN: High-grade intraepithelial neoplasias | ||
| LGIN: Low-grade intraepithelial neoplasias | ||
| Liver |  | HCC: Hepatocellular carcinoma |
| NAFLD: Non-alcoholic fatty liver disease | ||
| Lung |  | AAH: Atypical adenomatous hyperplasia |
| AIS: Adenocarcinoma in situ | ||
| IAC: Invasive lung adenocarcinoma | ||
| MIA: Minimally invasive adenocarcinoma | ||
| Oral Cavity |  | EOLP: Erosive Oral lichen planus |
| LP: leukoplakia | ||
| NEOLP: Non-erosive oral lichen planus | ||
| OSCC: Oral squamous cell carcinoma | ||
| Skin | 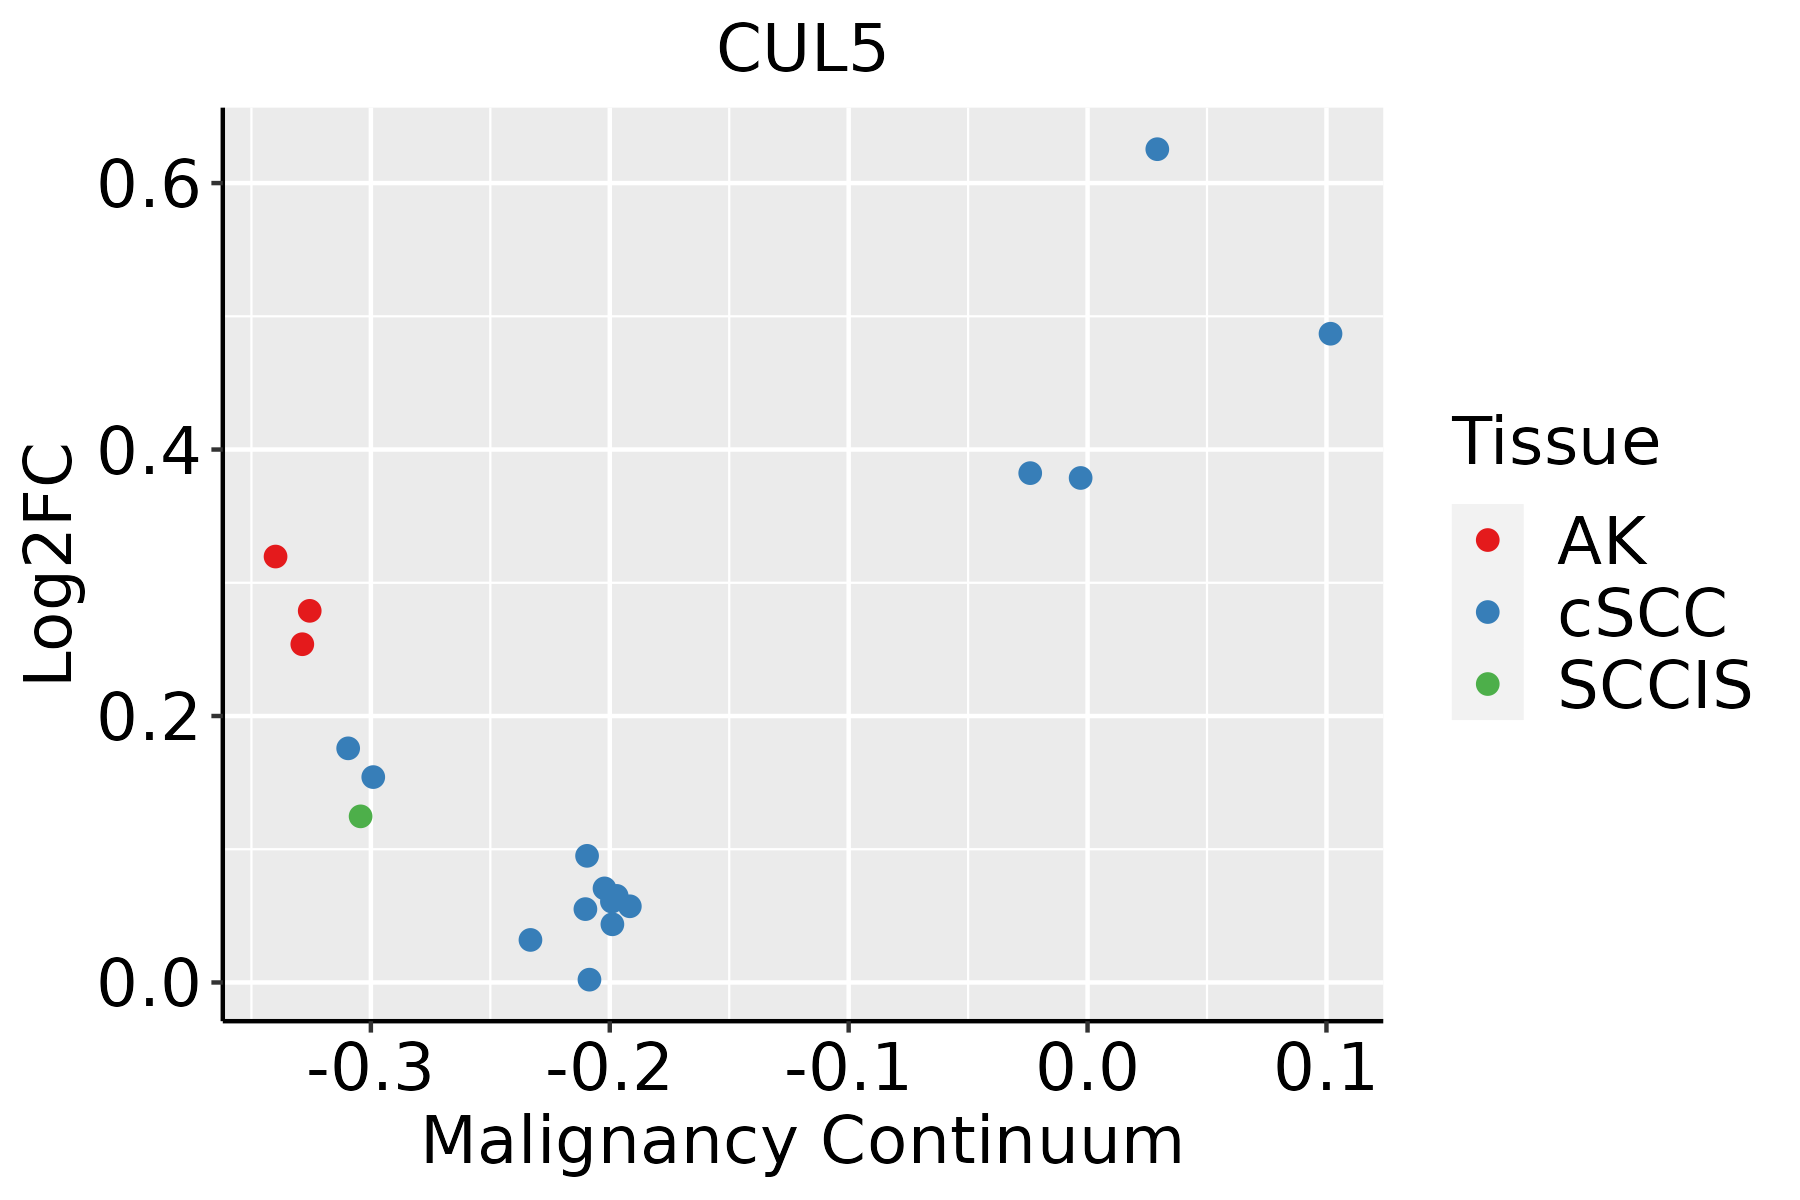 | AK: Actinic keratosis |
| cSCC: Cutaneous squamous cell carcinoma | ||
| SCCIS:squamous cell carcinoma in situ | ||
| Thyroid | 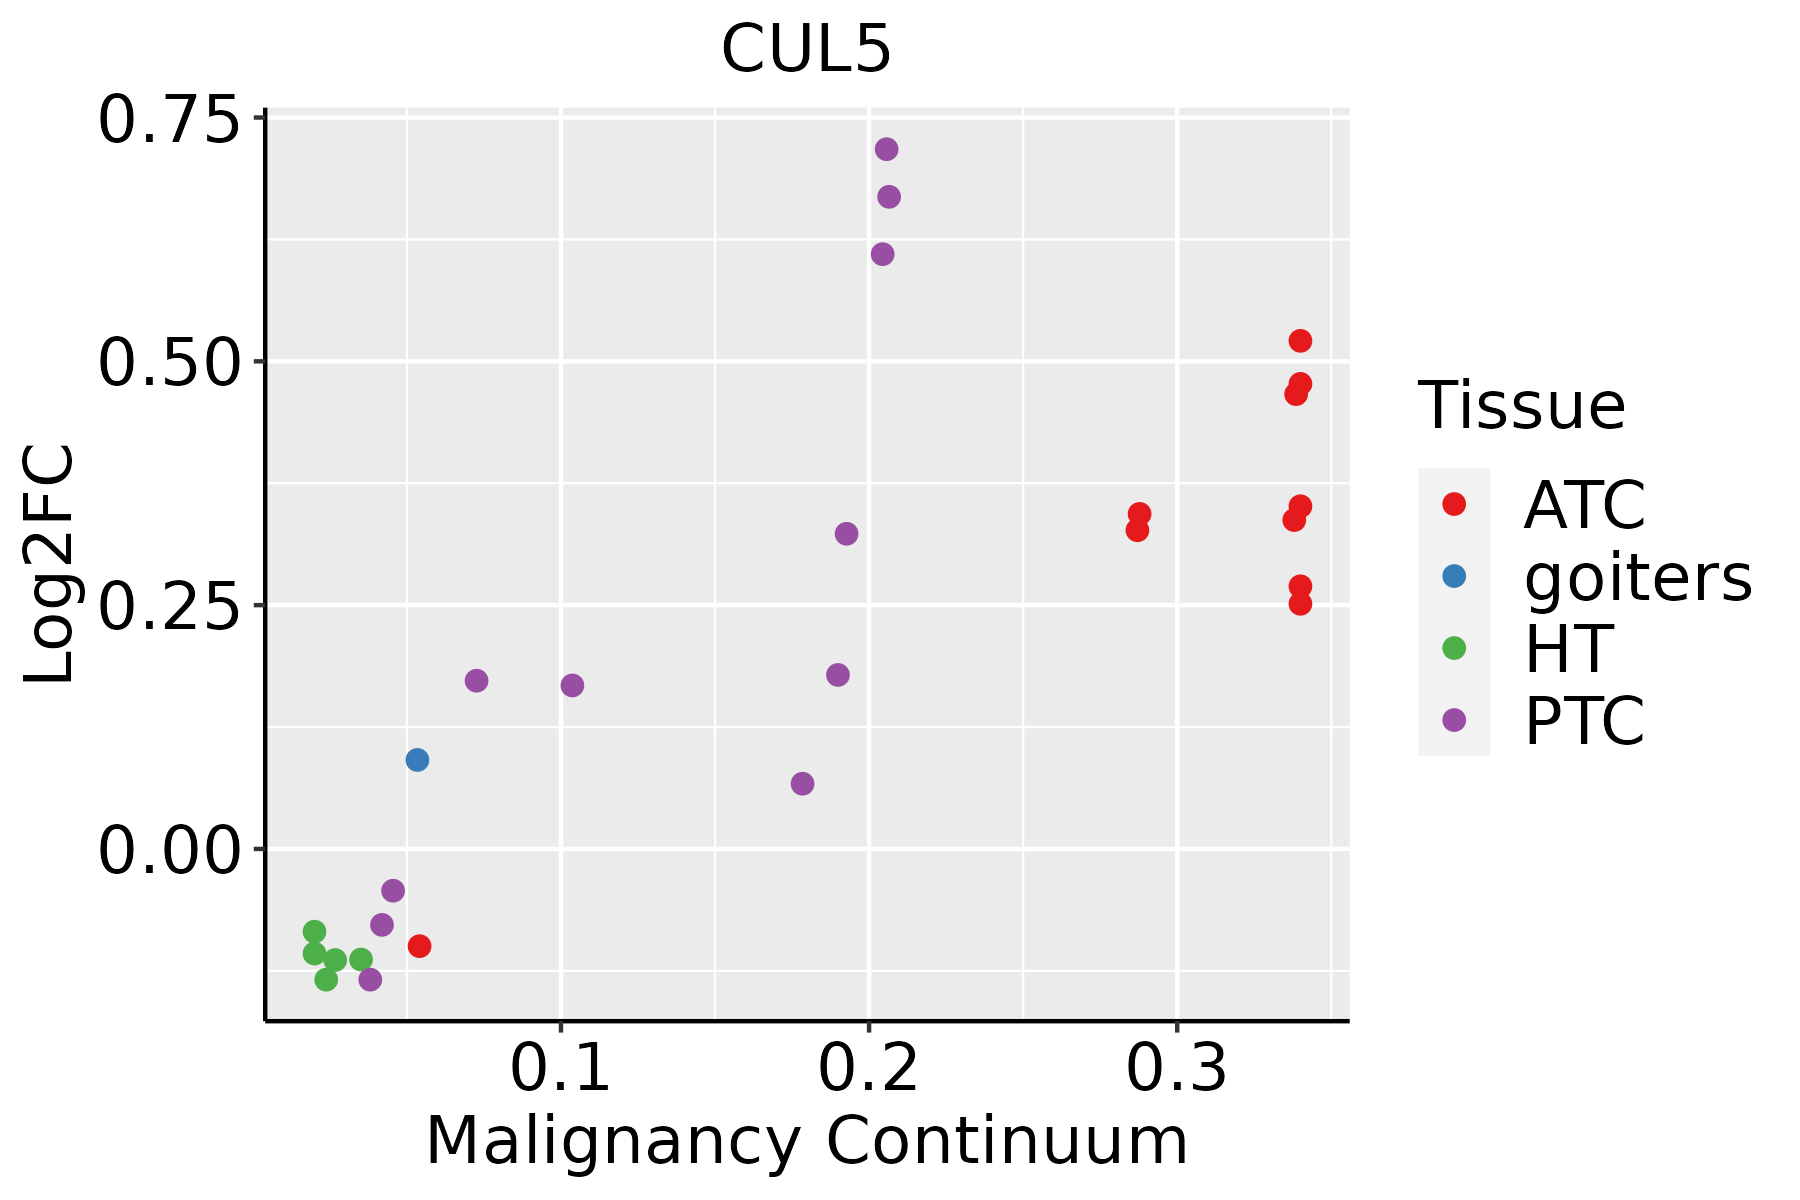 | ATC: Anaplastic thyroid cancer |
| HT: Hashimoto's thyroiditis | ||
| PTC: Papillary thyroid cancer |
| ∗log2FC in expression of this searched gene in stem-like cells from each diseased tissue sample relative to stem-like cells in normal samples in each tissue plotted against the malignancy continuum. Samples are colored based on if they are from different disease stage. |
Top |
Malignant transformation related pathway analysis |
| Find out the enriched GO biological processes and KEGG pathways involved in transition from healthy to precancer to cancer |
| Tissue | Disease Stage | Enriched GO biological Processes |
| Colorectum | AD |  |
| Colorectum | SER |  |
| Colorectum | MSS |  |
| Colorectum | MSI-H |  |
| Colorectum | FAP |  |
| ∗Top 15 enriched GO BP terms are showed in the bar plot of each disease state in each tissue. Each row represents a significant GO biological process which is colored according to the -log10(p.adjust). |
| Page: 1 2 3 4 5 6 7 8 9 |
| GO ID | Tissue | Disease Stage | Description | Gene Ratio | Bg Ratio | pvalue | p.adjust | Count |
| GO:0010498 | Colorectum | AD | proteasomal protein catabolic process | 174/3918 | 490/18723 | 3.18e-14 | 7.66e-12 | 174 |
| GO:0097193 | Colorectum | AD | intrinsic apoptotic signaling pathway | 108/3918 | 288/18723 | 6.25e-11 | 6.41e-09 | 108 |
| GO:0043161 | Colorectum | AD | proteasome-mediated ubiquitin-dependent protein catabolic process | 141/3918 | 412/18723 | 1.77e-10 | 1.68e-08 | 141 |
| GO:0038127 | Colorectum | AD | ERBB signaling pathway | 55/3918 | 121/18723 | 1.19e-09 | 8.85e-08 | 55 |
| GO:00104982 | Colorectum | MSS | proteasomal protein catabolic process | 157/3467 | 490/18723 | 2.39e-13 | 5.25e-11 | 157 |
| GO:00971932 | Colorectum | MSS | intrinsic apoptotic signaling pathway | 102/3467 | 288/18723 | 6.06e-12 | 9.82e-10 | 102 |
| GO:00431612 | Colorectum | MSS | proteasome-mediated ubiquitin-dependent protein catabolic process | 127/3467 | 412/18723 | 7.70e-10 | 6.32e-08 | 127 |
| GO:00381272 | Colorectum | MSS | ERBB signaling pathway | 46/3467 | 121/18723 | 3.63e-07 | 1.45e-05 | 46 |
| GO:00381274 | Colorectum | FAP | ERBB signaling pathway | 45/2622 | 121/18723 | 1.64e-10 | 4.38e-08 | 45 |
| GO:00431614 | Colorectum | FAP | proteasome-mediated ubiquitin-dependent protein catabolic process | 98/2622 | 412/18723 | 5.41e-08 | 4.20e-06 | 98 |
| GO:00104984 | Colorectum | FAP | proteasomal protein catabolic process | 110/2622 | 490/18723 | 2.12e-07 | 1.26e-05 | 110 |
| GO:00971934 | Colorectum | FAP | intrinsic apoptotic signaling pathway | 66/2622 | 288/18723 | 2.76e-05 | 6.33e-04 | 66 |
| GO:00381275 | Colorectum | CRC | ERBB signaling pathway | 41/2078 | 121/18723 | 2.12e-11 | 1.59e-08 | 41 |
| GO:00971935 | Colorectum | CRC | intrinsic apoptotic signaling pathway | 57/2078 | 288/18723 | 9.77e-06 | 3.31e-04 | 57 |
| GO:00431615 | Colorectum | CRC | proteasome-mediated ubiquitin-dependent protein catabolic process | 69/2078 | 412/18723 | 3.16e-04 | 4.90e-03 | 69 |
| GO:00104985 | Colorectum | CRC | proteasomal protein catabolic process | 77/2078 | 490/18723 | 1.03e-03 | 1.21e-02 | 77 |
| GO:0010498111 | Esophagus | ESCC | proteasomal protein catabolic process | 369/8552 | 490/18723 | 1.13e-41 | 1.80e-38 | 369 |
| GO:0043161111 | Esophagus | ESCC | proteasome-mediated ubiquitin-dependent protein catabolic process | 312/8552 | 412/18723 | 3.53e-36 | 4.48e-33 | 312 |
| GO:0097193111 | Esophagus | ESCC | intrinsic apoptotic signaling pathway | 222/8552 | 288/18723 | 5.87e-28 | 2.02e-25 | 222 |
| GO:004477216 | Esophagus | ESCC | mitotic cell cycle phase transition | 281/8552 | 424/18723 | 4.63e-18 | 4.45e-16 | 281 |
| Page: 1 2 3 4 5 6 |
| Pathway ID | Tissue | Disease Stage | Description | Gene Ratio | Bg Ratio | pvalue | p.adjust | qvalue | Count |
| hsa04120 | Colorectum | AD | Ubiquitin mediated proteolysis | 58/2092 | 142/8465 | 1.46e-05 | 1.53e-04 | 9.76e-05 | 58 |
| hsa05170 | Colorectum | AD | Human immunodeficiency virus 1 infection | 72/2092 | 212/8465 | 1.40e-03 | 8.46e-03 | 5.39e-03 | 72 |
| hsa041201 | Colorectum | AD | Ubiquitin mediated proteolysis | 58/2092 | 142/8465 | 1.46e-05 | 1.53e-04 | 9.76e-05 | 58 |
| hsa051701 | Colorectum | AD | Human immunodeficiency virus 1 infection | 72/2092 | 212/8465 | 1.40e-03 | 8.46e-03 | 5.39e-03 | 72 |
| hsa041204 | Colorectum | MSS | Ubiquitin mediated proteolysis | 55/1875 | 142/8465 | 5.02e-06 | 6.00e-05 | 3.68e-05 | 55 |
| hsa051704 | Colorectum | MSS | Human immunodeficiency virus 1 infection | 69/1875 | 212/8465 | 2.66e-04 | 1.98e-03 | 1.21e-03 | 69 |
| hsa041205 | Colorectum | MSS | Ubiquitin mediated proteolysis | 55/1875 | 142/8465 | 5.02e-06 | 6.00e-05 | 3.68e-05 | 55 |
| hsa051705 | Colorectum | MSS | Human immunodeficiency virus 1 infection | 69/1875 | 212/8465 | 2.66e-04 | 1.98e-03 | 1.21e-03 | 69 |
| hsa041206 | Colorectum | FAP | Ubiquitin mediated proteolysis | 51/1404 | 142/8465 | 1.55e-08 | 5.84e-07 | 3.55e-07 | 51 |
| hsa051706 | Colorectum | FAP | Human immunodeficiency virus 1 infection | 51/1404 | 212/8465 | 2.98e-03 | 1.29e-02 | 7.87e-03 | 51 |
| hsa041207 | Colorectum | FAP | Ubiquitin mediated proteolysis | 51/1404 | 142/8465 | 1.55e-08 | 5.84e-07 | 3.55e-07 | 51 |
| hsa051707 | Colorectum | FAP | Human immunodeficiency virus 1 infection | 51/1404 | 212/8465 | 2.98e-03 | 1.29e-02 | 7.87e-03 | 51 |
| hsa041208 | Colorectum | CRC | Ubiquitin mediated proteolysis | 42/1091 | 142/8465 | 9.98e-08 | 6.67e-06 | 4.52e-06 | 42 |
| hsa041209 | Colorectum | CRC | Ubiquitin mediated proteolysis | 42/1091 | 142/8465 | 9.98e-08 | 6.67e-06 | 4.52e-06 | 42 |
| hsa0412027 | Esophagus | ESCC | Ubiquitin mediated proteolysis | 122/4205 | 142/8465 | 6.53e-20 | 7.29e-18 | 3.74e-18 | 122 |
| hsa05170210 | Esophagus | ESCC | Human immunodeficiency virus 1 infection | 147/4205 | 212/8465 | 3.37e-09 | 3.53e-08 | 1.81e-08 | 147 |
| hsa0412036 | Esophagus | ESCC | Ubiquitin mediated proteolysis | 122/4205 | 142/8465 | 6.53e-20 | 7.29e-18 | 3.74e-18 | 122 |
| hsa0517038 | Esophagus | ESCC | Human immunodeficiency virus 1 infection | 147/4205 | 212/8465 | 3.37e-09 | 3.53e-08 | 1.81e-08 | 147 |
| hsa0412010 | Liver | NAFLD | Ubiquitin mediated proteolysis | 44/1043 | 142/8465 | 2.59e-09 | 1.70e-07 | 1.37e-07 | 44 |
| hsa0412011 | Liver | NAFLD | Ubiquitin mediated proteolysis | 44/1043 | 142/8465 | 2.59e-09 | 1.70e-07 | 1.37e-07 | 44 |
| Page: 1 2 3 |
Top |
Cell-cell communication analysis |
| Identification of potential cell-cell interactions between two cell types and their ligand-receptor pairs for different disease states |
| Ligand | Receptor | LRpair | Pathway | Tissue | Disease Stage |
| Page: 1 |
Top |
Single-cell gene regulatory network inference analysis |
| Find out the significant the regulons (TFs) and the target genes of each regulon across cell types for different disease states |
| TF | Cell Type | Tissue | Disease Stage | Target Gene | RSS | Regulon Activity |
| ∗The dot plots of a searched regulon are shown for all cell subpopulations in each disease state of each tissue based on the regulon specific score inferred using pySCENIC and by calculating the average expression. |
| Page: 1 |
Top |
Somatic mutation of malignant transformation related genes |
| Annotation of somatic variants for genes involved in malignant transformation |
| Hugo Symbol | Variant Class | Variant Classification | dbSNP RS | HGVSc | HGVSp | HGVSp Short | SWISSPROT | BIOTYPE | SIFT | PolyPhen | Tumor Sample Barcode | Tissue | Histology | Sex | Age | Stage | Therapy Types | Drugs | Outcome |
| CUL5 | SNV | Missense_Mutation | rs754810606 | c.1091N>A | p.Arg364Gln | p.R364Q | Q93034 | protein_coding | deleterious(0.01) | probably_damaging(0.98) | TCGA-AN-A046-01 | Breast | breast invasive carcinoma | Female | >=65 | I/II | Unknown | Unknown | SD |
| CUL5 | SNV | Missense_Mutation | c.1960G>A | p.Val654Ile | p.V654I | Q93034 | protein_coding | tolerated(0.21) | benign(0.013) | TCGA-AN-A0AT-01 | Breast | breast invasive carcinoma | Female | <65 | I/II | Unknown | Unknown | SD | |
| CUL5 | SNV | Missense_Mutation | c.760N>C | p.Glu254Gln | p.E254Q | Q93034 | protein_coding | tolerated(0.39) | benign(0.05) | TCGA-BH-A1EV-01 | Breast | breast invasive carcinoma | Female | <65 | III/IV | Unknown | Unknown | PD | |
| CUL5 | SNV | Missense_Mutation | c.2256N>C | p.Met752Ile | p.M752I | Q93034 | protein_coding | tolerated(0.1) | benign(0.098) | TCGA-BH-A1EV-01 | Breast | breast invasive carcinoma | Female | <65 | III/IV | Unknown | Unknown | PD | |
| CUL5 | SNV | Missense_Mutation | rs754810606 | c.1091N>A | p.Arg364Gln | p.R364Q | Q93034 | protein_coding | deleterious(0.01) | probably_damaging(0.98) | TCGA-2W-A8YY-01 | Cervix | cervical & endocervical cancer | Female | <65 | I/II | Chemotherapy | cisplatin | CR |
| CUL5 | SNV | Missense_Mutation | c.1967C>T | p.Ser656Leu | p.S656L | Q93034 | protein_coding | deleterious(0) | possibly_damaging(0.703) | TCGA-JX-A3Q0-01 | Cervix | cervical & endocervical cancer | Female | <65 | III/IV | Unknown | Unknown | SD | |
| CUL5 | SNV | Missense_Mutation | c.1534N>A | p.Glu512Lys | p.E512K | Q93034 | protein_coding | tolerated(0.37) | benign(0.017) | TCGA-LP-A4AV-01 | Cervix | cervical & endocervical cancer | Female | <65 | I/II | Unknown | Unknown | SD | |
| CUL5 | SNV | Missense_Mutation | novel | c.852N>A | p.Met284Ile | p.M284I | Q93034 | protein_coding | deleterious(0.02) | benign(0.041) | TCGA-VS-A9V5-01 | Cervix | cervical & endocervical cancer | Female | <65 | I/II | Chemotherapy | carboplatin | PD |
| CUL5 | SNV | Missense_Mutation | c.232G>A | p.Ala78Thr | p.A78T | Q93034 | protein_coding | tolerated(0.47) | benign(0.001) | TCGA-A6-2686-01 | Colorectum | colon adenocarcinoma | Female | >=65 | I/II | Unknown | Unknown | SD | |
| CUL5 | SNV | Missense_Mutation | c.134N>T | p.Ser45Leu | p.S45L | Q93034 | protein_coding | tolerated(0.63) | benign(0.023) | TCGA-AA-3675-01 | Colorectum | colon adenocarcinoma | Male | >=65 | I/II | Unknown | Unknown | SD |
| Page: 1 2 3 4 5 6 7 8 9 |
Top |
Related drugs of malignant transformation related genes |
| Identification of chemicals and drugs interact with genes involved in malignant transfromation |
| (DGIdb 4.0) |
| Entrez ID | Symbol | Category | Interaction Types | Drug Claim Name | Drug Name | PMIDs |
| Page: 1 |

Copyright 2023-Present -The University of Texas Health Science Center at Houston |