| Tissue | Expression Dynamics | Abbreviation |
| Cervix | 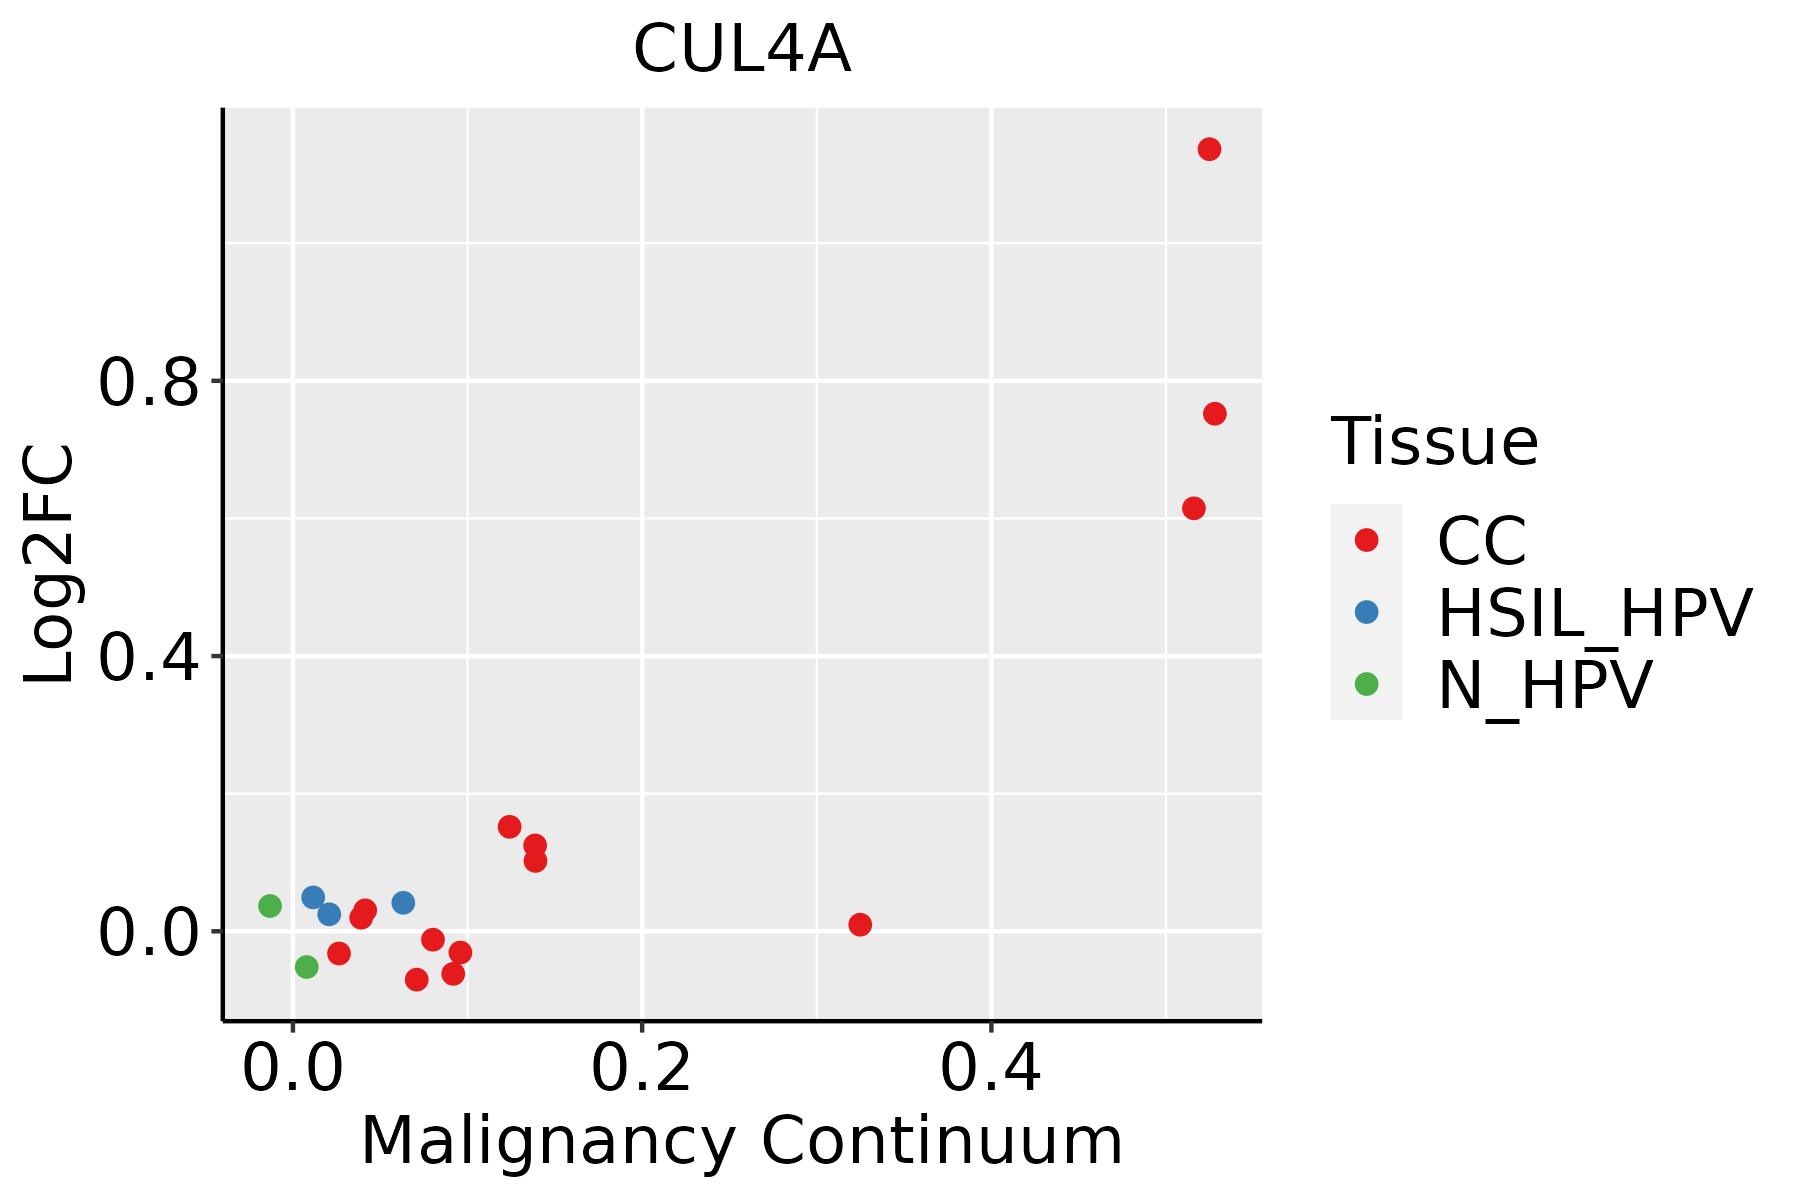 | CC: Cervix cancer |
| HSIL_HPV: HPV-infected high-grade squamous intraepithelial lesions |
| N_HPV: HPV-infected normal cervix |
| Colorectum (GSE201348) |  | FAP: Familial adenomatous polyposis |
| CRC: Colorectal cancer |
| Colorectum (HTA11) |  | AD: Adenomas |
| SER: Sessile serrated lesions |
| MSI-H: Microsatellite-high colorectal cancer |
| MSS: Microsatellite stable colorectal cancer |
| Esophagus | 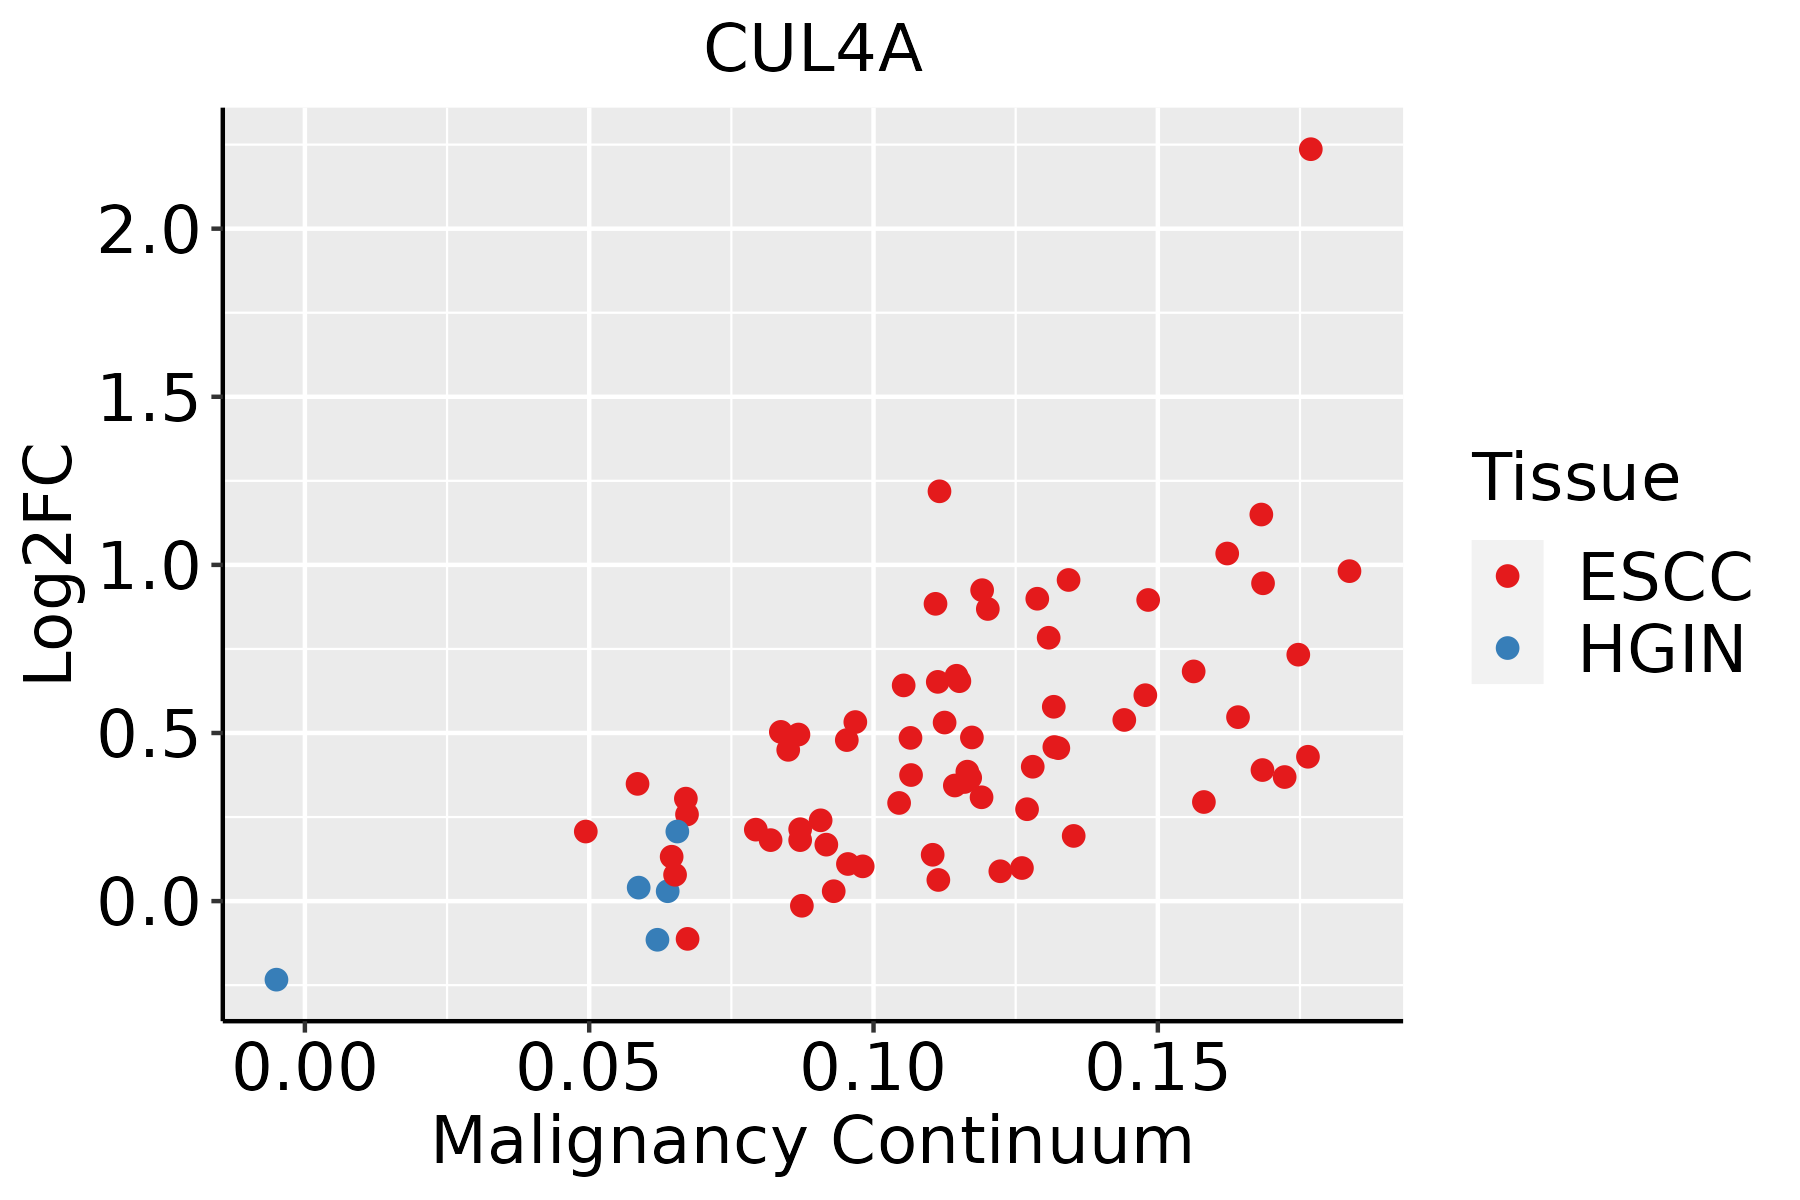 | ESCC: Esophageal squamous cell carcinoma |
| HGIN: High-grade intraepithelial neoplasias |
| LGIN: Low-grade intraepithelial neoplasias |
| Liver | 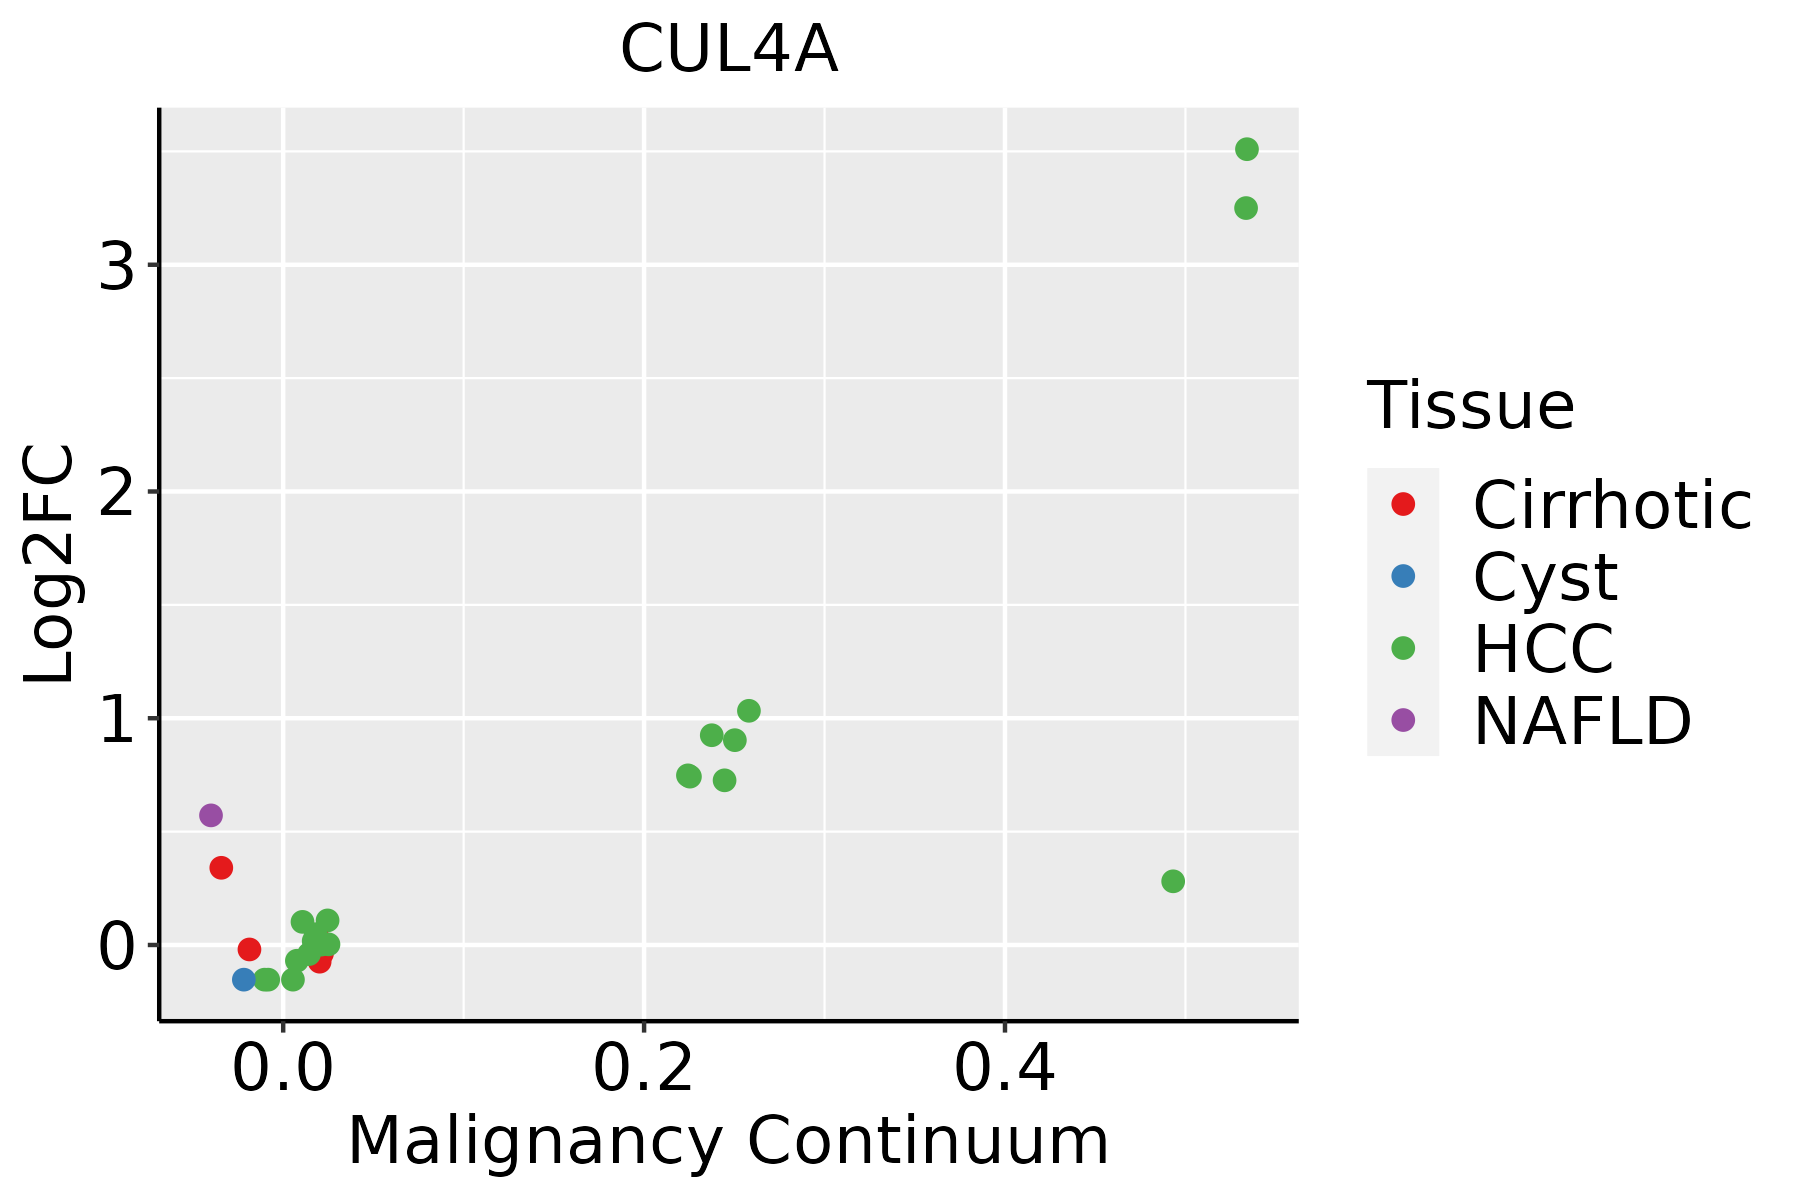 | HCC: Hepatocellular carcinoma |
| NAFLD: Non-alcoholic fatty liver disease |
| Oral Cavity | 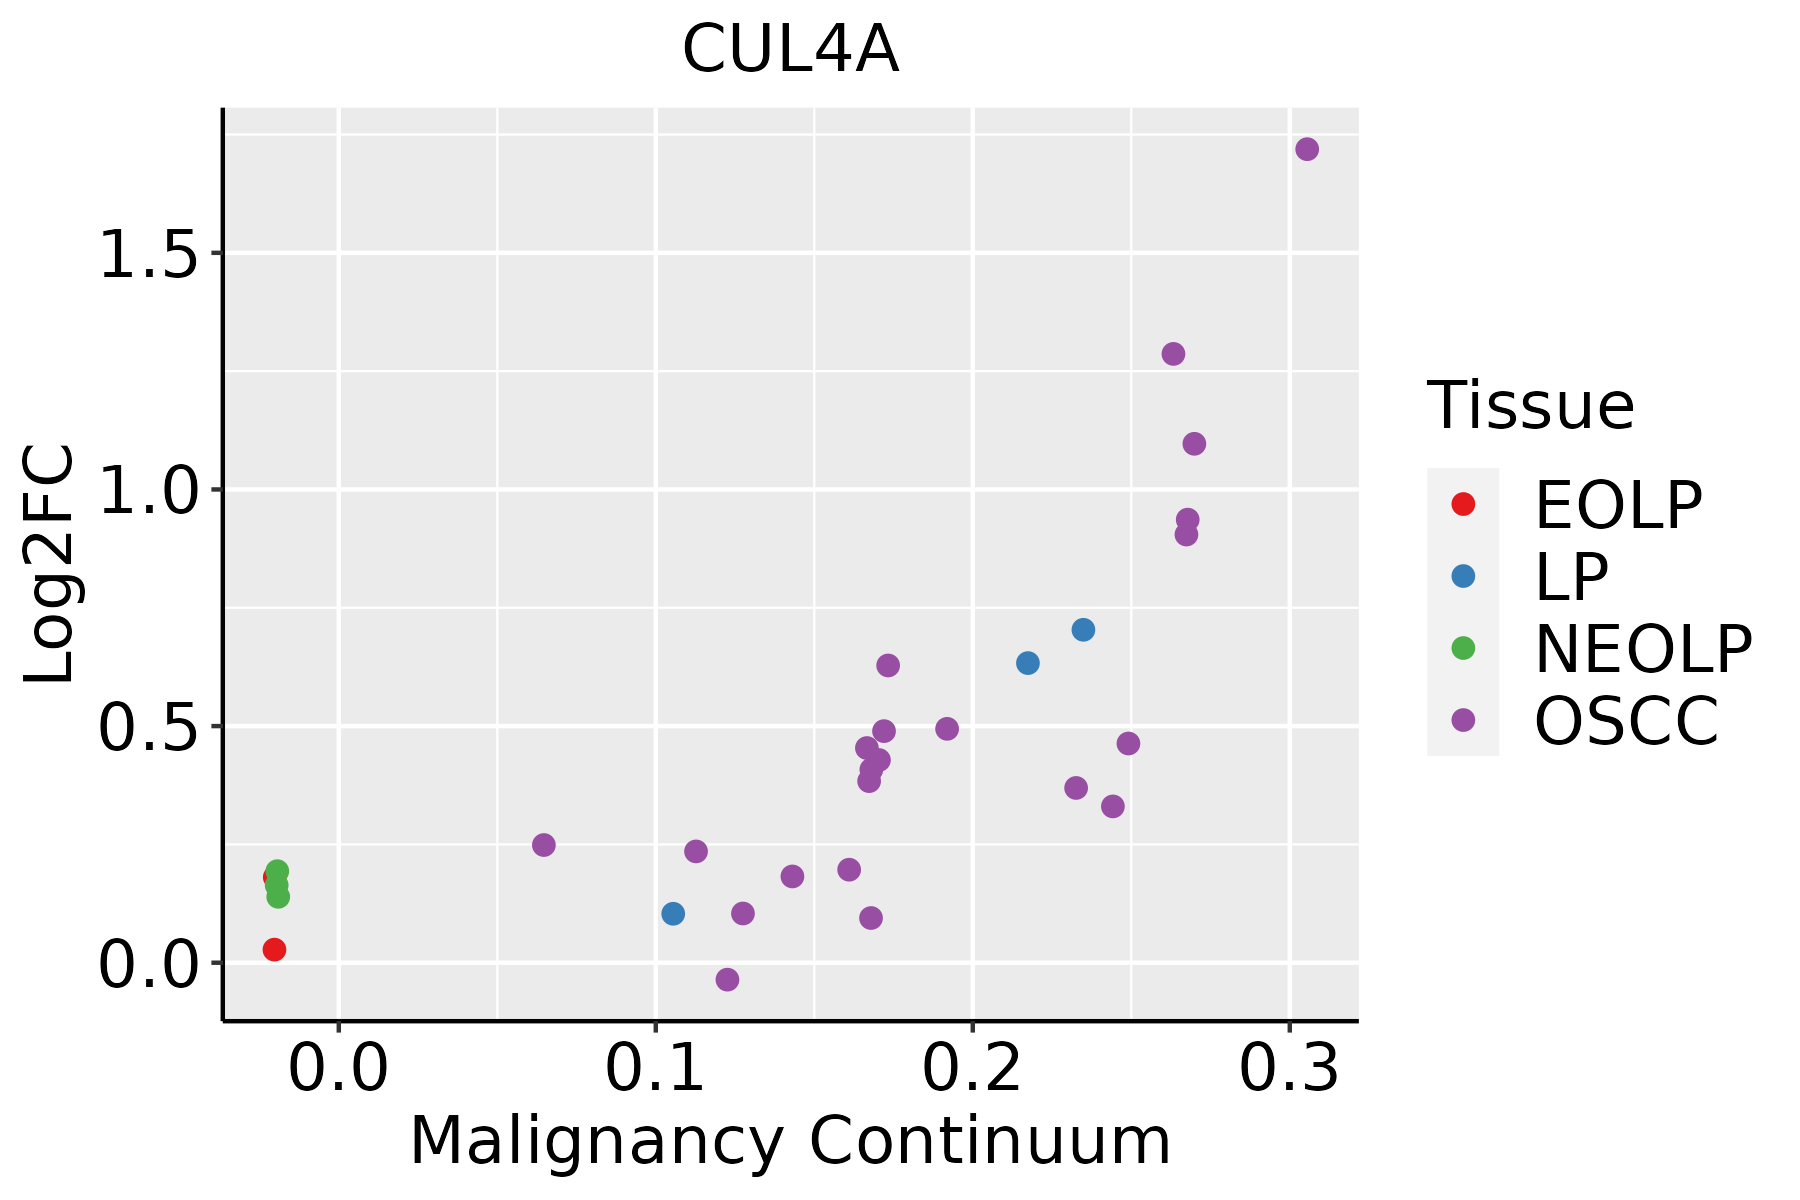 | EOLP: Erosive Oral lichen planus |
| LP: leukoplakia |
| NEOLP: Non-erosive oral lichen planus |
| OSCC: Oral squamous cell carcinoma |
| Skin |  | AK: Actinic keratosis |
| cSCC: Cutaneous squamous cell carcinoma |
| SCCIS:squamous cell carcinoma in situ |
| GO ID | Tissue | Disease Stage | Description | Gene Ratio | Bg Ratio | pvalue | p.adjust | Count |
| GO:009719310 | Cervix | CC | intrinsic apoptotic signaling pathway | 85/2311 | 288/18723 | 4.56e-15 | 6.46e-12 | 85 |
| GO:001049810 | Cervix | CC | proteasomal protein catabolic process | 111/2311 | 490/18723 | 8.98e-11 | 1.58e-08 | 111 |
| GO:004316110 | Cervix | CC | proteasome-mediated ubiquitin-dependent protein catabolic process | 91/2311 | 412/18723 | 1.65e-08 | 1.25e-06 | 91 |
| GO:00026837 | Cervix | CC | negative regulation of immune system process | 94/2311 | 434/18723 | 2.63e-08 | 1.87e-06 | 94 |
| GO:003009910 | Cervix | CC | myeloid cell differentiation | 83/2311 | 381/18723 | 1.31e-07 | 6.42e-06 | 83 |
| GO:190370610 | Cervix | CC | regulation of hemopoiesis | 80/2311 | 367/18723 | 2.14e-07 | 9.55e-06 | 80 |
| GO:00447725 | Cervix | CC | mitotic cell cycle phase transition | 89/2311 | 424/18723 | 2.70e-07 | 1.12e-05 | 89 |
| GO:00485118 | Cervix | CC | rhythmic process | 65/2311 | 298/18723 | 2.79e-06 | 8.04e-05 | 65 |
| GO:19021056 | Cervix | CC | regulation of leukocyte differentiation | 61/2311 | 279/18723 | 5.16e-06 | 1.29e-04 | 61 |
| GO:20000453 | Cervix | CC | regulation of G1/S transition of mitotic cell cycle | 37/2311 | 142/18723 | 6.33e-06 | 1.53e-04 | 37 |
| GO:00457876 | Cervix | CC | positive regulation of cell cycle | 66/2311 | 313/18723 | 7.78e-06 | 1.81e-04 | 66 |
| GO:19021064 | Cervix | CC | negative regulation of leukocyte differentiation | 29/2311 | 102/18723 | 1.02e-05 | 2.29e-04 | 29 |
| GO:00000824 | Cervix | CC | G1/S transition of mitotic cell cycle | 49/2311 | 214/18723 | 1.16e-05 | 2.48e-04 | 49 |
| GO:19028062 | Cervix | CC | regulation of cell cycle G1/S phase transition | 41/2311 | 168/18723 | 1.18e-05 | 2.51e-04 | 41 |
| GO:00073466 | Cervix | CC | regulation of mitotic cell cycle | 88/2311 | 457/18723 | 1.26e-05 | 2.60e-04 | 88 |
| GO:19019903 | Cervix | CC | regulation of mitotic cell cycle phase transition | 63/2311 | 299/18723 | 1.27e-05 | 2.60e-04 | 63 |
| GO:004563710 | Cervix | CC | regulation of myeloid cell differentiation | 48/2311 | 210/18723 | 1.49e-05 | 2.93e-04 | 48 |
| GO:00448434 | Cervix | CC | cell cycle G1/S phase transition | 53/2311 | 241/18723 | 1.76e-05 | 3.32e-04 | 53 |
| GO:00459316 | Cervix | CC | positive regulation of mitotic cell cycle | 32/2311 | 121/18723 | 1.88e-05 | 3.47e-04 | 32 |
| GO:002261310 | Cervix | CC | ribonucleoprotein complex biogenesis | 88/2311 | 463/18723 | 2.11e-05 | 3.82e-04 | 88 |
| Pathway ID | Tissue | Disease Stage | Description | Gene Ratio | Bg Ratio | pvalue | p.adjust | qvalue | Count |
| hsa0412014 | Cervix | CC | Ubiquitin mediated proteolysis | 49/1267 | 142/8465 | 4.26e-09 | 7.68e-08 | 4.54e-08 | 49 |
| hsa0517016 | Cervix | CC | Human immunodeficiency virus 1 infection | 55/1267 | 212/8465 | 1.80e-05 | 1.42e-04 | 8.40e-05 | 55 |
| hsa0412015 | Cervix | CC | Ubiquitin mediated proteolysis | 49/1267 | 142/8465 | 4.26e-09 | 7.68e-08 | 4.54e-08 | 49 |
| hsa0517017 | Cervix | CC | Human immunodeficiency virus 1 infection | 55/1267 | 212/8465 | 1.80e-05 | 1.42e-04 | 8.40e-05 | 55 |
| hsa04120 | Colorectum | AD | Ubiquitin mediated proteolysis | 58/2092 | 142/8465 | 1.46e-05 | 1.53e-04 | 9.76e-05 | 58 |
| hsa05170 | Colorectum | AD | Human immunodeficiency virus 1 infection | 72/2092 | 212/8465 | 1.40e-03 | 8.46e-03 | 5.39e-03 | 72 |
| hsa041201 | Colorectum | AD | Ubiquitin mediated proteolysis | 58/2092 | 142/8465 | 1.46e-05 | 1.53e-04 | 9.76e-05 | 58 |
| hsa051701 | Colorectum | AD | Human immunodeficiency virus 1 infection | 72/2092 | 212/8465 | 1.40e-03 | 8.46e-03 | 5.39e-03 | 72 |
| hsa041204 | Colorectum | MSS | Ubiquitin mediated proteolysis | 55/1875 | 142/8465 | 5.02e-06 | 6.00e-05 | 3.68e-05 | 55 |
| hsa051704 | Colorectum | MSS | Human immunodeficiency virus 1 infection | 69/1875 | 212/8465 | 2.66e-04 | 1.98e-03 | 1.21e-03 | 69 |
| hsa041205 | Colorectum | MSS | Ubiquitin mediated proteolysis | 55/1875 | 142/8465 | 5.02e-06 | 6.00e-05 | 3.68e-05 | 55 |
| hsa051705 | Colorectum | MSS | Human immunodeficiency virus 1 infection | 69/1875 | 212/8465 | 2.66e-04 | 1.98e-03 | 1.21e-03 | 69 |
| hsa041206 | Colorectum | FAP | Ubiquitin mediated proteolysis | 51/1404 | 142/8465 | 1.55e-08 | 5.84e-07 | 3.55e-07 | 51 |
| hsa051706 | Colorectum | FAP | Human immunodeficiency virus 1 infection | 51/1404 | 212/8465 | 2.98e-03 | 1.29e-02 | 7.87e-03 | 51 |
| hsa041207 | Colorectum | FAP | Ubiquitin mediated proteolysis | 51/1404 | 142/8465 | 1.55e-08 | 5.84e-07 | 3.55e-07 | 51 |
| hsa051707 | Colorectum | FAP | Human immunodeficiency virus 1 infection | 51/1404 | 212/8465 | 2.98e-03 | 1.29e-02 | 7.87e-03 | 51 |
| hsa041208 | Colorectum | CRC | Ubiquitin mediated proteolysis | 42/1091 | 142/8465 | 9.98e-08 | 6.67e-06 | 4.52e-06 | 42 |
| hsa041209 | Colorectum | CRC | Ubiquitin mediated proteolysis | 42/1091 | 142/8465 | 9.98e-08 | 6.67e-06 | 4.52e-06 | 42 |
| hsa034205 | Esophagus | HGIN | Nucleotide excision repair | 29/1383 | 63/8465 | 2.96e-08 | 5.36e-07 | 4.26e-07 | 29 |
| hsa0412026 | Esophagus | HGIN | Ubiquitin mediated proteolysis | 49/1383 | 142/8465 | 7.78e-08 | 1.33e-06 | 1.06e-06 | 49 |
| Hugo Symbol | Variant Class | Variant Classification | dbSNP RS | HGVSc | HGVSp | HGVSp Short | SWISSPROT | BIOTYPE | SIFT | PolyPhen | Tumor Sample Barcode | Tissue | Histology | Sex | Age | Stage | Therapy Types | Drugs | Outcome |
| CUL4A | SNV | Missense_Mutation | novel | c.2189N>A | p.Gly730Glu | p.G730E | Q13619 | protein_coding | tolerated(0.06) | benign(0.027) | TCGA-5L-AAT1-01 | Breast | breast invasive carcinoma | Female | <65 | III/IV | Hormone Therapy | letrozol | SD |
| CUL4A | SNV | Missense_Mutation | novel | c.281G>C | p.Cys94Ser | p.C94S | Q13619 | protein_coding | deleterious(0) | probably_damaging(0.933) | TCGA-5T-A9QA-01 | Breast | breast invasive carcinoma | Female | <65 | I/II | Chemotherapy | taxol | SD |
| CUL4A | SNV | Missense_Mutation | novel | c.635N>T | p.Ser212Ile | p.S212I | Q13619 | protein_coding | deleterious(0.03) | benign(0.312) | TCGA-C8-A26X-01 | Breast | breast invasive carcinoma | Female | <65 | I/II | Chemotherapy | 5-fluorouracil | CR |
| CUL4A | SNV | Missense_Mutation | | c.1305N>C | p.Lys435Asn | p.K435N | Q13619 | protein_coding | deleterious(0) | benign(0.223) | TCGA-D8-A1XF-01 | Breast | breast invasive carcinoma | Female | <65 | I/II | Chemotherapy | adriamycin+cyclophosphamide | SD |
| CUL4A | SNV | Missense_Mutation | rs749479685 | c.2081N>G | p.Tyr694Cys | p.Y694C | Q13619 | protein_coding | deleterious(0.02) | possibly_damaging(0.805) | TCGA-GM-A2DB-01 | Breast | breast invasive carcinoma | Female | <65 | I/II | Chemotherapy | taxol | CR |
| CUL4A | deletion | Frame_Shift_Del | novel | c.709delG | p.Glu237LysfsTer14 | p.E237Kfs*14 | Q13619 | protein_coding | | | TCGA-D8-A27V-01 | Breast | breast invasive carcinoma | Female | <65 | I/II | Hormone Therapy | tamoxiphen | SD |
| CUL4A | SNV | Missense_Mutation | | c.2017N>G | p.Gln673Glu | p.Q673E | Q13619 | protein_coding | deleterious(0) | possibly_damaging(0.63) | TCGA-DS-A0VN-01 | Cervix | cervical & endocervical cancer | Female | <65 | I/II | Chemotherapy | cisplatin | SD |
| CUL4A | SNV | Missense_Mutation | | c.2112N>A | p.Met704Ile | p.M704I | Q13619 | protein_coding | deleterious(0) | probably_damaging(0.993) | TCGA-Q1-A73O-01 | Cervix | cervical & endocervical cancer | Female | <65 | I/II | Chemotherapy | cisplatin | CR |
| CUL4A | SNV | Missense_Mutation | novel | c.1372N>A | p.Ala458Thr | p.A458T | Q13619 | protein_coding | deleterious(0) | probably_damaging(0.97) | TCGA-VS-A94Z-01 | Cervix | cervical & endocervical cancer | Female | <65 | I/II | Chemotherapy | cisplatin | CR |
| CUL4A | SNV | Missense_Mutation | rs201623121 | c.820G>A | p.Val274Ile | p.V274I | Q13619 | protein_coding | tolerated(0.2) | benign(0.009) | TCGA-A6-6653-01 | Colorectum | colon adenocarcinoma | Male | >=65 | I/II | Unknown | Unknown | SD |


