
|
|||||
|
 | |
| |
| |
| |
| |
| |
|
Gene: CUL2 |
Gene summary for CUL2 |
| Gene information | Species | Human | Gene symbol | CUL2 | Gene ID | 8453 |
| Gene name | cullin 2 | |
| Gene Alias | CUL2 | |
| Cytomap | 10p11.21 | |
| Gene Type | protein-coding | GO ID | GO:0000082 | UniProtAcc | A0A140VKB1 |
Top |
Malignant transformation analysis |
| Identification of the aberrant gene expression in precancerous and cancerous lesions by comparing the gene expression of stem-like cells in diseased tissues with normal stem cells |
| Entrez ID | Symbol | Replicates | Species | Organ | Tissue | Adj P-value | Log2FC | Malignancy |
| 8453 | CUL2 | LZE2T | Human | Esophagus | ESCC | 7.06e-10 | 9.61e-01 | 0.082 |
| 8453 | CUL2 | LZE4T | Human | Esophagus | ESCC | 2.74e-07 | 2.03e-01 | 0.0811 |
| 8453 | CUL2 | LZE8T | Human | Esophagus | ESCC | 6.94e-03 | 1.39e-01 | 0.067 |
| 8453 | CUL2 | LZE22T | Human | Esophagus | ESCC | 8.37e-04 | 3.76e-01 | 0.068 |
| 8453 | CUL2 | LZE24T | Human | Esophagus | ESCC | 2.16e-12 | 3.70e-01 | 0.0596 |
| 8453 | CUL2 | P2T-E | Human | Esophagus | ESCC | 5.26e-19 | 3.46e-01 | 0.1177 |
| 8453 | CUL2 | P4T-E | Human | Esophagus | ESCC | 3.16e-09 | 2.71e-01 | 0.1323 |
| 8453 | CUL2 | P5T-E | Human | Esophagus | ESCC | 2.36e-12 | 2.58e-01 | 0.1327 |
| 8453 | CUL2 | P8T-E | Human | Esophagus | ESCC | 1.17e-12 | 2.10e-01 | 0.0889 |
| 8453 | CUL2 | P10T-E | Human | Esophagus | ESCC | 2.39e-10 | 1.99e-01 | 0.116 |
| 8453 | CUL2 | P11T-E | Human | Esophagus | ESCC | 4.85e-10 | 4.02e-01 | 0.1426 |
| 8453 | CUL2 | P12T-E | Human | Esophagus | ESCC | 1.14e-26 | 4.67e-01 | 0.1122 |
| 8453 | CUL2 | P15T-E | Human | Esophagus | ESCC | 5.94e-22 | 4.51e-01 | 0.1149 |
| 8453 | CUL2 | P16T-E | Human | Esophagus | ESCC | 6.43e-24 | 3.74e-01 | 0.1153 |
| 8453 | CUL2 | P17T-E | Human | Esophagus | ESCC | 3.91e-04 | 2.76e-01 | 0.1278 |
| 8453 | CUL2 | P19T-E | Human | Esophagus | ESCC | 2.18e-04 | 3.95e-01 | 0.1662 |
| 8453 | CUL2 | P20T-E | Human | Esophagus | ESCC | 1.95e-07 | 2.05e-01 | 0.1124 |
| 8453 | CUL2 | P21T-E | Human | Esophagus | ESCC | 1.72e-26 | 5.81e-01 | 0.1617 |
| 8453 | CUL2 | P22T-E | Human | Esophagus | ESCC | 3.29e-07 | 1.83e-01 | 0.1236 |
| 8453 | CUL2 | P23T-E | Human | Esophagus | ESCC | 4.49e-11 | 2.78e-01 | 0.108 |
| Page: 1 2 3 4 5 |
| Tissue | Expression Dynamics | Abbreviation |
| Esophagus |  | ESCC: Esophageal squamous cell carcinoma |
| HGIN: High-grade intraepithelial neoplasias | ||
| LGIN: Low-grade intraepithelial neoplasias | ||
| Liver |  | HCC: Hepatocellular carcinoma |
| NAFLD: Non-alcoholic fatty liver disease | ||
| Oral Cavity |  | EOLP: Erosive Oral lichen planus |
| LP: leukoplakia | ||
| NEOLP: Non-erosive oral lichen planus | ||
| OSCC: Oral squamous cell carcinoma | ||
| Skin | 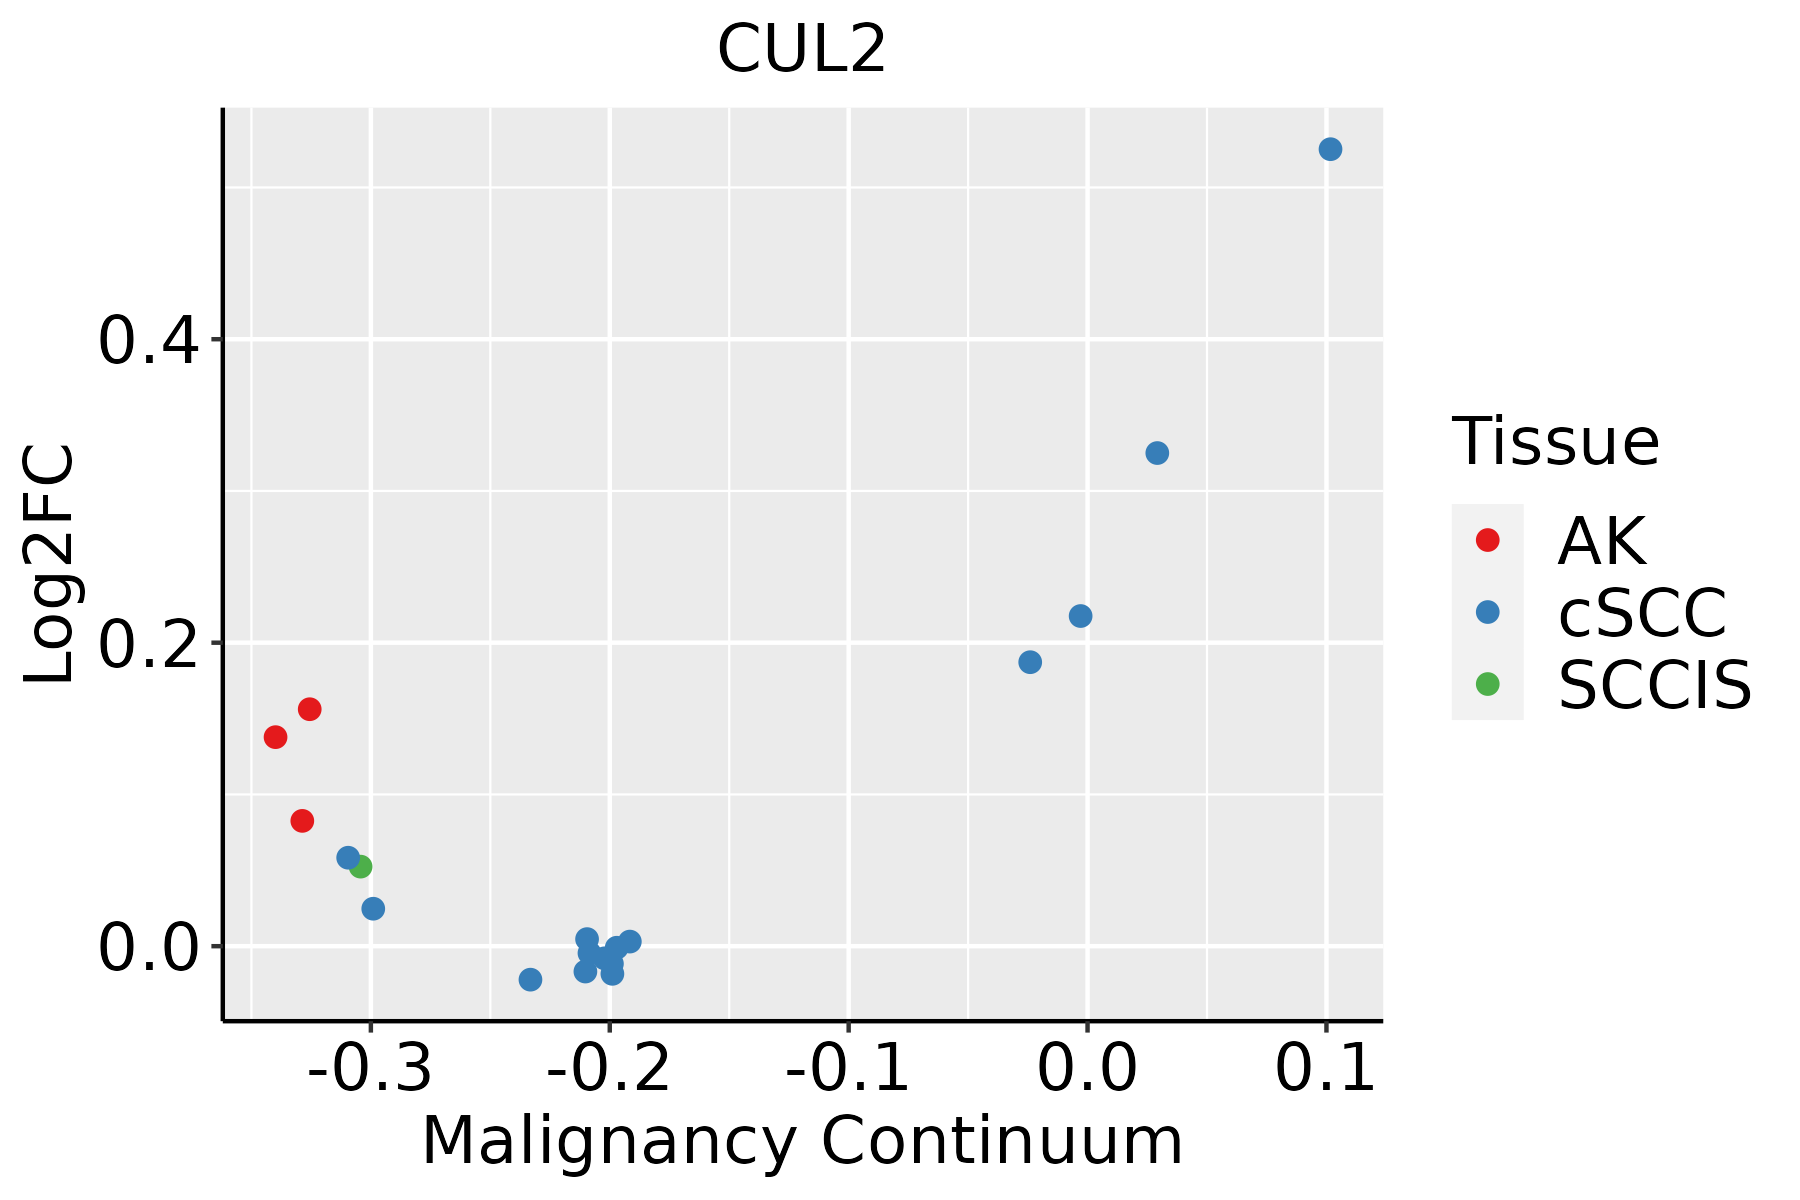 | AK: Actinic keratosis |
| cSCC: Cutaneous squamous cell carcinoma | ||
| SCCIS:squamous cell carcinoma in situ |
| ∗log2FC in expression of this searched gene in stem-like cells from each diseased tissue sample relative to stem-like cells in normal samples in each tissue plotted against the malignancy continuum. Samples are colored based on if they are from different disease stage. |
Top |
Malignant transformation related pathway analysis |
| Find out the enriched GO biological processes and KEGG pathways involved in transition from healthy to precancer to cancer |
| Tissue | Disease Stage | Enriched GO biological Processes |
| Colorectum | AD |  |
| Colorectum | SER |  |
| Colorectum | MSS |  |
| Colorectum | MSI-H |  |
| Colorectum | FAP |  |
| ∗Top 15 enriched GO BP terms are showed in the bar plot of each disease state in each tissue. Each row represents a significant GO biological process which is colored according to the -log10(p.adjust). |
| Page: 1 2 3 4 5 6 7 8 9 |
| GO ID | Tissue | Disease Stage | Description | Gene Ratio | Bg Ratio | pvalue | p.adjust | Count |
| GO:0010498111 | Esophagus | ESCC | proteasomal protein catabolic process | 369/8552 | 490/18723 | 1.13e-41 | 1.80e-38 | 369 |
| GO:0043161111 | Esophagus | ESCC | proteasome-mediated ubiquitin-dependent protein catabolic process | 312/8552 | 412/18723 | 3.53e-36 | 4.48e-33 | 312 |
| GO:0097193111 | Esophagus | ESCC | intrinsic apoptotic signaling pathway | 222/8552 | 288/18723 | 5.87e-28 | 2.02e-25 | 222 |
| GO:004477216 | Esophagus | ESCC | mitotic cell cycle phase transition | 281/8552 | 424/18723 | 4.63e-18 | 4.45e-16 | 281 |
| GO:000008214 | Esophagus | ESCC | G1/S transition of mitotic cell cycle | 134/8552 | 214/18723 | 4.04e-07 | 5.55e-06 | 134 |
| GO:004484314 | Esophagus | ESCC | cell cycle G1/S phase transition | 148/8552 | 241/18723 | 5.68e-07 | 7.48e-06 | 148 |
| GO:00311461 | Esophagus | ESCC | SCF-dependent proteasomal ubiquitin-dependent protein catabolic process | 33/8552 | 49/18723 | 1.80e-03 | 8.26e-03 | 33 |
| GO:001049822 | Liver | HCC | proteasomal protein catabolic process | 351/7958 | 490/18723 | 6.92e-40 | 1.46e-36 | 351 |
| GO:004316122 | Liver | HCC | proteasome-mediated ubiquitin-dependent protein catabolic process | 299/7958 | 412/18723 | 7.82e-36 | 8.27e-33 | 299 |
| GO:009719322 | Liver | HCC | intrinsic apoptotic signaling pathway | 184/7958 | 288/18723 | 1.50e-13 | 8.32e-12 | 184 |
| GO:00447722 | Liver | HCC | mitotic cell cycle phase transition | 240/7958 | 424/18723 | 2.47e-09 | 6.84e-08 | 240 |
| GO:00448432 | Liver | HCC | cell cycle G1/S phase transition | 134/7958 | 241/18723 | 2.60e-05 | 2.70e-04 | 134 |
| GO:00000822 | Liver | HCC | G1/S transition of mitotic cell cycle | 119/7958 | 214/18723 | 7.11e-05 | 6.39e-04 | 119 |
| GO:0031146 | Liver | HCC | SCF-dependent proteasomal ubiquitin-dependent protein catabolic process | 30/7958 | 49/18723 | 6.31e-03 | 2.57e-02 | 30 |
| GO:001049820 | Oral cavity | OSCC | proteasomal protein catabolic process | 336/7305 | 490/18723 | 5.45e-41 | 8.63e-38 | 336 |
| GO:004316120 | Oral cavity | OSCC | proteasome-mediated ubiquitin-dependent protein catabolic process | 285/7305 | 412/18723 | 5.68e-36 | 5.99e-33 | 285 |
| GO:009719320 | Oral cavity | OSCC | intrinsic apoptotic signaling pathway | 202/7305 | 288/18723 | 4.64e-27 | 1.73e-24 | 202 |
| GO:00447728 | Oral cavity | OSCC | mitotic cell cycle phase transition | 255/7305 | 424/18723 | 5.29e-19 | 6.98e-17 | 255 |
| GO:00000826 | Oral cavity | OSCC | G1/S transition of mitotic cell cycle | 120/7305 | 214/18723 | 2.86e-07 | 4.40e-06 | 120 |
| GO:00448436 | Oral cavity | OSCC | cell cycle G1/S phase transition | 131/7305 | 241/18723 | 8.77e-07 | 1.20e-05 | 131 |
| Page: 1 2 |
| Pathway ID | Tissue | Disease Stage | Description | Gene Ratio | Bg Ratio | pvalue | p.adjust | qvalue | Count |
| hsa0412027 | Esophagus | ESCC | Ubiquitin mediated proteolysis | 122/4205 | 142/8465 | 6.53e-20 | 7.29e-18 | 3.74e-18 | 122 |
| hsa0521118 | Esophagus | ESCC | Renal cell carcinoma | 51/4205 | 69/8465 | 3.29e-05 | 1.53e-04 | 7.83e-05 | 51 |
| hsa0406629 | Esophagus | ESCC | HIF-1 signaling pathway | 75/4205 | 109/8465 | 3.66e-05 | 1.68e-04 | 8.60e-05 | 75 |
| hsa0412036 | Esophagus | ESCC | Ubiquitin mediated proteolysis | 122/4205 | 142/8465 | 6.53e-20 | 7.29e-18 | 3.74e-18 | 122 |
| hsa0521119 | Esophagus | ESCC | Renal cell carcinoma | 51/4205 | 69/8465 | 3.29e-05 | 1.53e-04 | 7.83e-05 | 51 |
| hsa04066113 | Esophagus | ESCC | HIF-1 signaling pathway | 75/4205 | 109/8465 | 3.66e-05 | 1.68e-04 | 8.60e-05 | 75 |
| hsa0412041 | Liver | HCC | Ubiquitin mediated proteolysis | 110/4020 | 142/8465 | 1.67e-13 | 3.74e-12 | 2.08e-12 | 110 |
| hsa0521121 | Liver | HCC | Renal cell carcinoma | 51/4020 | 69/8465 | 6.76e-06 | 5.53e-05 | 3.07e-05 | 51 |
| hsa0406622 | Liver | HCC | HIF-1 signaling pathway | 70/4020 | 109/8465 | 2.96e-04 | 1.36e-03 | 7.57e-04 | 70 |
| hsa0412051 | Liver | HCC | Ubiquitin mediated proteolysis | 110/4020 | 142/8465 | 1.67e-13 | 3.74e-12 | 2.08e-12 | 110 |
| hsa0521131 | Liver | HCC | Renal cell carcinoma | 51/4020 | 69/8465 | 6.76e-06 | 5.53e-05 | 3.07e-05 | 51 |
| hsa0406632 | Liver | HCC | HIF-1 signaling pathway | 70/4020 | 109/8465 | 2.96e-04 | 1.36e-03 | 7.57e-04 | 70 |
| hsa0412020 | Oral cavity | OSCC | Ubiquitin mediated proteolysis | 105/3704 | 142/8465 | 1.83e-13 | 4.37e-12 | 2.23e-12 | 105 |
| hsa0521116 | Oral cavity | OSCC | Renal cell carcinoma | 51/3704 | 69/8465 | 3.30e-07 | 2.05e-06 | 1.04e-06 | 51 |
| hsa0406627 | Oral cavity | OSCC | HIF-1 signaling pathway | 68/3704 | 109/8465 | 6.30e-05 | 2.48e-04 | 1.26e-04 | 68 |
| hsa04120110 | Oral cavity | OSCC | Ubiquitin mediated proteolysis | 105/3704 | 142/8465 | 1.83e-13 | 4.37e-12 | 2.23e-12 | 105 |
| hsa0521117 | Oral cavity | OSCC | Renal cell carcinoma | 51/3704 | 69/8465 | 3.30e-07 | 2.05e-06 | 1.04e-06 | 51 |
| hsa04066112 | Oral cavity | OSCC | HIF-1 signaling pathway | 68/3704 | 109/8465 | 6.30e-05 | 2.48e-04 | 1.26e-04 | 68 |
| hsa0412025 | Oral cavity | LP | Ubiquitin mediated proteolysis | 66/2418 | 142/8465 | 3.74e-06 | 3.46e-05 | 2.23e-05 | 66 |
| hsa0521125 | Oral cavity | LP | Renal cell carcinoma | 30/2418 | 69/8465 | 5.60e-03 | 2.25e-02 | 1.45e-02 | 30 |
| Page: 1 2 |
Top |
Cell-cell communication analysis |
| Identification of potential cell-cell interactions between two cell types and their ligand-receptor pairs for different disease states |
| Ligand | Receptor | LRpair | Pathway | Tissue | Disease Stage |
| Page: 1 |
Top |
Single-cell gene regulatory network inference analysis |
| Find out the significant the regulons (TFs) and the target genes of each regulon across cell types for different disease states |
| TF | Cell Type | Tissue | Disease Stage | Target Gene | RSS | Regulon Activity |
| ∗The dot plots of a searched regulon are shown for all cell subpopulations in each disease state of each tissue based on the regulon specific score inferred using pySCENIC and by calculating the average expression. |
| Page: 1 |
Top |
Somatic mutation of malignant transformation related genes |
| Annotation of somatic variants for genes involved in malignant transformation |
| Hugo Symbol | Variant Class | Variant Classification | dbSNP RS | HGVSc | HGVSp | HGVSp Short | SWISSPROT | BIOTYPE | SIFT | PolyPhen | Tumor Sample Barcode | Tissue | Histology | Sex | Age | Stage | Therapy Types | Drugs | Outcome |
| CUL2 | SNV | Missense_Mutation | c.1547N>G | p.Gln516Arg | p.Q516R | Q13617 | protein_coding | tolerated(0.45) | benign(0.01) | TCGA-A8-A09M-01 | Breast | breast invasive carcinoma | Female | >=65 | III/IV | Chemotherapy | paclitaxel | CR | |
| CUL2 | SNV | Missense_Mutation | novel | c.917N>A | p.Arg306Gln | p.R306Q | Q13617 | protein_coding | tolerated(0.39) | benign(0.007) | TCGA-AC-A23C-01 | Breast | breast invasive carcinoma | Female | <65 | I/II | Chemotherapy | chemo | CR |
| CUL2 | SNV | Missense_Mutation | c.1457A>T | p.Tyr486Phe | p.Y486F | Q13617 | protein_coding | tolerated(0.06) | benign(0.389) | TCGA-D8-A1XK-01 | Breast | breast invasive carcinoma | Female | <65 | I/II | Chemotherapy | doxorubicine+cyclophosphamide | SD | |
| CUL2 | SNV | Missense_Mutation | novel | c.1714C>A | p.Leu572Ile | p.L572I | Q13617 | protein_coding | deleterious(0.03) | probably_damaging(0.919) | TCGA-OL-A5D8-01 | Breast | breast invasive carcinoma | Female | <65 | I/II | Unknown | Unknown | SD |
| CUL2 | insertion | In_Frame_Ins | novel | c.2101_2102insAATTTAATA | p.Ala701delinsGluPheAsnThr | p.A701delinsEFNT | Q13617 | protein_coding | TCGA-A7-A26I-01 | Breast | breast invasive carcinoma | Female | >=65 | I/II | Chemotherapy | cytoxan | SD | ||
| CUL2 | insertion | In_Frame_Ins | novel | c.2100_2101insTCT | p.Gln700_Ala701insSer | p.Q700_A701insS | Q13617 | protein_coding | TCGA-A7-A26I-01 | Breast | breast invasive carcinoma | Female | >=65 | I/II | Chemotherapy | cytoxan | SD | ||
| CUL2 | insertion | Frame_Shift_Ins | novel | c.2106_2107insTTTTGTT | p.Ile703PhefsTer24 | p.I703Ffs*24 | Q13617 | protein_coding | TCGA-A8-A08T-01 | Breast | breast invasive carcinoma | Female | <65 | III/IV | Unknown | Unknown | PD | ||
| CUL2 | insertion | Nonsense_Mutation | novel | c.2104_2105insGGCACAGTGGCTCATGCCTGTAATC | p.Ala702GlyfsTer8 | p.A702Gfs*8 | Q13617 | protein_coding | TCGA-A8-A08T-01 | Breast | breast invasive carcinoma | Female | <65 | III/IV | Unknown | Unknown | PD | ||
| CUL2 | deletion | Frame_Shift_Del | novel | c.1104delA | p.Lys368AsnfsTer10 | p.K368Nfs*10 | Q13617 | protein_coding | TCGA-EW-A2FV-01 | Breast | breast invasive carcinoma | Female | <65 | III/IV | Chemotherapy | docetaxel | SD | ||
| CUL2 | SNV | Missense_Mutation | c.2083C>T | p.Arg695Trp | p.R695W | Q13617 | protein_coding | deleterious(0) | probably_damaging(1) | TCGA-2W-A8YY-01 | Cervix | cervical & endocervical cancer | Female | <65 | I/II | Chemotherapy | cisplatin | CR |
| Page: 1 2 3 4 5 6 7 8 |
Top |
Related drugs of malignant transformation related genes |
| Identification of chemicals and drugs interact with genes involved in malignant transfromation |
| (DGIdb 4.0) |
| Entrez ID | Symbol | Category | Interaction Types | Drug Claim Name | Drug Name | PMIDs |
| Page: 1 |

Copyright 2023-Present -The University of Texas Health Science Center at Houston |