
|
|||||
|
 | |
| |
| |
| |
| |
| |
|
Gene: CUEDC2 |
Gene summary for CUEDC2 |
| Gene information | Species | Human | Gene symbol | CUEDC2 | Gene ID | 79004 |
| Gene name | CUE domain containing 2 | |
| Gene Alias | C10orf66 | |
| Cytomap | 10q24.32 | |
| Gene Type | protein-coding | GO ID | GO:0001816 | UniProtAcc | Q9H467 |
Top |
Malignant transformation analysis |
| Identification of the aberrant gene expression in precancerous and cancerous lesions by comparing the gene expression of stem-like cells in diseased tissues with normal stem cells |
| Entrez ID | Symbol | Replicates | Species | Organ | Tissue | Adj P-value | Log2FC | Malignancy |
| 79004 | CUEDC2 | LZE3D | Human | Esophagus | HGIN | 1.62e-03 | 4.39e-01 | 0.0668 |
| 79004 | CUEDC2 | LZE4T | Human | Esophagus | ESCC | 7.73e-12 | 2.95e-01 | 0.0811 |
| 79004 | CUEDC2 | LZE7T | Human | Esophagus | ESCC | 2.19e-04 | 5.27e-01 | 0.0667 |
| 79004 | CUEDC2 | LZE8T | Human | Esophagus | ESCC | 1.72e-11 | 3.34e-01 | 0.067 |
| 79004 | CUEDC2 | LZE24T | Human | Esophagus | ESCC | 4.88e-23 | 8.46e-01 | 0.0596 |
| 79004 | CUEDC2 | LZE21T | Human | Esophagus | ESCC | 1.19e-02 | 2.20e-01 | 0.0655 |
| 79004 | CUEDC2 | LZE6T | Human | Esophagus | ESCC | 6.03e-11 | 6.27e-01 | 0.0845 |
| 79004 | CUEDC2 | P1T-E | Human | Esophagus | ESCC | 1.48e-10 | 7.28e-01 | 0.0875 |
| 79004 | CUEDC2 | P2T-E | Human | Esophagus | ESCC | 1.40e-67 | 1.27e+00 | 0.1177 |
| 79004 | CUEDC2 | P4T-E | Human | Esophagus | ESCC | 3.11e-36 | 9.27e-01 | 0.1323 |
| 79004 | CUEDC2 | P5T-E | Human | Esophagus | ESCC | 2.82e-48 | 9.66e-01 | 0.1327 |
| 79004 | CUEDC2 | P8T-E | Human | Esophagus | ESCC | 3.30e-33 | 7.26e-01 | 0.0889 |
| 79004 | CUEDC2 | P9T-E | Human | Esophagus | ESCC | 5.15e-17 | 4.36e-01 | 0.1131 |
| 79004 | CUEDC2 | P10T-E | Human | Esophagus | ESCC | 2.34e-27 | 4.51e-01 | 0.116 |
| 79004 | CUEDC2 | P11T-E | Human | Esophagus | ESCC | 4.69e-18 | 6.51e-01 | 0.1426 |
| 79004 | CUEDC2 | P12T-E | Human | Esophagus | ESCC | 6.95e-54 | 1.01e+00 | 0.1122 |
| 79004 | CUEDC2 | P15T-E | Human | Esophagus | ESCC | 2.23e-21 | 6.02e-01 | 0.1149 |
| 79004 | CUEDC2 | P16T-E | Human | Esophagus | ESCC | 8.08e-41 | 8.54e-01 | 0.1153 |
| 79004 | CUEDC2 | P17T-E | Human | Esophagus | ESCC | 2.73e-05 | 4.87e-01 | 0.1278 |
| 79004 | CUEDC2 | P19T-E | Human | Esophagus | ESCC | 4.47e-12 | 9.66e-01 | 0.1662 |
| Page: 1 2 3 4 5 6 7 |
| Tissue | Expression Dynamics | Abbreviation |
| Esophagus |  | ESCC: Esophageal squamous cell carcinoma |
| HGIN: High-grade intraepithelial neoplasias | ||
| LGIN: Low-grade intraepithelial neoplasias | ||
| Liver | 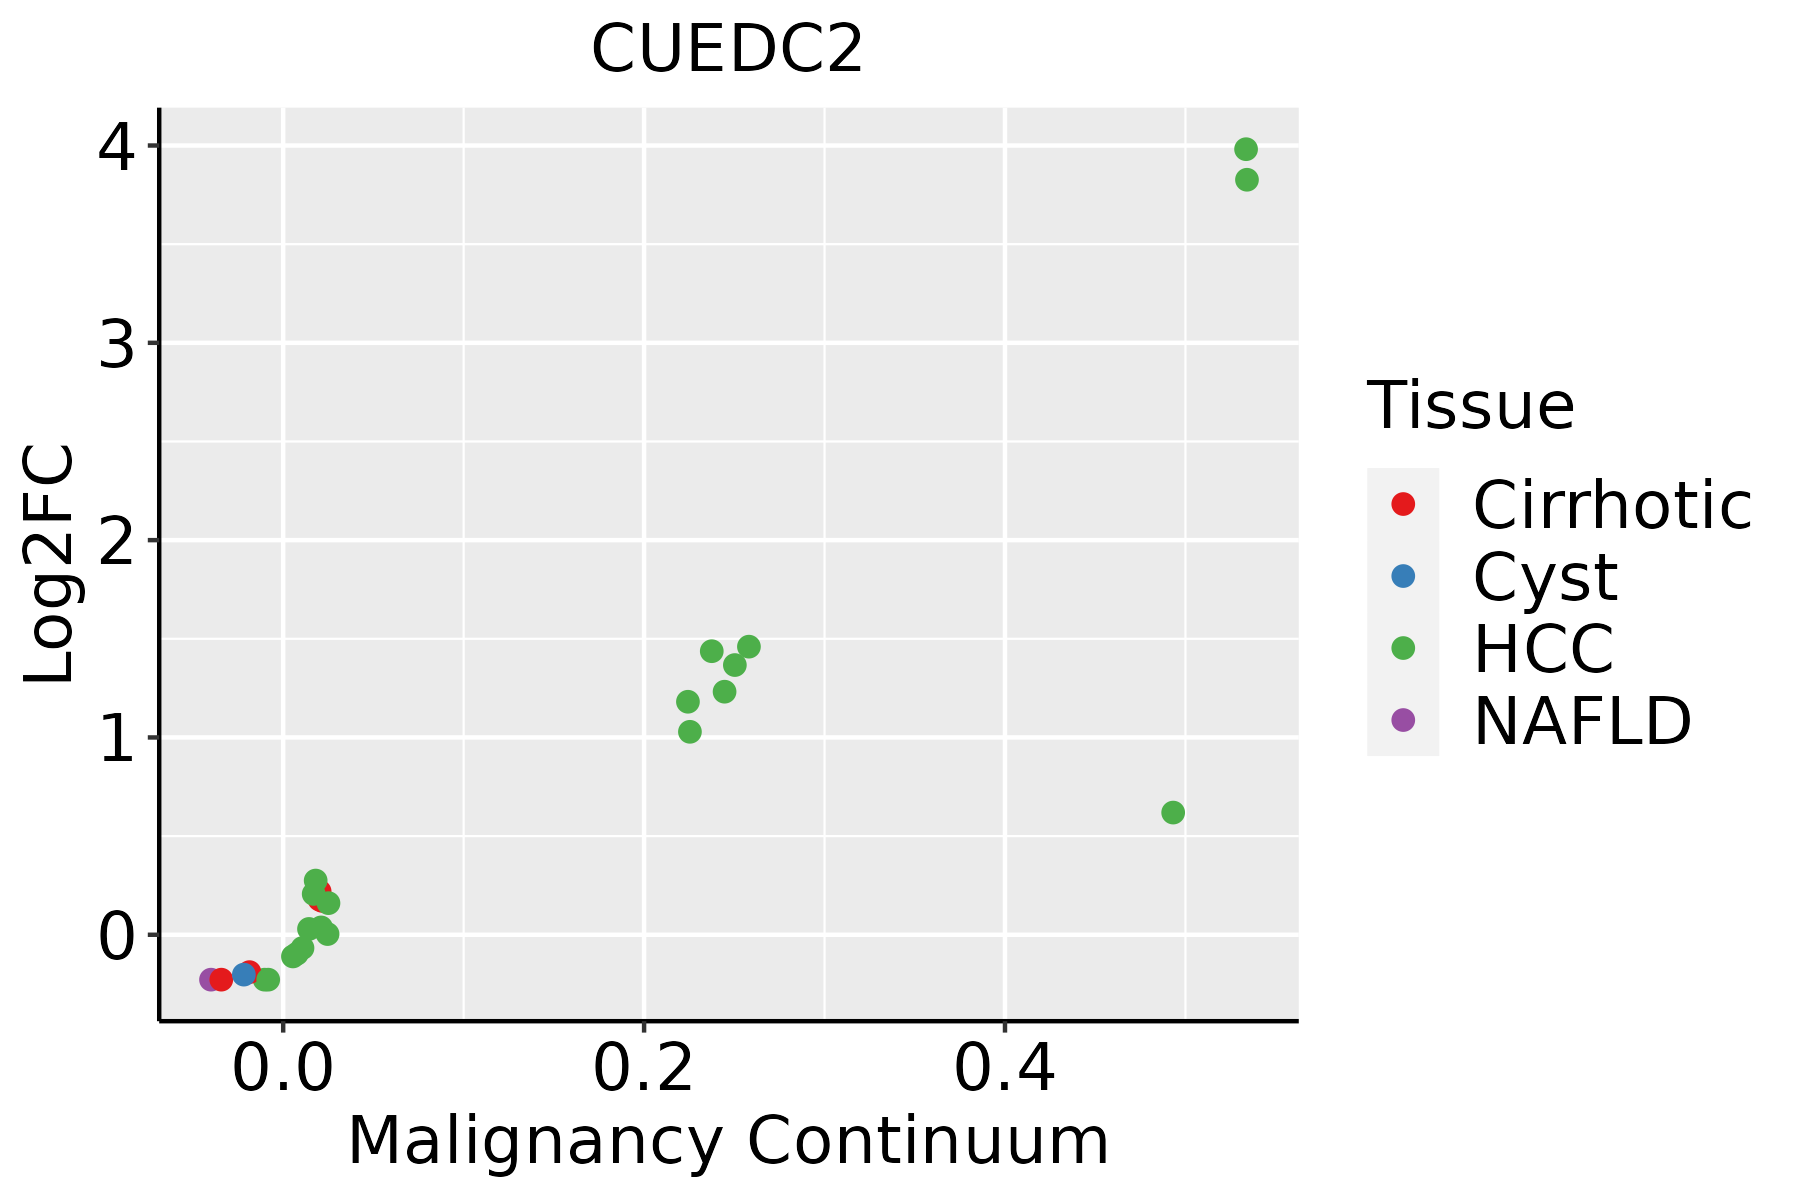 | HCC: Hepatocellular carcinoma |
| NAFLD: Non-alcoholic fatty liver disease | ||
| Oral Cavity | 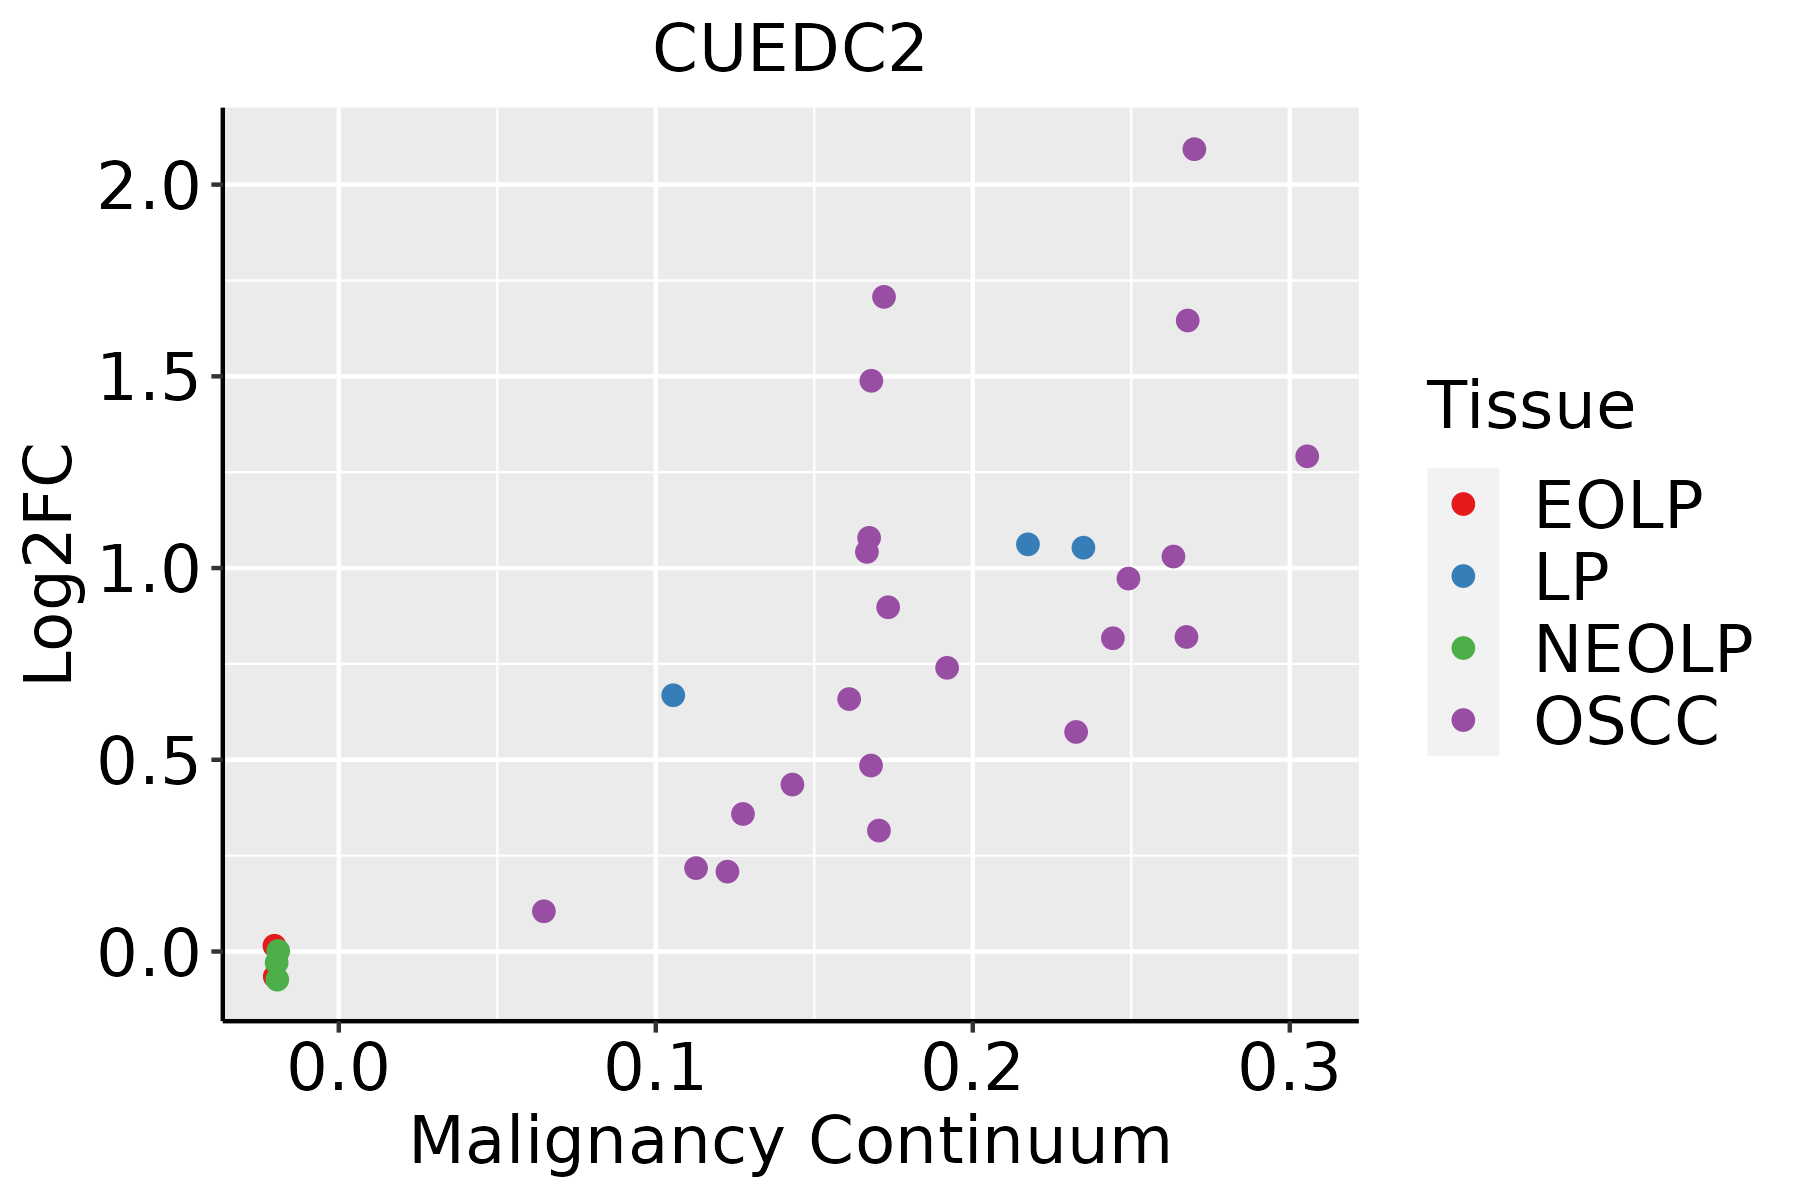 | EOLP: Erosive Oral lichen planus |
| LP: leukoplakia | ||
| NEOLP: Non-erosive oral lichen planus | ||
| OSCC: Oral squamous cell carcinoma | ||
| Prostate | 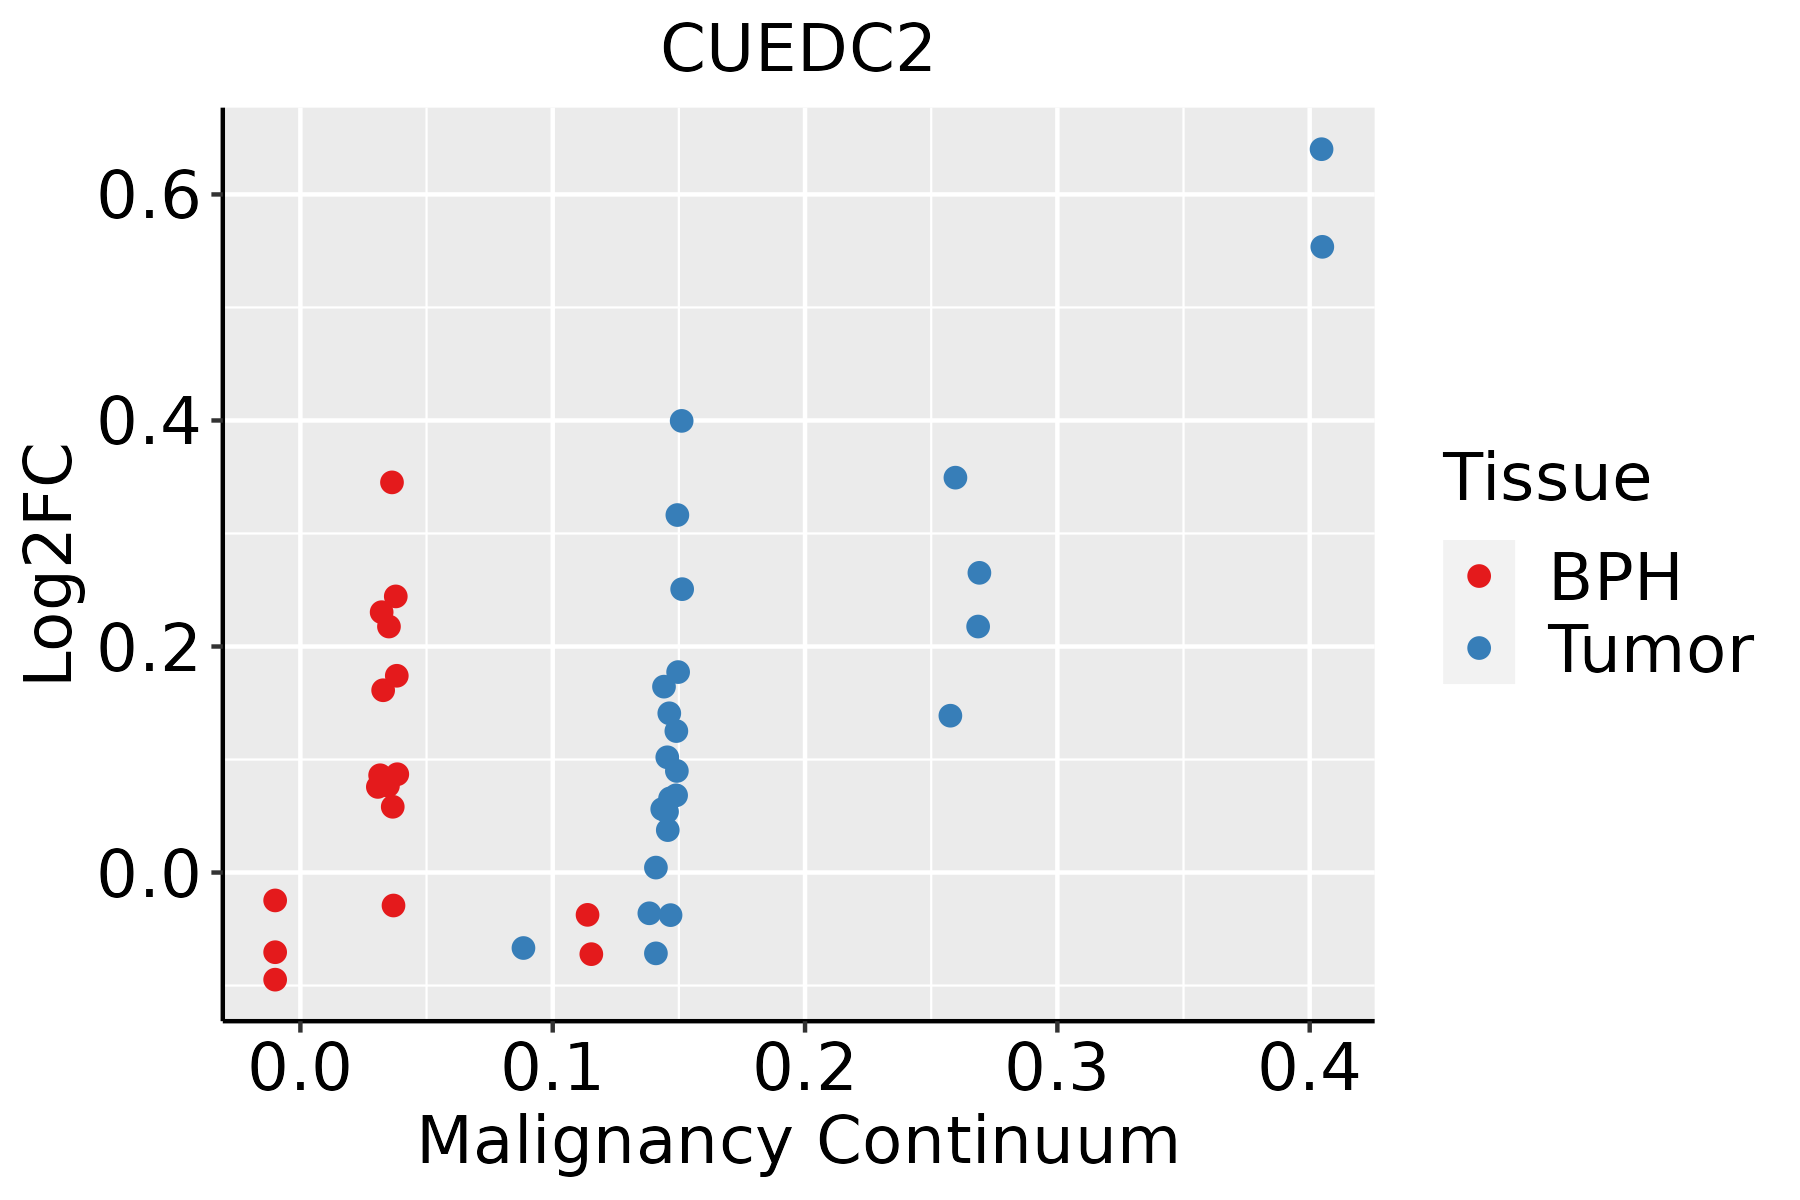 | BPH: Benign Prostatic Hyperplasia |
| Skin |  | AK: Actinic keratosis |
| cSCC: Cutaneous squamous cell carcinoma | ||
| SCCIS:squamous cell carcinoma in situ | ||
| Thyroid | 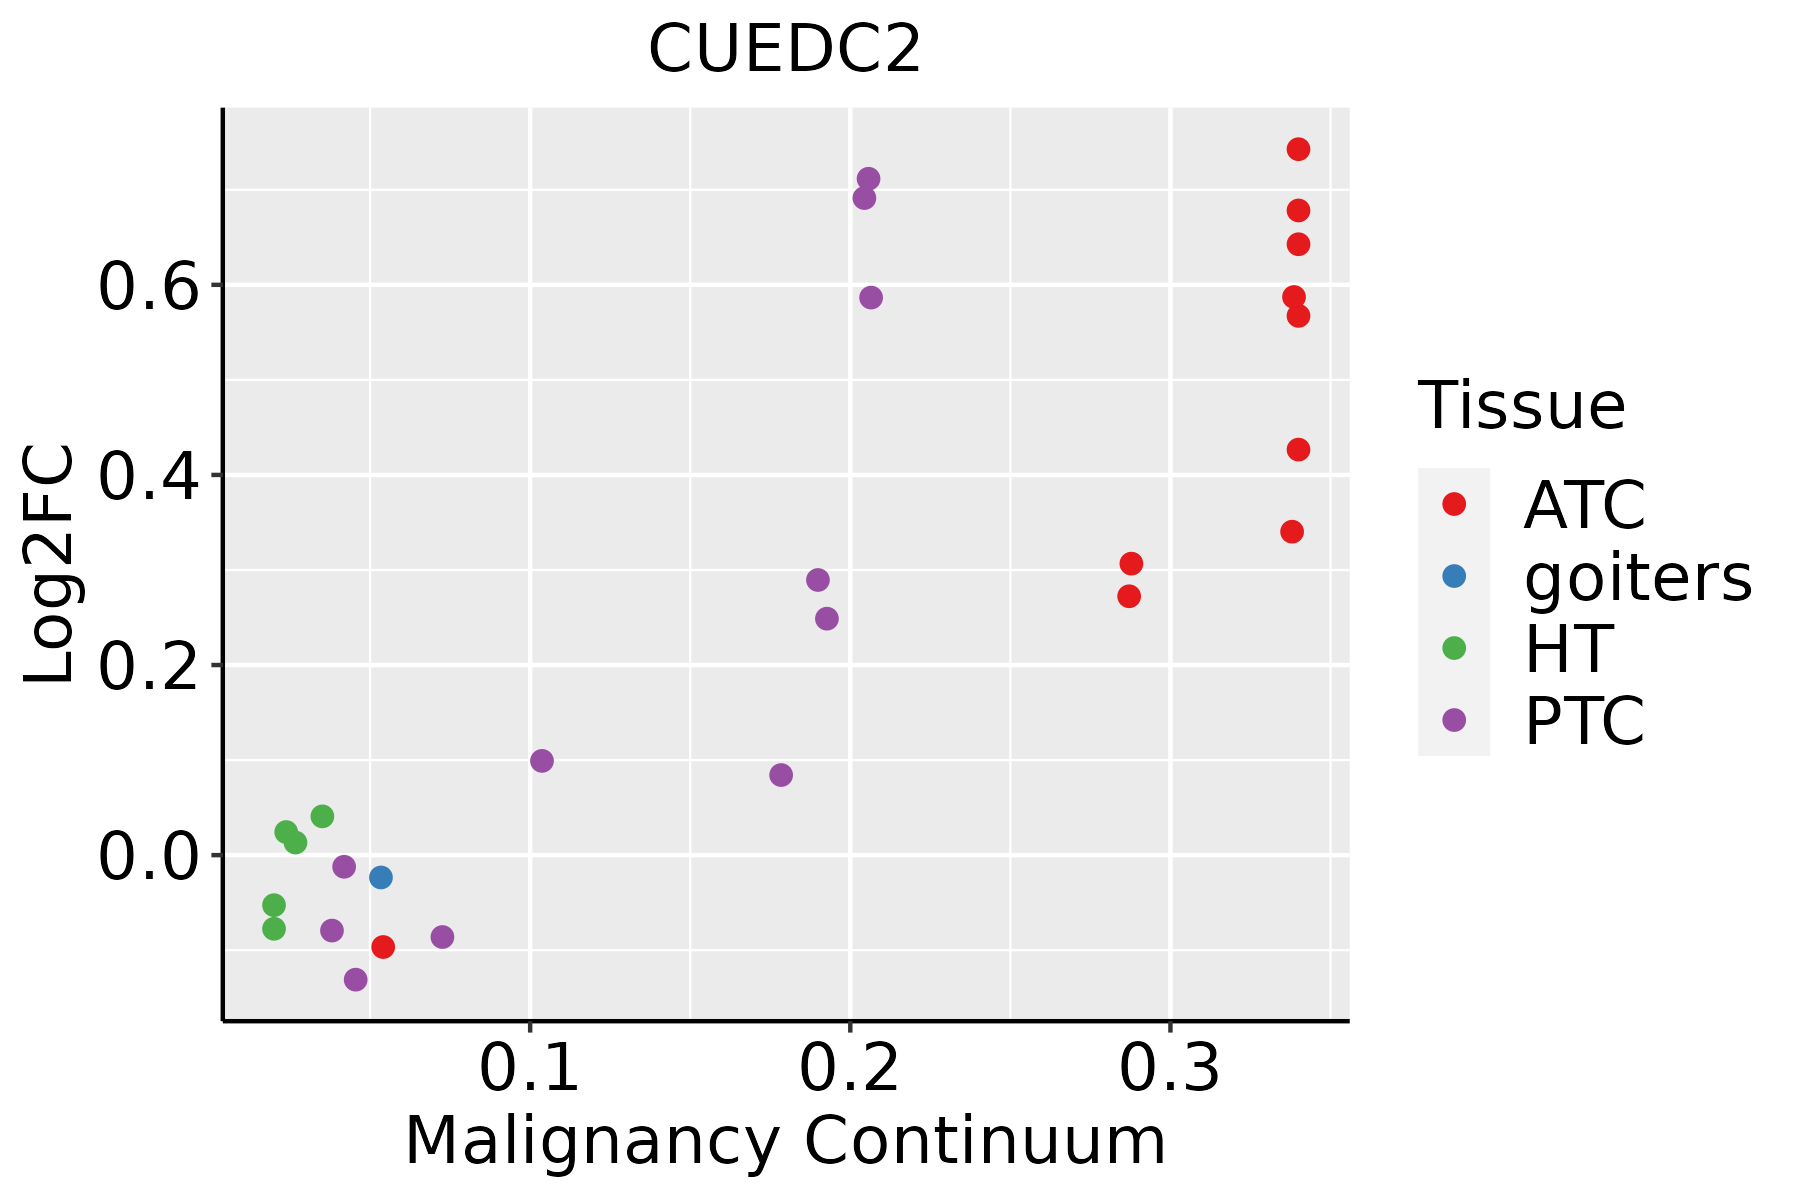 | ATC: Anaplastic thyroid cancer |
| HT: Hashimoto's thyroiditis | ||
| PTC: Papillary thyroid cancer |
| ∗log2FC in expression of this searched gene in stem-like cells from each diseased tissue sample relative to stem-like cells in normal samples in each tissue plotted against the malignancy continuum. Samples are colored based on if they are from different disease stage. |
Top |
Malignant transformation related pathway analysis |
| Find out the enriched GO biological processes and KEGG pathways involved in transition from healthy to precancer to cancer |
| Tissue | Disease Stage | Enriched GO biological Processes |
| Colorectum | AD |  |
| Colorectum | SER |  |
| Colorectum | MSS |  |
| Colorectum | MSI-H |  |
| Colorectum | FAP |  |
| ∗Top 15 enriched GO BP terms are showed in the bar plot of each disease state in each tissue. Each row represents a significant GO biological process which is colored according to the -log10(p.adjust). |
| Page: 1 2 3 4 5 6 7 8 9 |
| GO ID | Tissue | Disease Stage | Description | Gene Ratio | Bg Ratio | pvalue | p.adjust | Count |
| GO:000268316 | Esophagus | ESCC | negative regulation of immune system process | 231/8552 | 434/18723 | 8.48e-04 | 4.36e-03 | 231 |
| GO:000268310 | Oral cavity | OSCC | negative regulation of immune system process | 204/7305 | 434/18723 | 3.72e-04 | 2.27e-03 | 204 |
| GO:000268315 | Oral cavity | LP | negative regulation of immune system process | 130/4623 | 434/18723 | 6.70e-03 | 3.90e-02 | 130 |
| GO:00026839 | Prostate | BPH | negative regulation of immune system process | 100/3107 | 434/18723 | 2.83e-04 | 2.20e-03 | 100 |
| GO:000268314 | Prostate | Tumor | negative regulation of immune system process | 101/3246 | 434/18723 | 8.70e-04 | 5.85e-03 | 101 |
| GO:0061082 | Thyroid | ATC | myeloid leukocyte cytokine production | 18/6293 | 28/18723 | 8.70e-04 | 4.72e-03 | 18 |
| GO:0010934 | Thyroid | ATC | macrophage cytokine production | 12/6293 | 17/18723 | 2.02e-03 | 9.60e-03 | 12 |
| GO:0010935 | Thyroid | ATC | regulation of macrophage cytokine production | 12/6293 | 17/18723 | 2.02e-03 | 9.60e-03 | 12 |
| Page: 1 |
| Pathway ID | Tissue | Disease Stage | Description | Gene Ratio | Bg Ratio | pvalue | p.adjust | qvalue | Count |
| Page: 1 |
Top |
Cell-cell communication analysis |
| Identification of potential cell-cell interactions between two cell types and their ligand-receptor pairs for different disease states |
| Ligand | Receptor | LRpair | Pathway | Tissue | Disease Stage |
| Page: 1 |
Top |
Single-cell gene regulatory network inference analysis |
| Find out the significant the regulons (TFs) and the target genes of each regulon across cell types for different disease states |
| TF | Cell Type | Tissue | Disease Stage | Target Gene | RSS | Regulon Activity |
| ∗The dot plots of a searched regulon are shown for all cell subpopulations in each disease state of each tissue based on the regulon specific score inferred using pySCENIC and by calculating the average expression. |
| Page: 1 |
Top |
Somatic mutation of malignant transformation related genes |
| Annotation of somatic variants for genes involved in malignant transformation |
| Hugo Symbol | Variant Class | Variant Classification | dbSNP RS | HGVSc | HGVSp | HGVSp Short | SWISSPROT | BIOTYPE | SIFT | PolyPhen | Tumor Sample Barcode | Tissue | Histology | Sex | Age | Stage | Therapy Types | Drugs | Outcome |
| CUEDC2 | insertion | Nonsense_Mutation | novel | c.246_247insTAAATAATTCGTTTAAAATCATAAAAC | p.Lys82_Leu83insTer | p.K82_L83ins* | Q9H467 | protein_coding | TCGA-A8-A06Q-01 | Breast | breast invasive carcinoma | Female | <65 | III/IV | Unknown | Unknown | SD | ||
| CUEDC2 | deletion | Frame_Shift_Del | novel | c.355delA | p.Met119CysfsTer65 | p.M119Cfs*65 | Q9H467 | protein_coding | TCGA-EW-A2FV-01 | Breast | breast invasive carcinoma | Female | <65 | III/IV | Chemotherapy | docetaxel | SD | ||
| CUEDC2 | SNV | Missense_Mutation | c.755N>C | p.Val252Ala | p.V252A | Q9H467 | protein_coding | deleterious(0) | benign(0.283) | TCGA-AA-A01R-01 | Colorectum | colon adenocarcinoma | Male | <65 | III/IV | Chemotherapy | 5-fluorouracil | PD | |
| CUEDC2 | SNV | Missense_Mutation | c.818N>T | p.Ala273Val | p.A273V | Q9H467 | protein_coding | deleterious(0.02) | benign(0.236) | TCGA-AM-5821-01 | Colorectum | colon adenocarcinoma | Female | >=65 | I/II | Unknown | Unknown | SD | |
| CUEDC2 | SNV | Missense_Mutation | rs767718515 | c.157N>A | p.Asp53Asn | p.D53N | Q9H467 | protein_coding | deleterious(0) | probably_damaging(0.967) | TCGA-AZ-6601-01 | Colorectum | colon adenocarcinoma | Male | >=65 | I/II | Unknown | Unknown | PD |
| CUEDC2 | SNV | Missense_Mutation | c.818N>G | p.Ala273Gly | p.A273G | Q9H467 | protein_coding | deleterious(0.03) | benign(0.095) | TCGA-CK-4951-01 | Colorectum | colon adenocarcinoma | Female | >=65 | I/II | Unknown | Unknown | PD | |
| CUEDC2 | SNV | Missense_Mutation | rs778175495 | c.745N>A | p.Asp249Asn | p.D249N | Q9H467 | protein_coding | tolerated(0.28) | possibly_damaging(0.694) | TCGA-EI-6917-01 | Colorectum | rectum adenocarcinoma | Male | <65 | III/IV | Chemotherapy | 5fluorouracil+oxaciplatina+l-folinian | SD |
| CUEDC2 | SNV | Missense_Mutation | rs773939359 | c.352N>A | p.Glu118Lys | p.E118K | Q9H467 | protein_coding | tolerated(0.13) | benign(0.028) | TCGA-EI-6917-01 | Colorectum | rectum adenocarcinoma | Male | <65 | III/IV | Chemotherapy | 5fluorouracil+oxaciplatina+l-folinian | SD |
| CUEDC2 | SNV | Missense_Mutation | novel | c.802N>A | p.Ala268Thr | p.A268T | Q9H467 | protein_coding | tolerated(0.85) | benign(0) | TCGA-A5-A0G2-01 | Endometrium | uterine corpus endometrioid carcinoma | Female | <65 | III/IV | Unknown | Unknown | SD |
| CUEDC2 | SNV | Missense_Mutation | novel | c.233N>G | p.Asp78Gly | p.D78G | Q9H467 | protein_coding | deleterious(0) | possibly_damaging(0.703) | TCGA-A5-A0G2-01 | Endometrium | uterine corpus endometrioid carcinoma | Female | <65 | III/IV | Unknown | Unknown | SD |
| Page: 1 2 3 |
Top |
Related drugs of malignant transformation related genes |
| Identification of chemicals and drugs interact with genes involved in malignant transfromation |
| (DGIdb 4.0) |
| Entrez ID | Symbol | Category | Interaction Types | Drug Claim Name | Drug Name | PMIDs |
| Page: 1 |

Copyright 2023-Present -The University of Texas Health Science Center at Houston |