
|
|||||
|
 | |
| |
| |
| |
| |
| |
|
Gene: CUEDC1 |
Gene summary for CUEDC1 |
| Gene information | Species | Human | Gene symbol | CUEDC1 | Gene ID | 404093 |
| Gene name | CUE domain containing 1 | |
| Gene Alias | CUEDC1 | |
| Cytomap | 17q22 | |
| Gene Type | protein-coding | GO ID | GO:0003674 | UniProtAcc | Q9NWM3 |
Top |
Malignant transformation analysis |
| Identification of the aberrant gene expression in precancerous and cancerous lesions by comparing the gene expression of stem-like cells in diseased tissues with normal stem cells |
| Entrez ID | Symbol | Replicates | Species | Organ | Tissue | Adj P-value | Log2FC | Malignancy |
| 404093 | CUEDC1 | LZE24T | Human | Esophagus | ESCC | 3.51e-04 | 1.64e-01 | 0.0596 |
| 404093 | CUEDC1 | P1T-E | Human | Esophagus | ESCC | 1.22e-06 | 4.20e-01 | 0.0875 |
| 404093 | CUEDC1 | P2T-E | Human | Esophagus | ESCC | 5.67e-20 | 3.34e-01 | 0.1177 |
| 404093 | CUEDC1 | P4T-E | Human | Esophagus | ESCC | 2.63e-05 | 1.49e-01 | 0.1323 |
| 404093 | CUEDC1 | P8T-E | Human | Esophagus | ESCC | 3.46e-18 | 3.49e-01 | 0.0889 |
| 404093 | CUEDC1 | P10T-E | Human | Esophagus | ESCC | 2.97e-05 | 1.09e-01 | 0.116 |
| 404093 | CUEDC1 | P11T-E | Human | Esophagus | ESCC | 4.37e-04 | 1.80e-01 | 0.1426 |
| 404093 | CUEDC1 | P12T-E | Human | Esophagus | ESCC | 1.85e-08 | 1.04e-01 | 0.1122 |
| 404093 | CUEDC1 | P15T-E | Human | Esophagus | ESCC | 2.14e-10 | 2.35e-01 | 0.1149 |
| 404093 | CUEDC1 | P20T-E | Human | Esophagus | ESCC | 3.52e-09 | 2.34e-01 | 0.1124 |
| 404093 | CUEDC1 | P21T-E | Human | Esophagus | ESCC | 8.32e-10 | 1.74e-01 | 0.1617 |
| 404093 | CUEDC1 | P22T-E | Human | Esophagus | ESCC | 5.43e-05 | 9.57e-02 | 0.1236 |
| 404093 | CUEDC1 | P23T-E | Human | Esophagus | ESCC | 5.56e-27 | 6.14e-01 | 0.108 |
| 404093 | CUEDC1 | P26T-E | Human | Esophagus | ESCC | 2.27e-07 | 1.84e-01 | 0.1276 |
| 404093 | CUEDC1 | P27T-E | Human | Esophagus | ESCC | 5.91e-07 | 1.36e-01 | 0.1055 |
| 404093 | CUEDC1 | P28T-E | Human | Esophagus | ESCC | 5.29e-04 | 1.24e-01 | 0.1149 |
| 404093 | CUEDC1 | P30T-E | Human | Esophagus | ESCC | 5.89e-06 | 1.61e-01 | 0.137 |
| 404093 | CUEDC1 | P32T-E | Human | Esophagus | ESCC | 4.28e-08 | 2.30e-01 | 0.1666 |
| 404093 | CUEDC1 | P36T-E | Human | Esophagus | ESCC | 8.01e-07 | 1.41e-01 | 0.1187 |
| 404093 | CUEDC1 | P37T-E | Human | Esophagus | ESCC | 1.54e-05 | 6.45e-02 | 0.1371 |
| Page: 1 2 3 4 |
| Tissue | Expression Dynamics | Abbreviation |
| Esophagus | 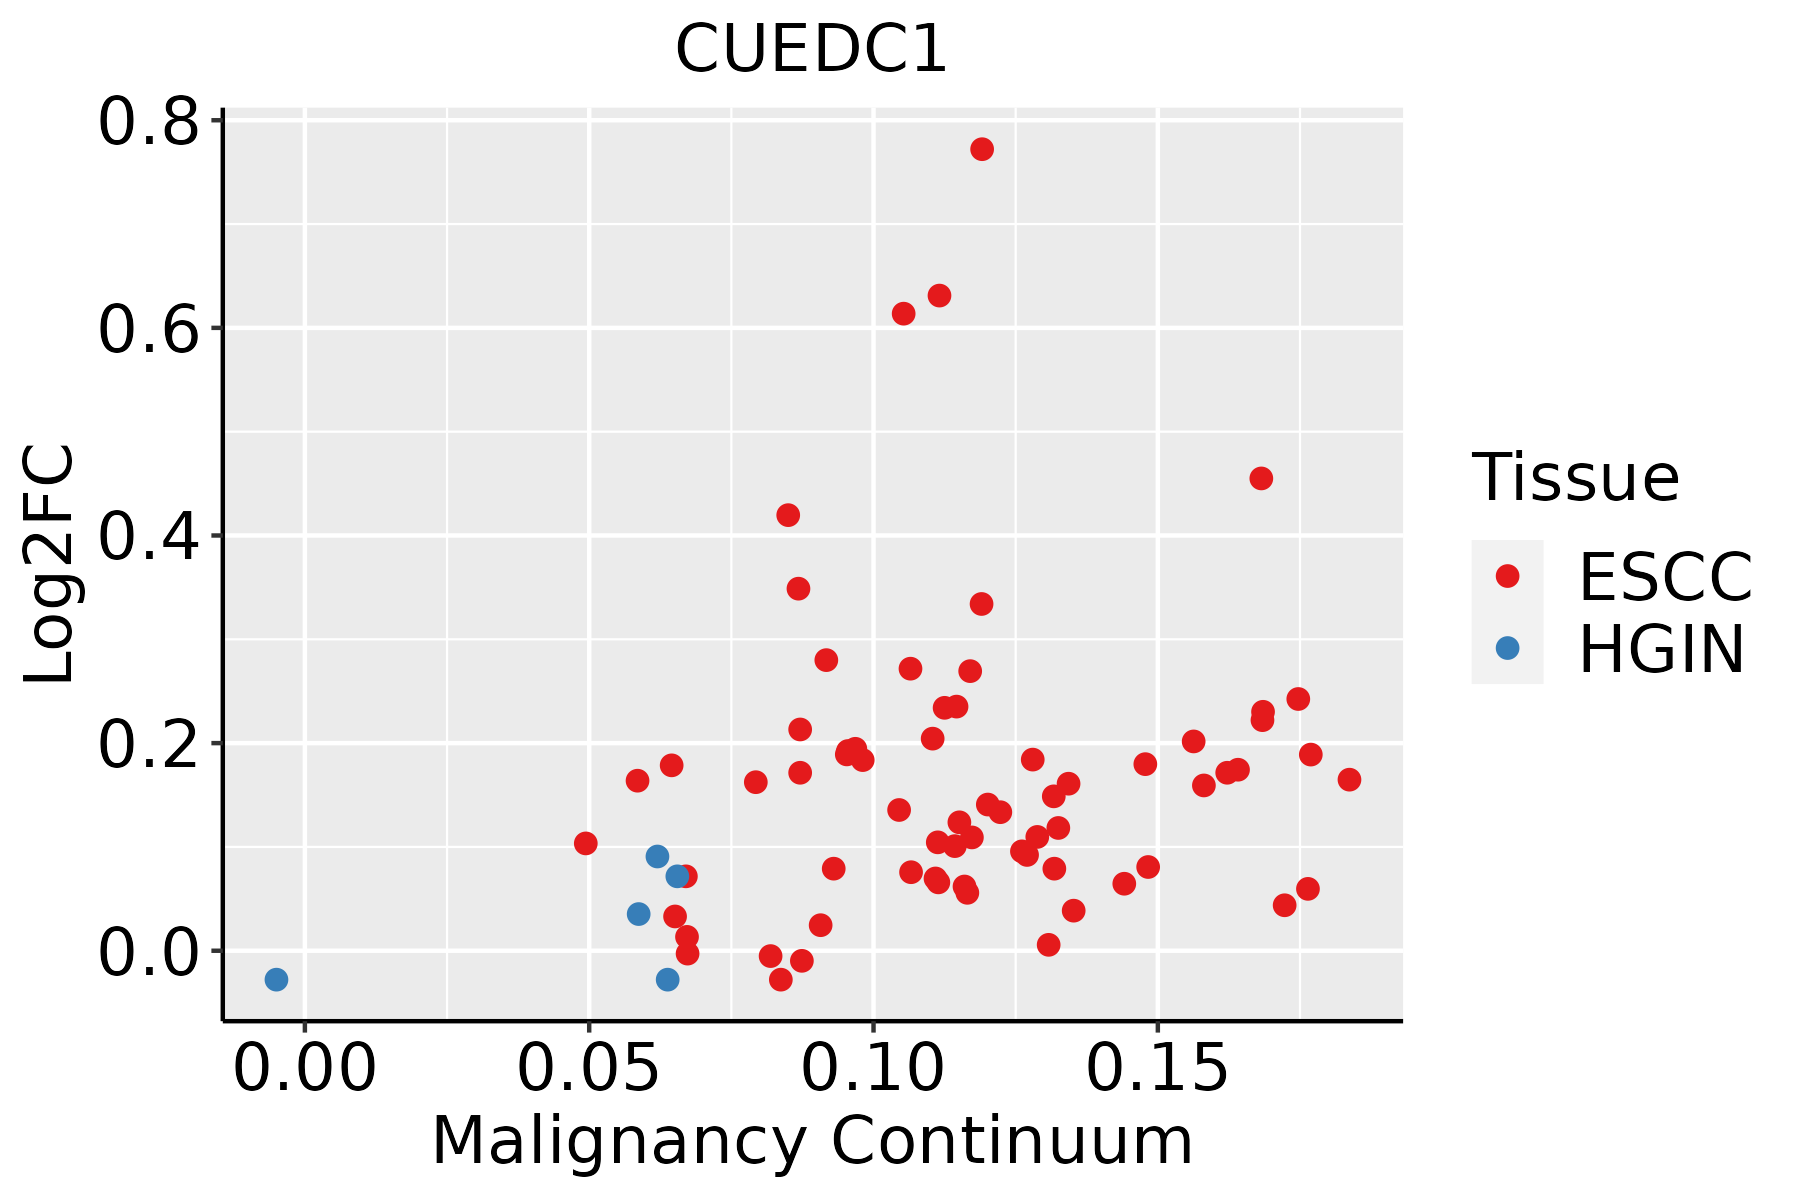 | ESCC: Esophageal squamous cell carcinoma |
| HGIN: High-grade intraepithelial neoplasias | ||
| LGIN: Low-grade intraepithelial neoplasias | ||
| Liver | 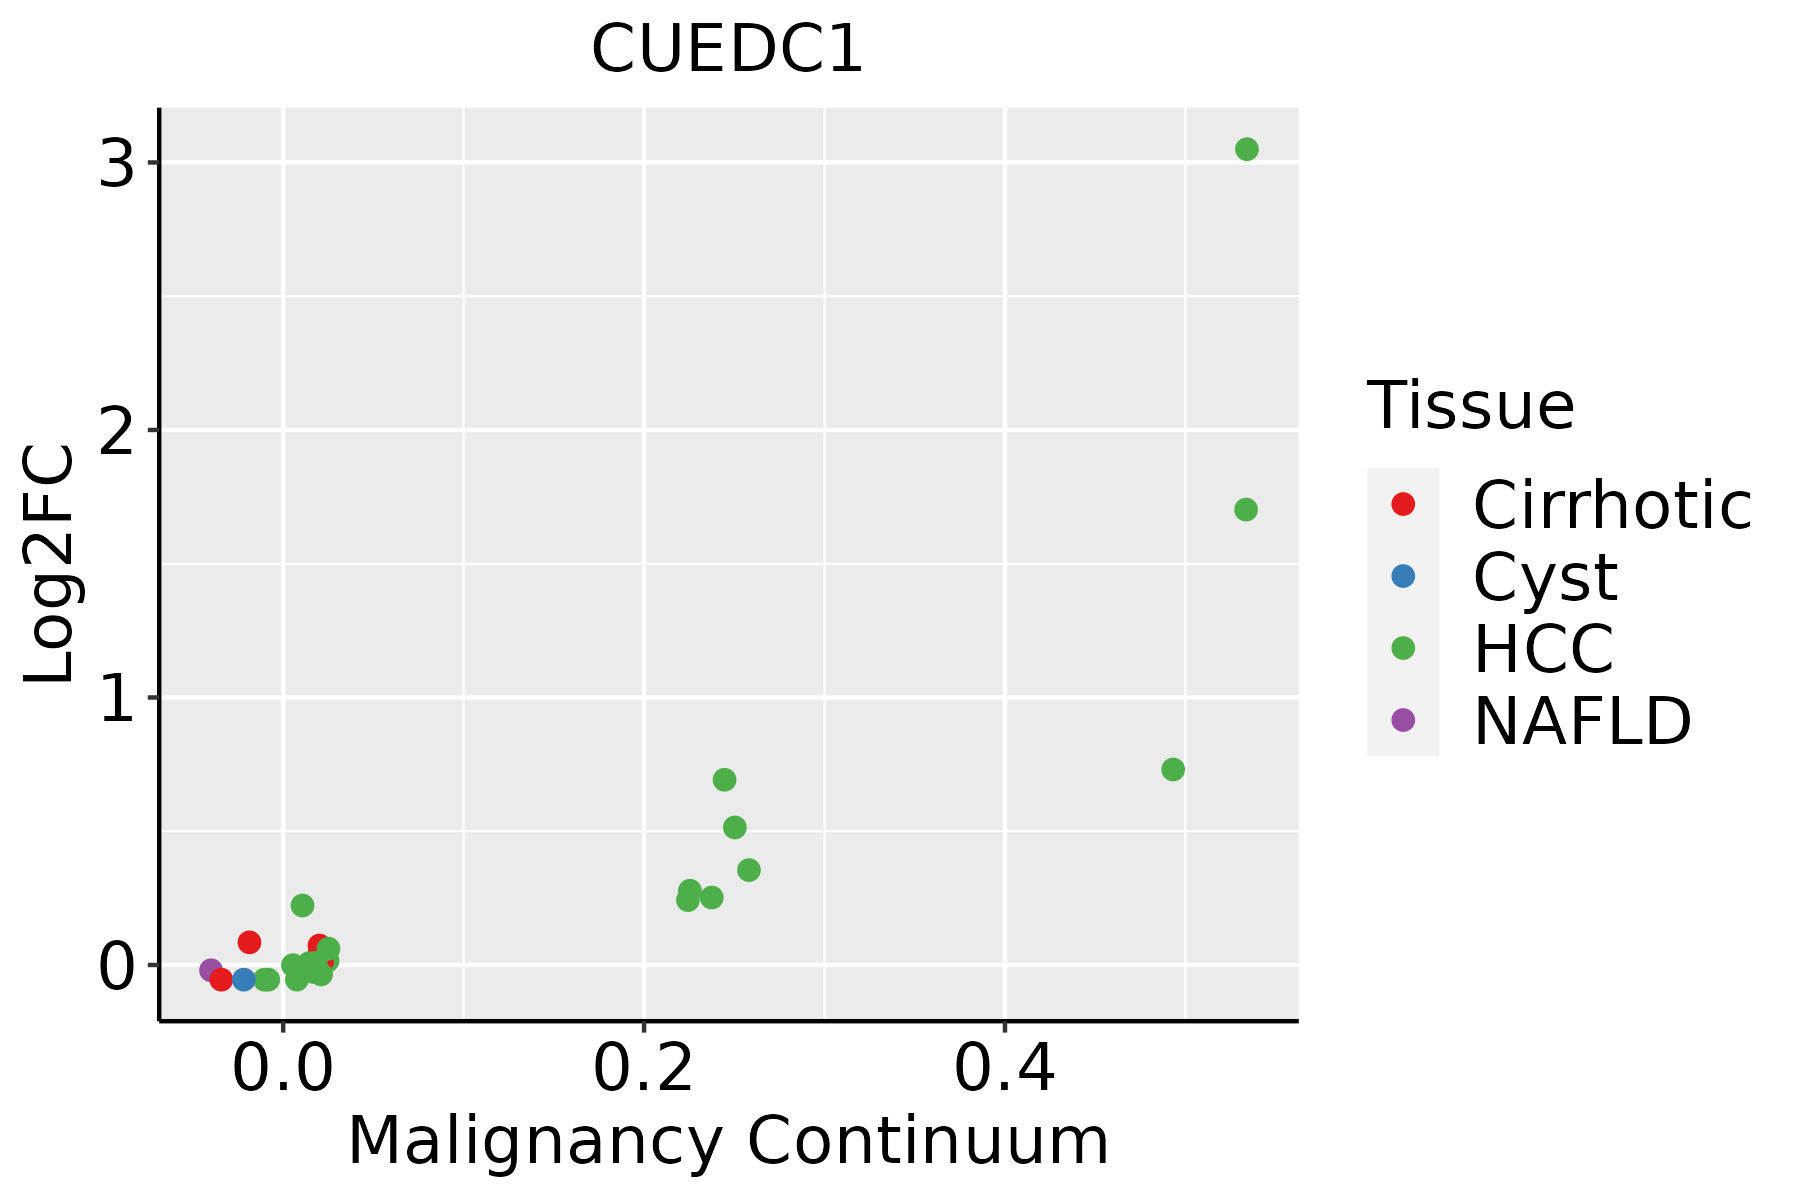 | HCC: Hepatocellular carcinoma |
| NAFLD: Non-alcoholic fatty liver disease | ||
| Lung | 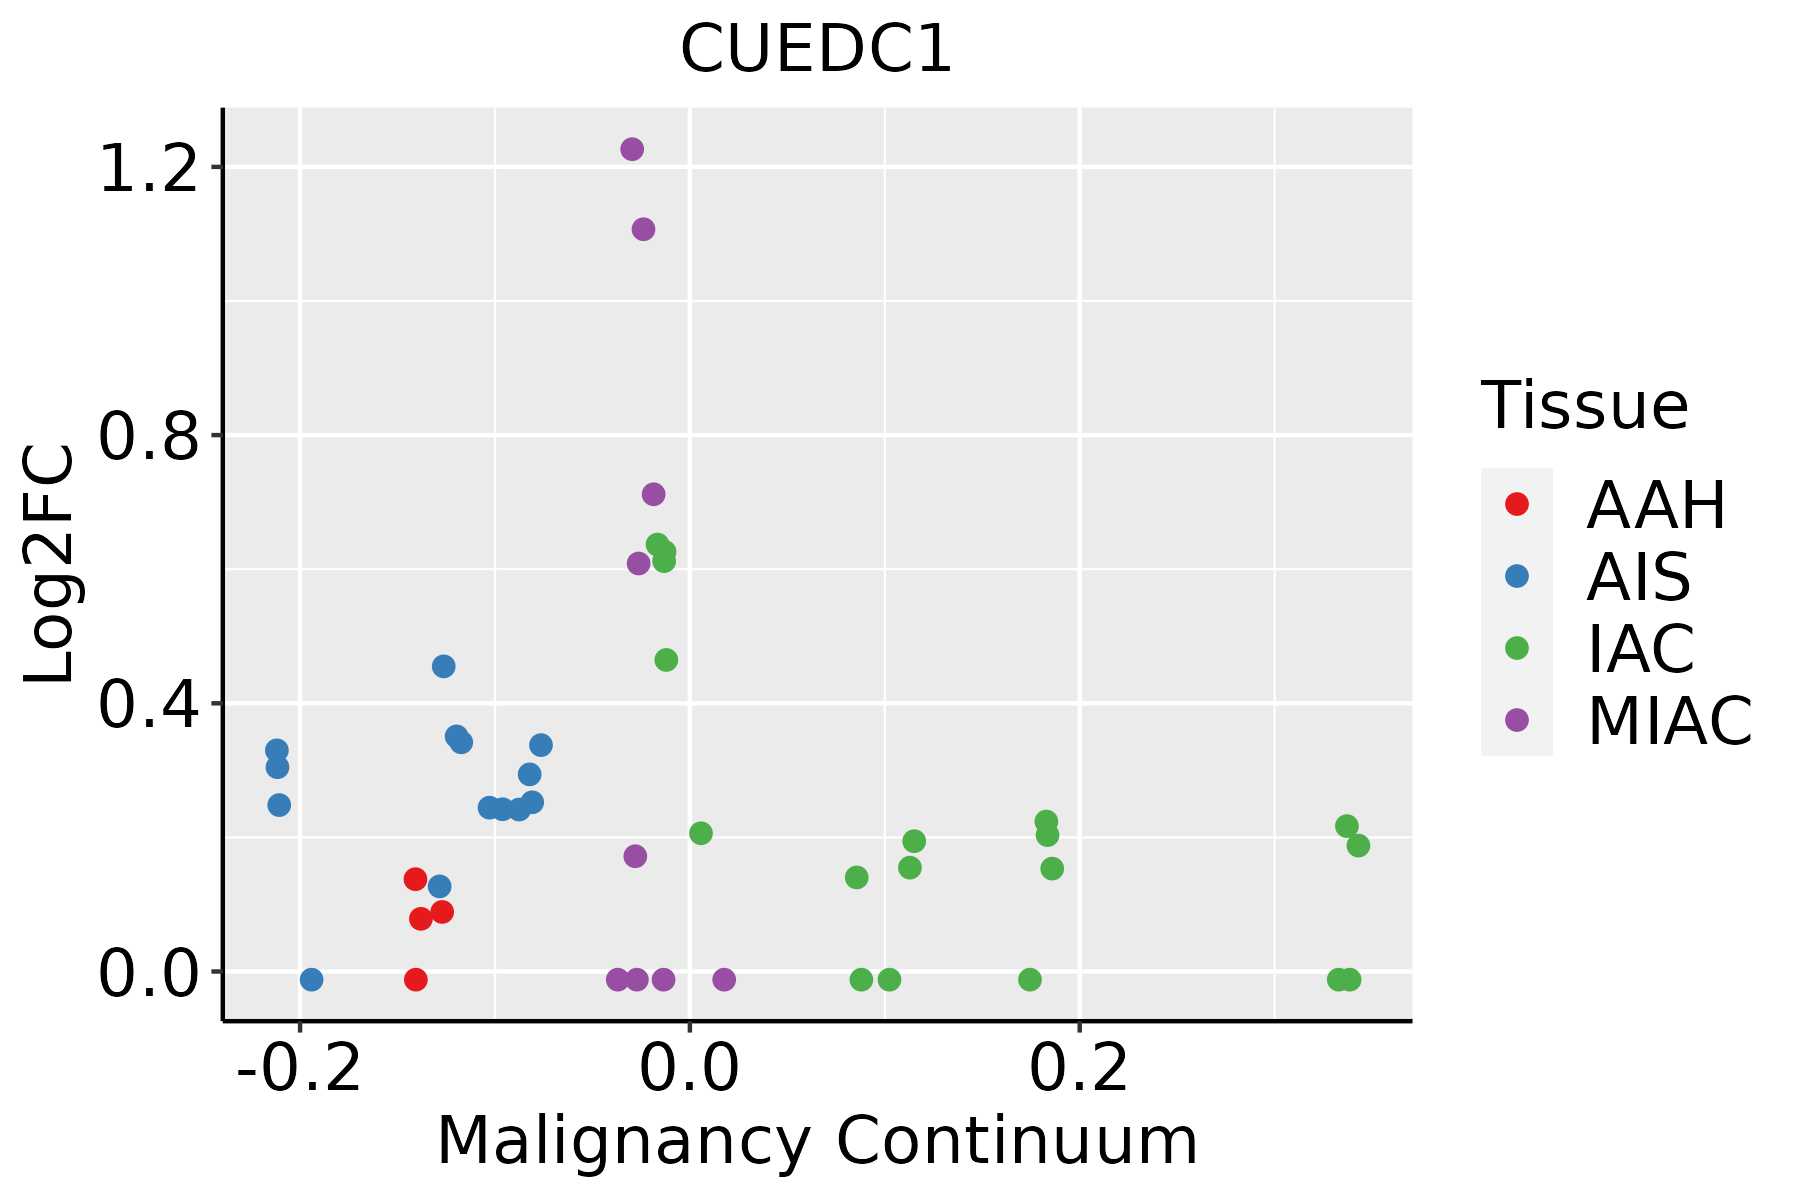 | AAH: Atypical adenomatous hyperplasia |
| AIS: Adenocarcinoma in situ | ||
| IAC: Invasive lung adenocarcinoma | ||
| MIA: Minimally invasive adenocarcinoma | ||
| Thyroid | 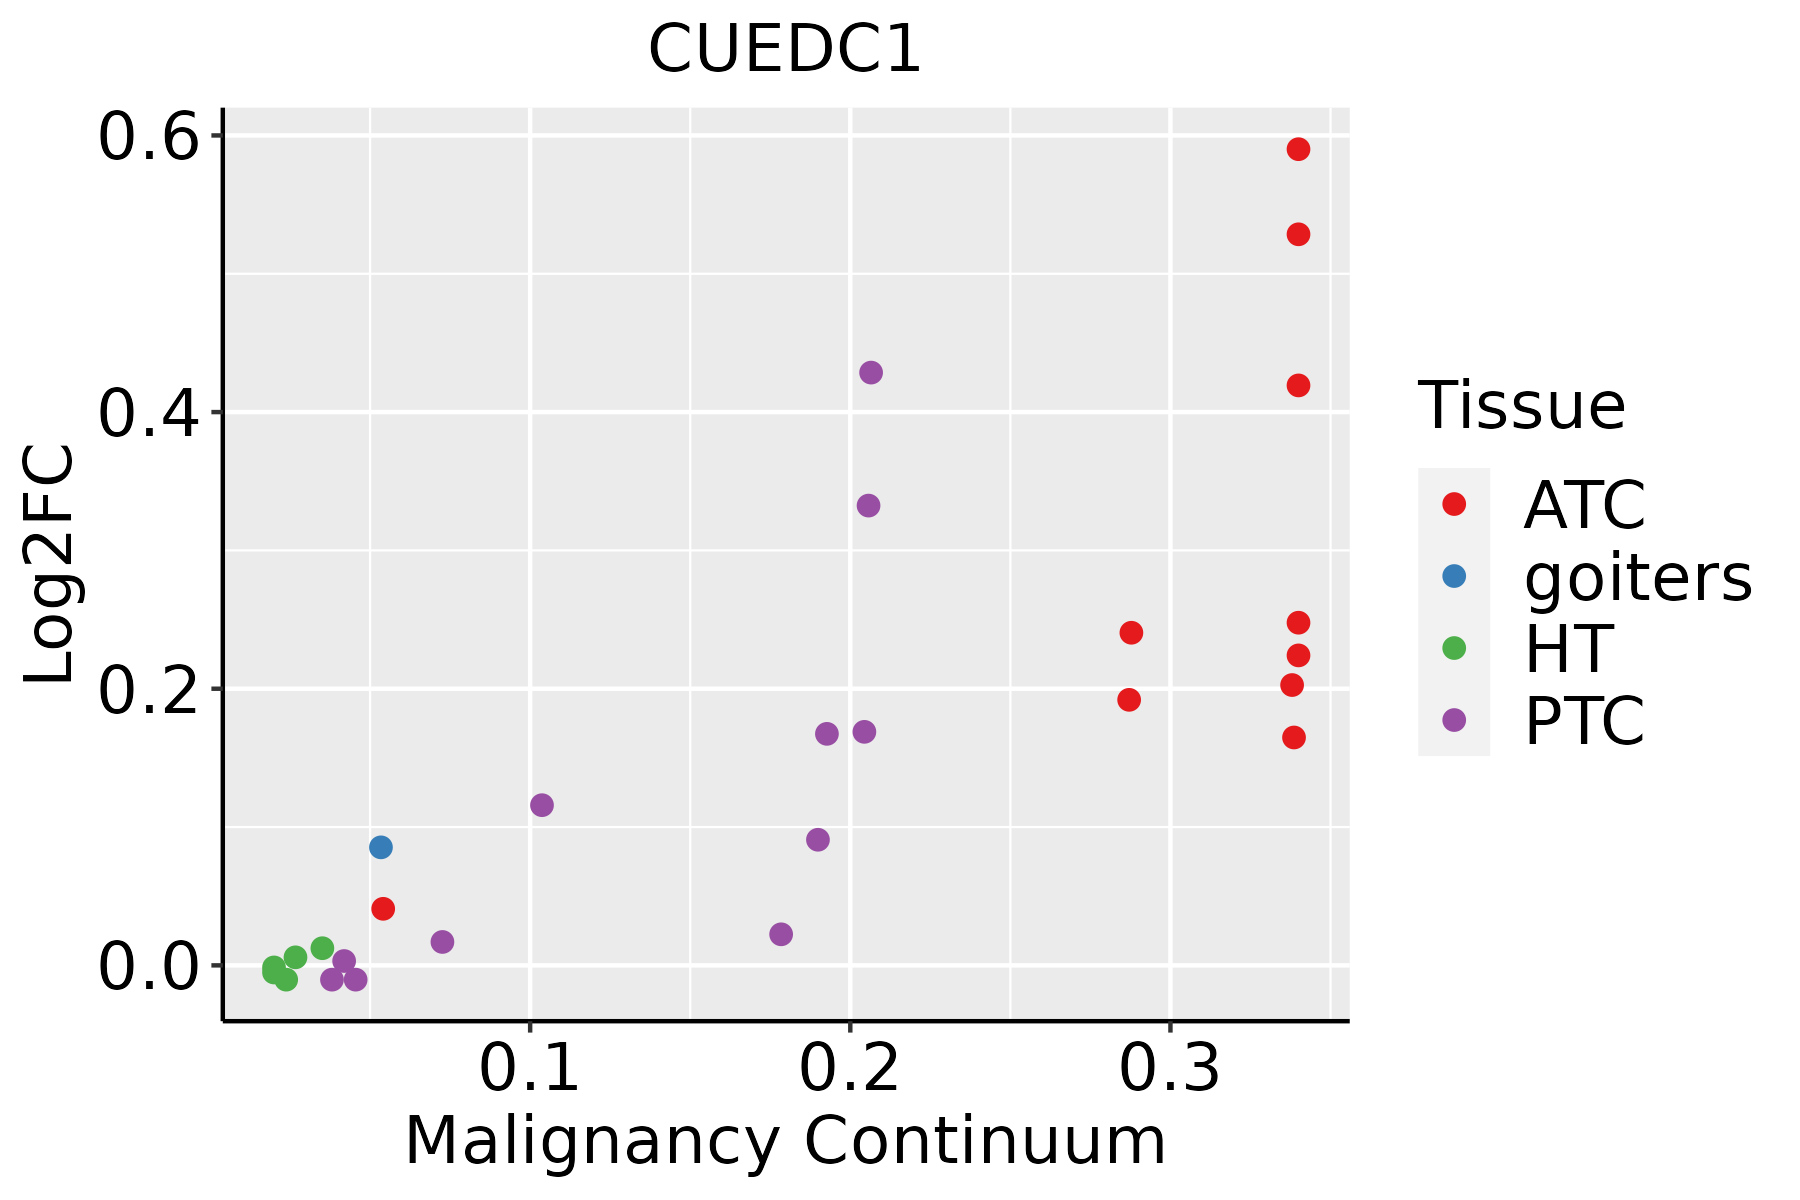 | ATC: Anaplastic thyroid cancer |
| HT: Hashimoto's thyroiditis | ||
| PTC: Papillary thyroid cancer |
| ∗log2FC in expression of this searched gene in stem-like cells from each diseased tissue sample relative to stem-like cells in normal samples in each tissue plotted against the malignancy continuum. Samples are colored based on if they are from different disease stage. |
Top |
Malignant transformation related pathway analysis |
| Find out the enriched GO biological processes and KEGG pathways involved in transition from healthy to precancer to cancer |
| Tissue | Disease Stage | Enriched GO biological Processes |
| Colorectum | AD |  |
| Colorectum | SER |  |
| Colorectum | MSS |  |
| Colorectum | MSI-H |  |
| Colorectum | FAP |  |
| ∗Top 15 enriched GO BP terms are showed in the bar plot of each disease state in each tissue. Each row represents a significant GO biological process which is colored according to the -log10(p.adjust). |
| Page: 1 2 3 4 5 6 7 8 9 |
| GO ID | Tissue | Disease Stage | Description | Gene Ratio | Bg Ratio | pvalue | p.adjust | Count |
| Page: 1 |
| Pathway ID | Tissue | Disease Stage | Description | Gene Ratio | Bg Ratio | pvalue | p.adjust | qvalue | Count |
| Page: 1 |
Top |
Cell-cell communication analysis |
| Identification of potential cell-cell interactions between two cell types and their ligand-receptor pairs for different disease states |
| Ligand | Receptor | LRpair | Pathway | Tissue | Disease Stage |
| Page: 1 |
Top |
Single-cell gene regulatory network inference analysis |
| Find out the significant the regulons (TFs) and the target genes of each regulon across cell types for different disease states |
| TF | Cell Type | Tissue | Disease Stage | Target Gene | RSS | Regulon Activity |
| ∗The dot plots of a searched regulon are shown for all cell subpopulations in each disease state of each tissue based on the regulon specific score inferred using pySCENIC and by calculating the average expression. |
| Page: 1 |
Top |
Somatic mutation of malignant transformation related genes |
| Annotation of somatic variants for genes involved in malignant transformation |
| Hugo Symbol | Variant Class | Variant Classification | dbSNP RS | HGVSc | HGVSp | HGVSp Short | SWISSPROT | BIOTYPE | SIFT | PolyPhen | Tumor Sample Barcode | Tissue | Histology | Sex | Age | Stage | Therapy Types | Drugs | Outcome |
| CUEDC1 | SNV | Missense_Mutation | c.281N>T | p.Ser94Ile | p.S94I | Q9NWM3 | protein_coding | tolerated(0.16) | benign(0) | TCGA-AO-A0JB-01 | Breast | breast invasive carcinoma | Female | <65 | III/IV | Chemotherapy | cyclophosphamide | SD | |
| CUEDC1 | SNV | Missense_Mutation | rs769636977 | c.598N>A | p.Ala200Thr | p.A200T | Q9NWM3 | protein_coding | tolerated(0.59) | benign(0.023) | TCGA-2W-A8YY-01 | Cervix | cervical & endocervical cancer | Female | <65 | I/II | Chemotherapy | cisplatin | CR |
| CUEDC1 | SNV | Missense_Mutation | novel | c.162N>A | p.Phe54Leu | p.F54L | Q9NWM3 | protein_coding | deleterious(0) | probably_damaging(0.999) | TCGA-C5-A905-01 | Cervix | cervical & endocervical cancer | Female | <65 | I/II | Unknown | Unknown | SD |
| CUEDC1 | SNV | Missense_Mutation | rs139905264 | c.1088N>T | p.Ala363Val | p.A363V | Q9NWM3 | protein_coding | tolerated_low_confidence(0.32) | benign(0.058) | TCGA-EA-A410-01 | Cervix | cervical & endocervical cancer | Female | <65 | I/II | Unknown | Unknown | SD |
| CUEDC1 | SNV | Missense_Mutation | novel | c.246N>A | p.Asp82Glu | p.D82E | Q9NWM3 | protein_coding | deleterious(0) | probably_damaging(1) | TCGA-AZ-4681-01 | Colorectum | colon adenocarcinoma | Female | >=65 | I/II | Unknown | Unknown | SD |
| CUEDC1 | SNV | Missense_Mutation | c.523C>T | p.Pro175Ser | p.P175S | Q9NWM3 | protein_coding | deleterious(0) | probably_damaging(0.997) | TCGA-CK-4951-01 | Colorectum | colon adenocarcinoma | Female | >=65 | I/II | Unknown | Unknown | PD | |
| CUEDC1 | SNV | Missense_Mutation | c.1046N>T | p.Ala349Val | p.A349V | Q9NWM3 | protein_coding | deleterious(0) | possibly_damaging(0.521) | TCGA-CM-5348-01 | Colorectum | colon adenocarcinoma | Male | >=65 | III/IV | Unknown | Unknown | SD | |
| CUEDC1 | SNV | Missense_Mutation | c.163N>C | p.Lys55Gln | p.K55Q | Q9NWM3 | protein_coding | deleterious(0.02) | possibly_damaging(0.903) | TCGA-WS-AB45-01 | Colorectum | colon adenocarcinoma | Female | <65 | I/II | Unknown | Unknown | SD | |
| CUEDC1 | deletion | Frame_Shift_Del | rs776086737 | c.958_961delNNNN | p.Phe320AsnfsTer12 | p.F320Nfs*12 | Q9NWM3 | protein_coding | TCGA-G4-6306-01 | Colorectum | colon adenocarcinoma | Male | >=65 | I/II | Unknown | Unknown | SD | ||
| CUEDC1 | SNV | Missense_Mutation | c.199N>A | p.Glu67Lys | p.E67K | Q9NWM3 | protein_coding | deleterious(0) | probably_damaging(1) | TCGA-AP-A051-01 | Endometrium | uterine corpus endometrioid carcinoma | Female | >=65 | I/II | Unknown | Unknown | SD |
| Page: 1 2 3 4 5 |
Top |
Related drugs of malignant transformation related genes |
| Identification of chemicals and drugs interact with genes involved in malignant transfromation |
| (DGIdb 4.0) |
| Entrez ID | Symbol | Category | Interaction Types | Drug Claim Name | Drug Name | PMIDs |
| Page: 1 |

Copyright 2023-Present -The University of Texas Health Science Center at Houston |