
|
|||||
|
 | |
| |
| |
| |
| |
| |
|
Gene: CTU1 |
Gene summary for CTU1 |
| Gene information | Species | Human | Gene symbol | CTU1 | Gene ID | 90353 |
| Gene name | cytosolic thiouridylase subunit 1 | |
| Gene Alias | ATPBD3 | |
| Cytomap | 19q13.41 | |
| Gene Type | protein-coding | GO ID | GO:0002097 | UniProtAcc | Q7Z7A3 |
Top |
Malignant transformation analysis |
| Identification of the aberrant gene expression in precancerous and cancerous lesions by comparing the gene expression of stem-like cells in diseased tissues with normal stem cells |
| Entrez ID | Symbol | Replicates | Species | Organ | Tissue | Adj P-value | Log2FC | Malignancy |
| 90353 | CTU1 | C30 | Human | Oral cavity | OSCC | 2.95e-22 | 9.77e-01 | 0.3055 |
| 90353 | CTU1 | C38 | Human | Oral cavity | OSCC | 1.17e-04 | 6.13e-01 | 0.172 |
| 90353 | CTU1 | C43 | Human | Oral cavity | OSCC | 1.27e-11 | 3.68e-01 | 0.1704 |
| 90353 | CTU1 | C08 | Human | Oral cavity | OSCC | 2.59e-11 | 3.42e-01 | 0.1919 |
| 90353 | CTU1 | SYSMH1 | Human | Oral cavity | OSCC | 1.69e-08 | 2.38e-01 | 0.1127 |
| 90353 | CTU1 | SYSMH2 | Human | Oral cavity | OSCC | 1.48e-19 | 6.14e-01 | 0.2326 |
| 90353 | CTU1 | SYSMH3 | Human | Oral cavity | OSCC | 1.49e-23 | 7.44e-01 | 0.2442 |
| 90353 | CTU1 | SYSMH4 | Human | Oral cavity | OSCC | 3.20e-06 | 1.46e-01 | 0.1226 |
| 90353 | CTU1 | SYSMH5 | Human | Oral cavity | OSCC | 4.42e-03 | 2.44e-01 | 0.0647 |
| 90353 | CTU1 | SYSMH6 | Human | Oral cavity | OSCC | 2.31e-04 | 2.20e-01 | 0.1275 |
| 90353 | CTU1 | PTC01 | Human | Thyroid | PTC | 5.32e-07 | 1.66e-01 | 0.1899 |
| 90353 | CTU1 | PTC04 | Human | Thyroid | PTC | 2.43e-03 | 1.49e-01 | 0.1927 |
| 90353 | CTU1 | PTC05 | Human | Thyroid | PTC | 1.07e-10 | 4.12e-01 | 0.2065 |
| 90353 | CTU1 | PTC06 | Human | Thyroid | PTC | 1.50e-16 | 3.53e-01 | 0.2057 |
| 90353 | CTU1 | PTC07 | Human | Thyroid | PTC | 2.18e-22 | 3.78e-01 | 0.2044 |
| 90353 | CTU1 | ATC09 | Human | Thyroid | ATC | 6.58e-13 | 5.13e-01 | 0.2871 |
| 90353 | CTU1 | ATC11 | Human | Thyroid | ATC | 3.14e-03 | 2.91e-01 | 0.3386 |
| 90353 | CTU1 | ATC12 | Human | Thyroid | ATC | 3.70e-07 | 1.83e-01 | 0.34 |
| 90353 | CTU1 | ATC13 | Human | Thyroid | ATC | 5.88e-09 | 1.64e-01 | 0.34 |
| 90353 | CTU1 | ATC1 | Human | Thyroid | ATC | 1.02e-14 | 6.00e-01 | 0.2878 |
| Page: 1 2 |
| Tissue | Expression Dynamics | Abbreviation |
| Oral Cavity | 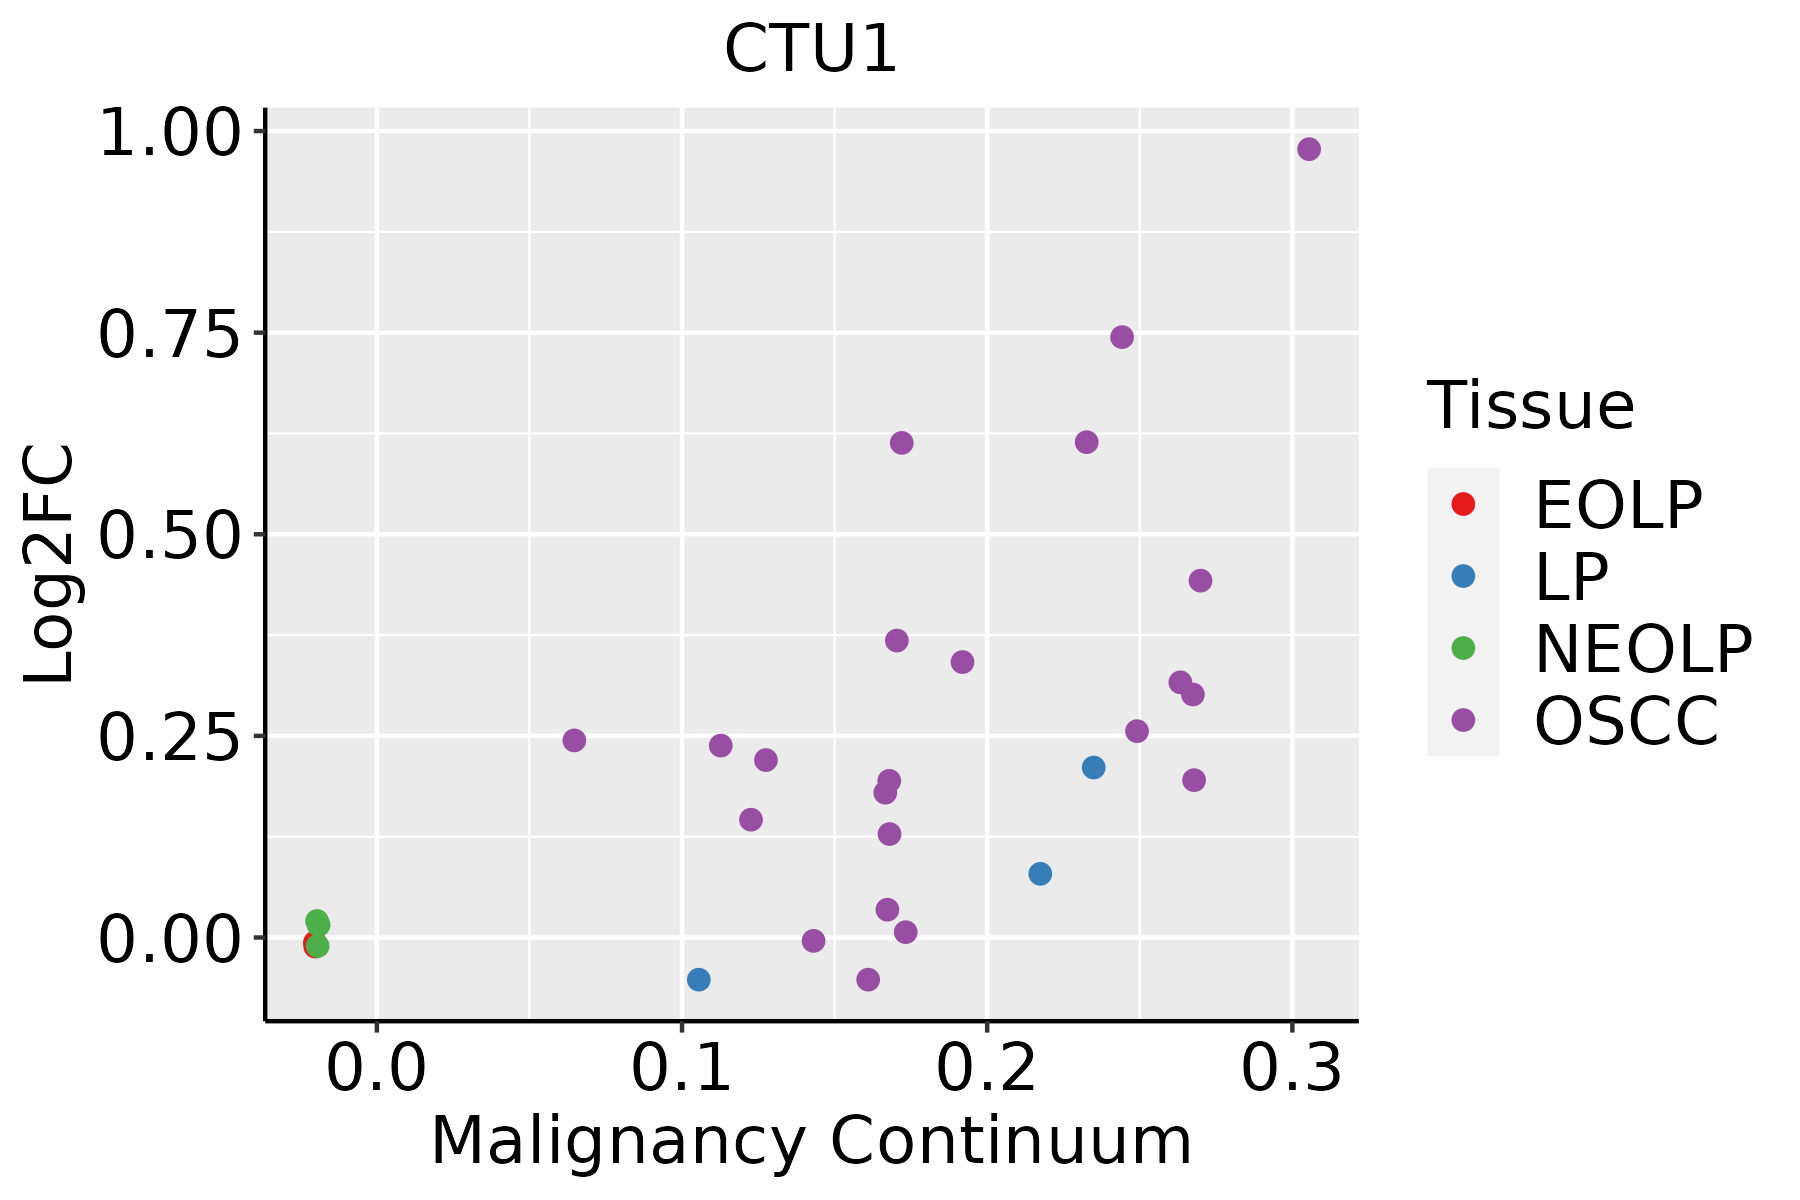 | EOLP: Erosive Oral lichen planus |
| LP: leukoplakia | ||
| NEOLP: Non-erosive oral lichen planus | ||
| OSCC: Oral squamous cell carcinoma | ||
| Thyroid | 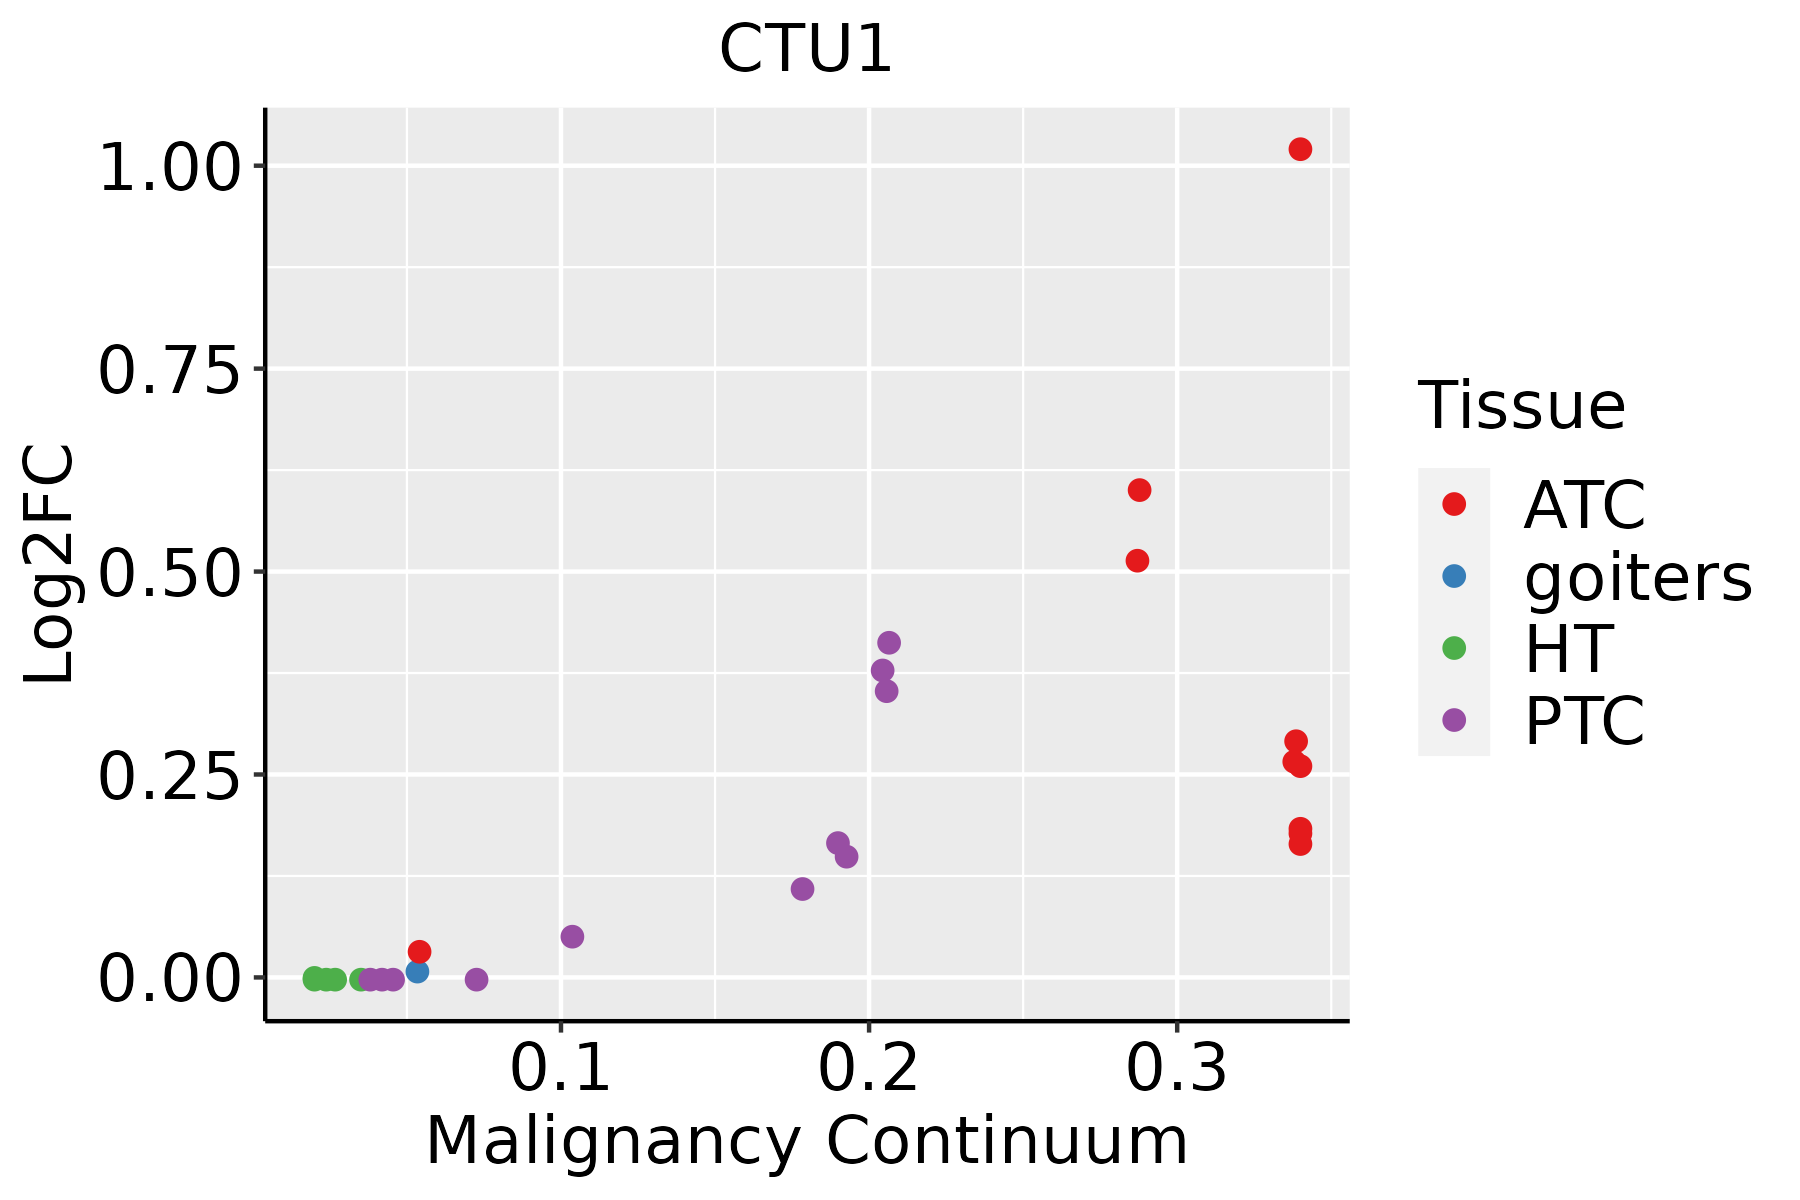 | ATC: Anaplastic thyroid cancer |
| HT: Hashimoto's thyroiditis | ||
| PTC: Papillary thyroid cancer |
| ∗log2FC in expression of this searched gene in stem-like cells from each diseased tissue sample relative to stem-like cells in normal samples in each tissue plotted against the malignancy continuum. Samples are colored based on if they are from different disease stage. |
Top |
Malignant transformation related pathway analysis |
| Find out the enriched GO biological processes and KEGG pathways involved in transition from healthy to precancer to cancer |
| Tissue | Disease Stage | Enriched GO biological Processes |
| Colorectum | AD |  |
| Colorectum | SER |  |
| Colorectum | MSS |  |
| Colorectum | MSI-H |  |
| Colorectum | FAP |  |
| ∗Top 15 enriched GO BP terms are showed in the bar plot of each disease state in each tissue. Each row represents a significant GO biological process which is colored according to the -log10(p.adjust). |
| Page: 1 2 3 4 5 6 7 8 9 |
| GO ID | Tissue | Disease Stage | Description | Gene Ratio | Bg Ratio | pvalue | p.adjust | Count |
| GO:00344709 | Oral cavity | OSCC | ncRNA processing | 263/7305 | 395/18723 | 4.38e-29 | 2.78e-26 | 263 |
| GO:00346605 | Oral cavity | OSCC | ncRNA metabolic process | 296/7305 | 485/18723 | 2.94e-23 | 6.65e-21 | 296 |
| GO:00080332 | Oral cavity | OSCC | tRNA processing | 78/7305 | 127/18723 | 2.56e-07 | 4.00e-06 | 78 |
| GO:00063991 | Oral cavity | OSCC | tRNA metabolic process | 101/7305 | 179/18723 | 1.65e-06 | 2.15e-05 | 101 |
| GO:00094511 | Oral cavity | OSCC | RNA modification | 95/7305 | 167/18723 | 2.05e-06 | 2.62e-05 | 95 |
| GO:00064001 | Oral cavity | OSCC | tRNA modification | 53/7305 | 90/18723 | 1.04e-04 | 7.70e-04 | 53 |
| GO:003447018 | Thyroid | PTC | ncRNA processing | 215/5968 | 395/18723 | 7.14e-21 | 1.22e-18 | 215 |
| GO:00346608 | Thyroid | PTC | ncRNA metabolic process | 239/5968 | 485/18723 | 5.54e-16 | 4.26e-14 | 239 |
| GO:003447021 | Thyroid | ATC | ncRNA processing | 216/6293 | 395/18723 | 3.14e-18 | 3.98e-16 | 216 |
| GO:003466021 | Thyroid | ATC | ncRNA metabolic process | 240/6293 | 485/18723 | 2.03e-13 | 9.91e-12 | 240 |
| Page: 1 |
| Pathway ID | Tissue | Disease Stage | Description | Gene Ratio | Bg Ratio | pvalue | p.adjust | qvalue | Count |
| Page: 1 |
Top |
Cell-cell communication analysis |
| Identification of potential cell-cell interactions between two cell types and their ligand-receptor pairs for different disease states |
| Ligand | Receptor | LRpair | Pathway | Tissue | Disease Stage |
| Page: 1 |
Top |
Single-cell gene regulatory network inference analysis |
| Find out the significant the regulons (TFs) and the target genes of each regulon across cell types for different disease states |
| TF | Cell Type | Tissue | Disease Stage | Target Gene | RSS | Regulon Activity |
| ∗The dot plots of a searched regulon are shown for all cell subpopulations in each disease state of each tissue based on the regulon specific score inferred using pySCENIC and by calculating the average expression. |
| Page: 1 |
Top |
Somatic mutation of malignant transformation related genes |
| Annotation of somatic variants for genes involved in malignant transformation |
| Hugo Symbol | Variant Class | Variant Classification | dbSNP RS | HGVSc | HGVSp | HGVSp Short | SWISSPROT | BIOTYPE | SIFT | PolyPhen | Tumor Sample Barcode | Tissue | Histology | Sex | Age | Stage | Therapy Types | Drugs | Outcome |
| CTU1 | SNV | Missense_Mutation | c.109N>A | p.Glu37Lys | p.E37K | Q7Z7A3 | protein_coding | deleterious(0.01) | benign(0.02) | TCGA-UC-A7PF-01 | Cervix | cervical & endocervical cancer | Female | <65 | I/II | Unknown | Unknown | SD | |
| CTU1 | SNV | Missense_Mutation | c.484N>A | p.Val162Met | p.V162M | Q7Z7A3 | protein_coding | tolerated(0.09) | possibly_damaging(0.561) | TCGA-NH-A8F7-06 | Colorectum | NA | NA | NA | NA | NA | NA | NA | |
| CTU1 | SNV | Missense_Mutation | novel | c.14C>T | p.Pro5Leu | p.P5L | Q7Z7A3 | protein_coding | tolerated(0.36) | benign(0) | TCGA-AJ-A3EK-01 | Endometrium | uterine corpus endometrioid carcinoma | Female | <65 | I/II | Chemotherapy | carboplatin | CR |
| CTU1 | SNV | Missense_Mutation | novel | c.11N>T | p.Pro4Leu | p.P4L | Q7Z7A3 | protein_coding | tolerated(0.08) | benign(0.028) | TCGA-EY-A1GQ-01 | Endometrium | uterine corpus endometrioid carcinoma | Female | >=65 | I/II | Chemotherapy | taxol | SD |
| CTU1 | SNV | Missense_Mutation | novel | c.530C>T | p.Ala177Val | p.A177V | Q7Z7A3 | protein_coding | deleterious(0) | probably_damaging(0.997) | TCGA-EY-A215-01 | Endometrium | uterine corpus endometrioid carcinoma | Female | <65 | I/II | Unknown | Unknown | SD |
| CTU1 | SNV | Missense_Mutation | c.571N>T | p.Arg191Trp | p.R191W | Q7Z7A3 | protein_coding | deleterious(0) | probably_damaging(0.999) | TCGA-33-4532-01 | Lung | lung squamous cell carcinoma | Male | >=65 | I/II | Unknown | Unknown | SD | |
| CTU1 | SNV | Missense_Mutation | novel | c.524N>G | p.Asp175Gly | p.D175G | Q7Z7A3 | protein_coding | deleterious(0) | possibly_damaging(0.795) | TCGA-BR-4361-01 | Stomach | stomach adenocarcinoma | Female | >=65 | III/IV | Unknown | Unknown | SD |
| CTU1 | SNV | Missense_Mutation | novel | c.478N>T | p.Arg160Cys | p.R160C | Q7Z7A3 | protein_coding | tolerated(0.11) | benign(0.006) | TCGA-VQ-AA68-01 | Stomach | stomach adenocarcinoma | Female | <65 | III/IV | Chemotherapy | fluorouracil | CR |
| Page: 1 |
Top |
Related drugs of malignant transformation related genes |
| Identification of chemicals and drugs interact with genes involved in malignant transfromation |
| (DGIdb 4.0) |
| Entrez ID | Symbol | Category | Interaction Types | Drug Claim Name | Drug Name | PMIDs |
| Page: 1 |

Copyright 2023-Present -The University of Texas Health Science Center at Houston |