Schematic overview of the cellular and molecular mechanisms involved in the cancer progression, including the proposed cellular and molecular mechanisms in cancer cells trajectory. AT1: alveolar type 1 cells; AT2: alveolar type 2 cells; AAH: atypical adenomatous hyperplasia; AIS: adenocarcinoma in situ; MIA: minimally invasive adenocarcinoma; IA: invasive adenocarcinoma; EMT: epithelial-mesenchymal transition

Home

Download

Statistics

Help

Contact

Center for Computational Systems Medicine
leaf

Gene summary

leaf

Malignant transformation analysis

leaf

Malignant transformation related pathway analysis

leaf

Cell-cell communication analysis

leaf

Single-cell gene regulatory network inference analysis

leaf

Somatic mutation of malignant transformation related genes

leaf

Related drugs of malignant transformation related genes

Gene: CTTNBP2NL

Gene summary for CTTNBP2NL

check button Gene summary.

Gene informationSpeciesHuman
Gene symbol

CTTNBP2NL

Gene ID

55917

Gene nameCTTNBP2 N-terminal like
Gene AliasCTTNBP2NL
Cytomap1p13.2
Gene Typeprotein-coding
GO ID

GO:0006464

UniProtAcc

A0A024R0C7


Top

Malignant transformation analysis

check button Identification of the aberrant gene expression in precancerous and cancerous lesions by comparing the gene expression of stem-like cells in diseased tissues with normal stem cells
check button Malignant transformation involving gene list.
Entrez IDSymbolReplicatesSpeciesOrganTissueAdj P-valueLog2FCMalignancy
55917CTTNBP2NLHTA11_347_2000001011HumanColorectumAD4.67e-167.53e-01-0.1954
55917CTTNBP2NLHTA11_411_2000001011HumanColorectumSER4.01e-047.76e-01-0.2602
55917CTTNBP2NLHTA11_99999974143_84620HumanColorectumMSS1.78e-06-3.49e-010.3005
55917CTTNBP2NLA001-C-207HumanColorectumFAP9.11e-03-1.99e-010.1278
55917CTTNBP2NLA015-C-203HumanColorectumFAP1.89e-23-3.37e-01-0.1294
55917CTTNBP2NLA015-C-204HumanColorectumFAP5.30e-06-3.89e-01-0.0228
55917CTTNBP2NLA014-C-040HumanColorectumFAP1.56e-02-2.11e-01-0.1184
55917CTTNBP2NLA002-C-201HumanColorectumFAP1.68e-11-3.41e-010.0324
55917CTTNBP2NLA002-C-203HumanColorectumFAP1.24e-03-1.78e-010.2786
55917CTTNBP2NLA001-C-108HumanColorectumFAP1.15e-12-2.10e-01-0.0272
55917CTTNBP2NLA002-C-205HumanColorectumFAP1.05e-17-6.05e-02-0.1236
55917CTTNBP2NLA015-C-005HumanColorectumFAP2.86e-02-2.11e-01-0.0336
55917CTTNBP2NLA015-C-006HumanColorectumFAP8.85e-12-3.55e-01-0.0994
55917CTTNBP2NLA015-C-106HumanColorectumFAP4.57e-12-2.69e-01-0.0511
55917CTTNBP2NLA002-C-114HumanColorectumFAP6.97e-16-8.67e-02-0.1561
55917CTTNBP2NLA015-C-104HumanColorectumFAP5.03e-25-2.12e-01-0.1899
55917CTTNBP2NLA001-C-014HumanColorectumFAP5.49e-10-2.42e-010.0135
55917CTTNBP2NLA002-C-016HumanColorectumFAP4.68e-18-2.92e-010.0521
55917CTTNBP2NLA015-C-002HumanColorectumFAP1.10e-09-4.17e-01-0.0763
55917CTTNBP2NLA001-C-203HumanColorectumFAP3.12e-09-1.14e-01-0.0481
Page: 1 2 3 4 5 6 

check button Transcriptomic changes along malignancy continuum.
TissueExpression DynamicsAbbreviation
Colorectum (GSE201348)The image shows the transcriptomic changes along malignancy continuum.log2FC in expression of this searched gene in stem-like cells from each diseased tissue sample relative to stem-like cells in normal samples in each tissue plotted against the malignancy continuum. Samples are colored based on if they are from different disease stage.FAP: Familial adenomatous polyposis
CRC: Colorectal cancer
Colorectum (HTA11)The image shows the transcriptomic changes along malignancy continuum.log2FC in expression of this searched gene in stem-like cells from each diseased tissue sample relative to stem-like cells in normal samples in each tissue plotted against the malignancy continuum. Samples are colored based on if they are from different disease stage.AD: Adenomas
SER: Sessile serrated lesions
MSI-H: Microsatellite-high colorectal cancer
MSS: Microsatellite stable colorectal cancer
EsophagusThe image shows the transcriptomic changes along malignancy continuum.log2FC in expression of this searched gene in stem-like cells from each diseased tissue sample relative to stem-like cells in normal samples in each tissue plotted against the malignancy continuum. Samples are colored based on if they are from different disease stage.
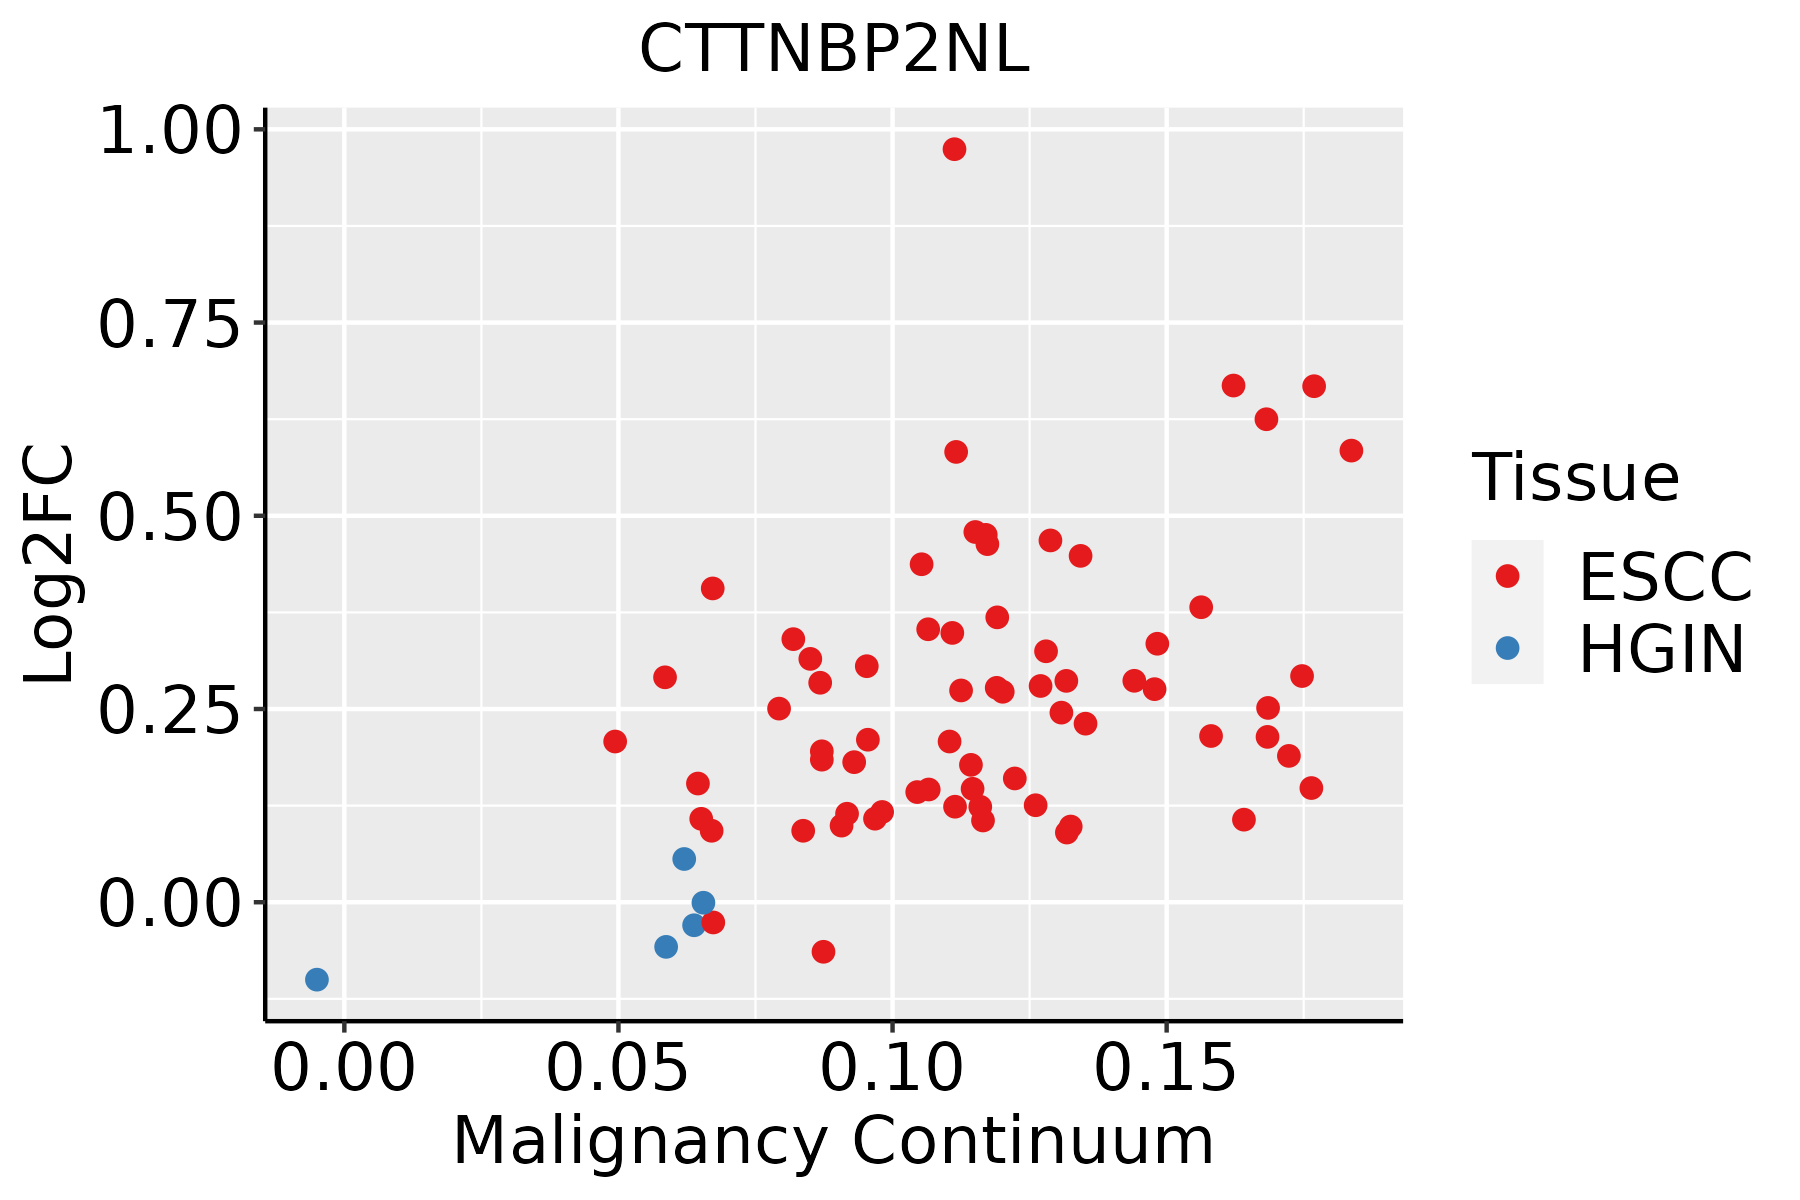
ESCC: Esophageal squamous cell carcinoma
HGIN: High-grade intraepithelial neoplasias
LGIN: Low-grade intraepithelial neoplasias
LungThe image shows the transcriptomic changes along malignancy continuum.log2FC in expression of this searched gene in stem-like cells from each diseased tissue sample relative to stem-like cells in normal samples in each tissue plotted against the malignancy continuum. Samples are colored based on if they are from different disease stage.
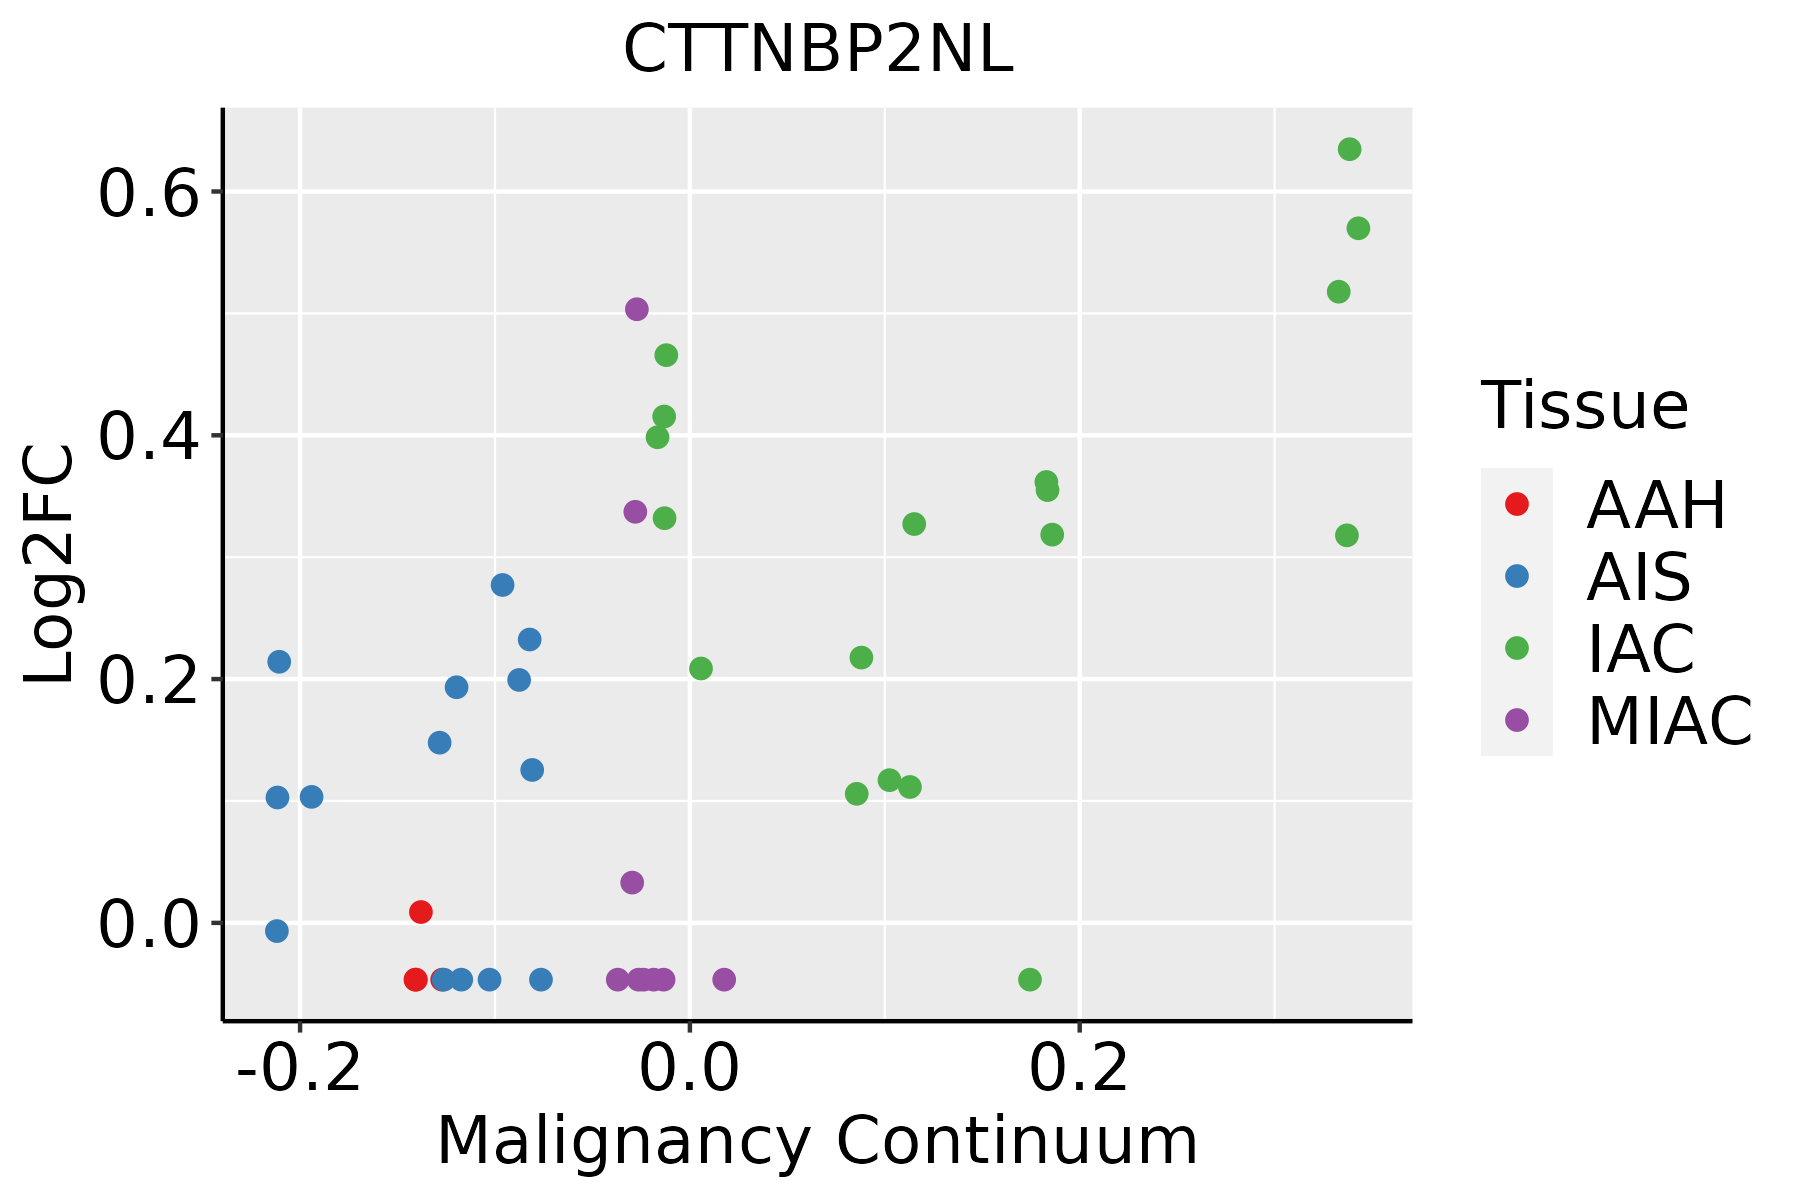
AAH: Atypical adenomatous hyperplasia
AIS: Adenocarcinoma in situ
IAC: Invasive lung adenocarcinoma
MIA: Minimally invasive adenocarcinoma
Oral CavityThe image shows the transcriptomic changes along malignancy continuum.log2FC in expression of this searched gene in stem-like cells from each diseased tissue sample relative to stem-like cells in normal samples in each tissue plotted against the malignancy continuum. Samples are colored based on if they are from different disease stage.
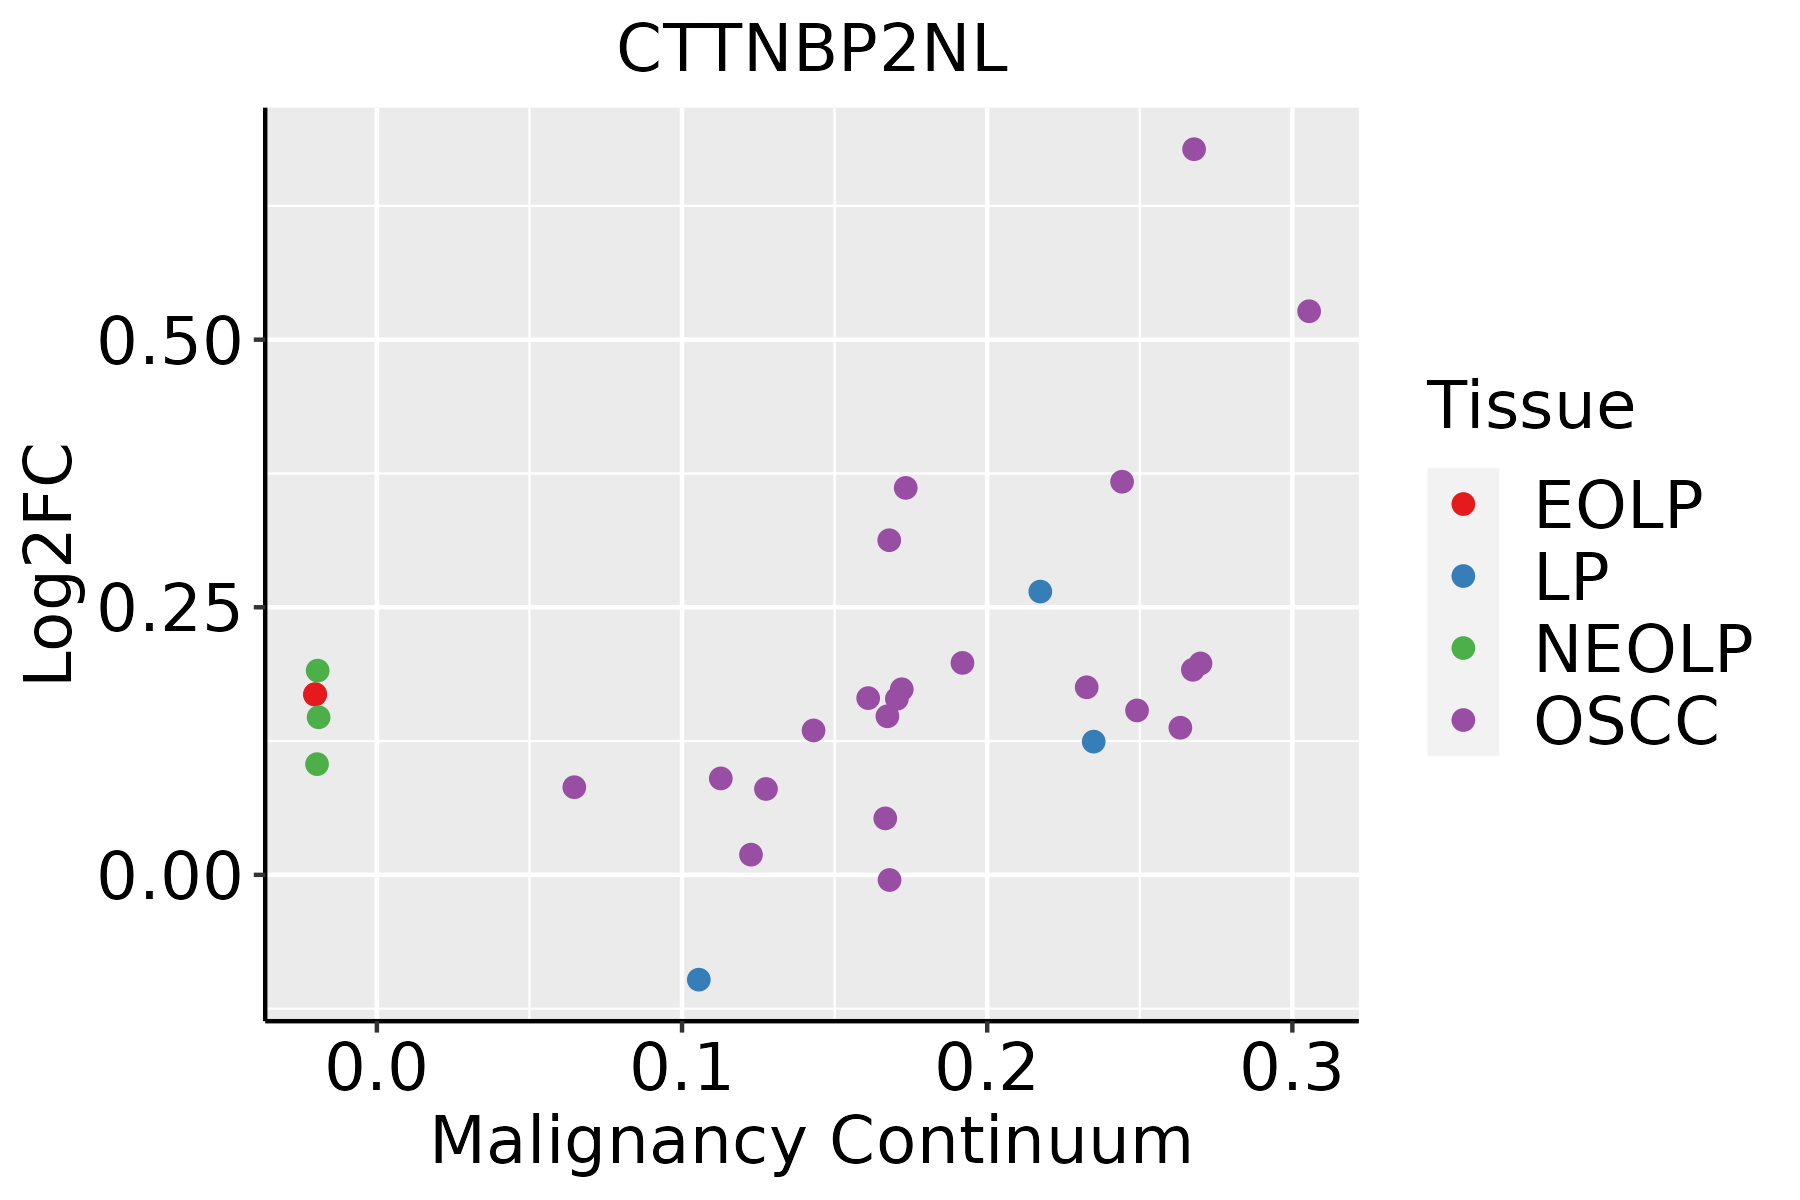
EOLP: Erosive Oral lichen planus
LP: leukoplakia
NEOLP: Non-erosive oral lichen planus
OSCC: Oral squamous cell carcinoma
ThyroidThe image shows the transcriptomic changes along malignancy continuum.log2FC in expression of this searched gene in stem-like cells from each diseased tissue sample relative to stem-like cells in normal samples in each tissue plotted against the malignancy continuum. Samples are colored based on if they are from different disease stage.
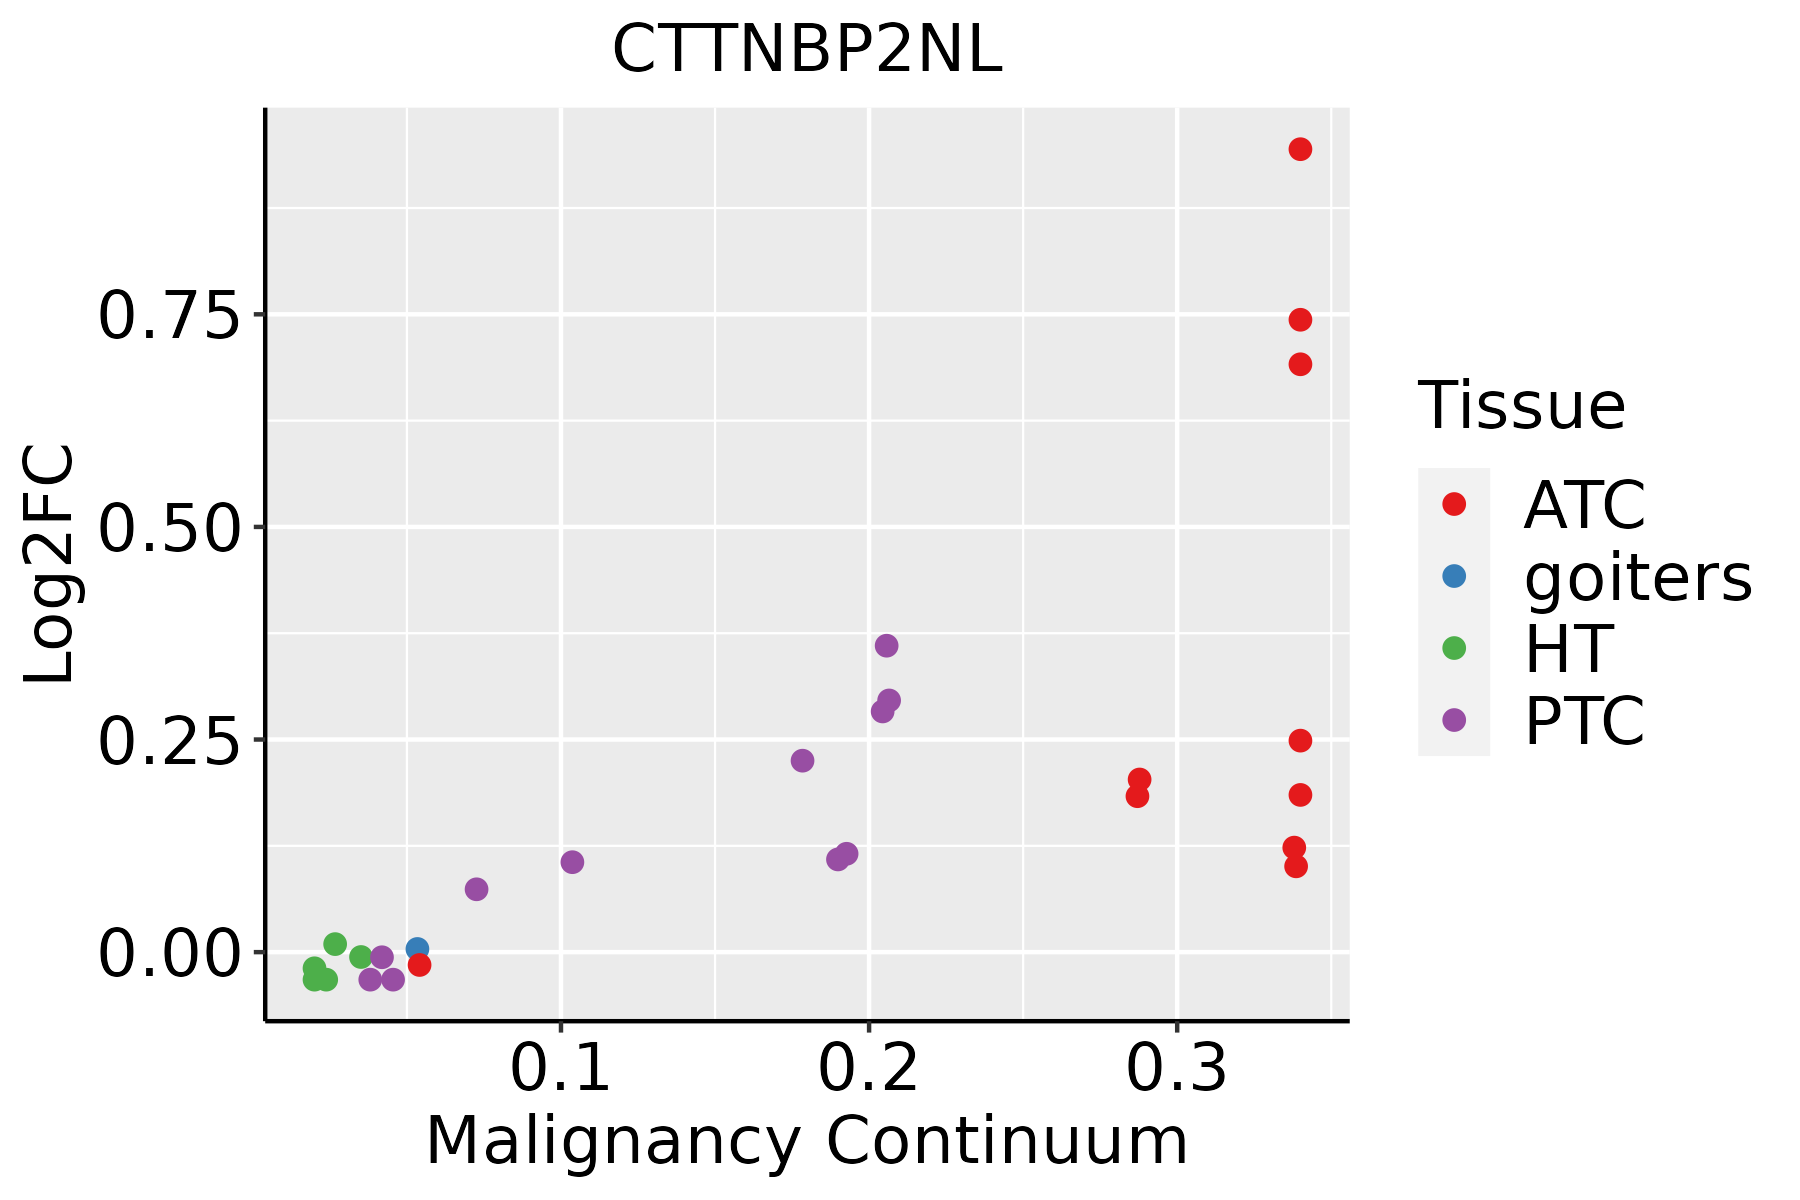
ATC: Anaplastic thyroid cancer
HT: Hashimoto's thyroiditis
PTC: Papillary thyroid cancer
∗log2FC in expression of this searched gene in stem-like cells from each diseased tissue sample relative to stem-like cells in normal samples in each tissue plotted against the malignancy continuum. Samples are colored based on if they are from different disease stage.

Top

Malignant transformation related pathway analysis

check buttonFind out the enriched GO biological processes and KEGG pathways involved in transition from healthy to precancer to cancer
check button Figure of enriched GO biological processes.
TissueDisease StageEnriched GO biological Processes
ColorectumADGO analysis - Figure of enriched GO biological processes: Top 15 enriched GO BP terms are showed in the bar plot of each disease state in each tissue. Each row represents a significant GO biological process which is colored according to the -log10(p.adjust).
ColorectumSERGO analysis - Figure of enriched GO biological processes: Top 15 enriched GO BP terms are showed in the bar plot of each disease state in each tissue. Each row represents a significant GO biological process which is colored according to the -log10(p.adjust).
ColorectumMSSGO analysis - Figure of enriched GO biological processes: Top 15 enriched GO BP terms are showed in the bar plot of each disease state in each tissue. Each row represents a significant GO biological process which is colored according to the -log10(p.adjust).
ColorectumMSI-HGO analysis - Figure of enriched GO biological processes: Top 15 enriched GO BP terms are showed in the bar plot of each disease state in each tissue. Each row represents a significant GO biological process which is colored according to the -log10(p.adjust).
ColorectumFAPGO analysis - Figure of enriched GO biological processes: Top 15 enriched GO BP terms are showed in the bar plot of each disease state in each tissue. Each row represents a significant GO biological process which is colored according to the -log10(p.adjust).
∗Top 15 enriched GO BP terms are showed in the bar plot of each disease state in each tissue. Each row represents a significant GO biological process which is colored according to the -log10(p.adjust).
Page: 1 2 3 4 5 6 7 8 9 

check button Enriched GO biological processes.
GO IDTissueDisease StageDescriptionGene RatioBg Ratiopvaluep.adjustCount
GO:0016311ColorectumADdephosphorylation123/3918417/187231.84e-053.82e-04123
GO:0006470ColorectumADprotein dephosphorylation88/3918281/187232.56e-054.89e-0488
GO:00064701ColorectumSERprotein dephosphorylation65/2897281/187234.44e-046.51e-0365
GO:0051051ColorectumSERnegative regulation of transport98/2897470/187231.01e-031.19e-0298
GO:00163111ColorectumSERdephosphorylation86/2897417/187232.73e-032.46e-0286
GO:0032409ColorectumSERregulation of transporter activity65/2897310/187235.71e-034.19e-0265
GO:00064702ColorectumMSSprotein dephosphorylation73/3467281/187231.15e-031.12e-0273
GO:00163112ColorectumMSSdephosphorylation101/3467417/187231.98e-031.70e-02101
GO:00324091ColorectumMSSregulation of transporter activity78/3467310/187232.09e-031.78e-0278
GO:00510511ColorectumMSSnegative regulation of transport110/3467470/187234.20e-033.04e-02110
GO:00163113ColorectumFAPdephosphorylation95/2622417/187237.07e-073.32e-0595
GO:00064704ColorectumFAPprotein dephosphorylation69/2622281/187231.47e-066.39e-0569
GO:00324092ColorectumFAPregulation of transporter activity67/2622310/187231.59e-042.43e-0367
GO:00510512ColorectumFAPnegative regulation of transport91/2622470/187237.09e-047.64e-0391
GO:00163114ColorectumCRCdephosphorylation79/2078417/187231.27e-067.21e-0579
GO:00064705ColorectumCRCprotein dephosphorylation57/2078281/187234.49e-061.87e-0457
GO:00324093ColorectumCRCregulation of transporter activity59/2078310/187232.34e-056.65e-0459
GO:00510513ColorectumCRCnegative regulation of transport71/2078470/187234.33e-033.47e-0271
GO:001631110EsophagusESCCdephosphorylation251/8552417/187231.26e-092.99e-08251
GO:000647018EsophagusESCCprotein dephosphorylation177/8552281/187233.13e-096.72e-08177
Page: 1 2 

check button Enriched KEGG pathways.
Pathway IDTissueDisease StageDescriptionGene RatioBg Ratiopvaluep.adjustqvalueCount
Page: 1 

Top

Cell-cell communication analysis

check buttonIdentification of potential cell-cell interactions between two cell types and their ligand-receptor pairs for different disease states
LigandReceptorLRpairPathwayTissueDisease Stage
Page: 1 

Top

Single-cell gene regulatory network inference analysis

check buttonFind out the significant the regulons (TFs) and the target genes of each regulon across cell types for different disease states
TFCell TypeTissueDisease StageTarget GeneRSSRegulon Activity
∗The dot plots of a searched regulon are shown for all cell subpopulations in each disease state of each tissue based on the regulon specific score inferred using pySCENIC and by calculating the average expression.
Page: 1 

Top

Somatic mutation of malignant transformation related genes

check buttonAnnotation of somatic variants for genes involved in malignant transformation
Hugo SymbolVariant ClassVariant ClassificationdbSNP RSHGVScHGVSpHGVSp ShortSWISSPROTBIOTYPESIFTPolyPhenTumor Sample BarcodeTissueHistologySexAgeStageTherapy TypesDrugsOutcome
CTTNBP2NLSNVMissense_Mutationnovelc.636C>Ap.Ser212Argp.S212RQ9P2B4protein_codingtolerated(0.19)benign(0.188)TCGA-AN-A046-01Breastbreast invasive carcinomaFemale>=65I/IIUnknownUnknownSD
CTTNBP2NLSNVMissense_Mutationc.1364N>Ap.Ile455Asnp.I455NQ9P2B4protein_codingdeleterious(0)possibly_damaging(0.691)TCGA-AN-A0AT-01Breastbreast invasive carcinomaFemale<65I/IIUnknownUnknownSD
CTTNBP2NLSNVMissense_Mutationc.1807N>Tp.His603Tyrp.H603YQ9P2B4protein_codingtolerated(0.27)benign(0.099)TCGA-AN-A0XW-01Breastbreast invasive carcinomaFemale<65III/IVUnknownUnknownSD
CTTNBP2NLSNVMissense_Mutationc.1894G>Cp.Glu632Glnp.E632QQ9P2B4protein_codingdeleterious(0.02)benign(0.287)TCGA-D8-A1J8-01Breastbreast invasive carcinomaFemale>=65I/IIHormone TherapynolvadexSD
CTTNBP2NLSNVMissense_Mutationnovelc.1768N>Cp.Thr590Prop.T590PQ9P2B4protein_codingdeleterious(0)benign(0.091)TCGA-D8-A1XK-01Breastbreast invasive carcinomaFemale<65I/IIChemotherapydoxorubicine+cyclophosphamideSD
CTTNBP2NLSNVMissense_Mutationrs754747435c.775N>Tp.Arg259Trpp.R259WQ9P2B4protein_codingdeleterious(0)probably_damaging(0.965)TCGA-E2-A1IE-01Breastbreast invasive carcinomaFemale<65I/IIChemotherapydoxorubicinPD
CTTNBP2NLSNVMissense_Mutationc.1723N>Cp.Glu575Glnp.E575QQ9P2B4protein_codingdeleterious(0.01)probably_damaging(0.991)TCGA-GM-A2DH-01Breastbreast invasive carcinomaFemale<65I/IIChemotherapytaxolCR
CTTNBP2NLinsertionNonsense_Mutationnovelc.1053_1054insATTACATGGTCATTGTGCTTACAATGAAAAACAGTTTTCp.His351_Cys352insIleThrTrpSerLeuCysLeuGlnTerLysThrValPhep.H351_C352insITWSLCLQ*KTVFQ9P2B4protein_codingTCGA-AN-A0FX-01Breastbreast invasive carcinomaFemale<65I/IIUnknownUnknownSD
CTTNBP2NLinsertionNonsense_Mutationnovelc.1681_1682insTCGCTTGAACCCAGAAGGCGGAGGTTGCAGTGAGp.Pro561LeufsTer3p.P561Lfs*3Q9P2B4protein_codingTCGA-BH-A0B8-01Breastbreast invasive carcinomaFemale<65I/IIHormone TherapyarimidexSD
CTTNBP2NLinsertionNonsense_Mutationnovelc.1322_1323insCACCTCTTATCTAACTATATAAAAATGTATATTATTp.Ser441_Ala442insThrSerTyrLeuThrIleTerLysCysIleLeuLeup.S441_A442insTSYLTI*KCILLQ9P2B4protein_codingTCGA-BH-A0HK-01Breastbreast invasive carcinomaFemale>=65I/IIHormone TherapyarimidexSD
Page: 1 2 3 4 5 6 7 8 

Top

Related drugs of malignant transformation related genes

check buttonIdentification of chemicals and drugs interact with genes involved in malignant transfromation
(DGIdb 4.0)
Entrez IDSymbolCategoryInteraction TypesDrug Claim NameDrug NamePMIDs
Page: 1