
|
|||||
|
 | |
| |
| |
| |
| |
| |
|
Gene: CTTNBP2 |
Gene summary for CTTNBP2 |
| Gene information | Species | Human | Gene symbol | CTTNBP2 | Gene ID | 83992 |
| Gene name | cortactin binding protein 2 | |
| Gene Alias | C7orf8 | |
| Cytomap | 7q31.31 | |
| Gene Type | protein-coding | GO ID | GO:0007275 | UniProtAcc | Q20BG9 |
Top |
Malignant transformation analysis |
| Identification of the aberrant gene expression in precancerous and cancerous lesions by comparing the gene expression of stem-like cells in diseased tissues with normal stem cells |
| Entrez ID | Symbol | Replicates | Species | Organ | Tissue | Adj P-value | Log2FC | Malignancy |
| 83992 | CTTNBP2 | HTA11_1391_2000001011 | Human | Colorectum | AD | 3.59e-02 | 1.59e-01 | -0.059 |
| 83992 | CTTNBP2 | HTA11_866_3004761011 | Human | Colorectum | AD | 5.76e-03 | 1.72e-01 | 0.096 |
| 83992 | CTTNBP2 | HTA11_99999970781_79442 | Human | Colorectum | MSS | 7.68e-04 | 1.91e-01 | 0.294 |
| 83992 | CTTNBP2 | HTA11_99999971662_82457 | Human | Colorectum | MSS | 6.24e-13 | 4.38e-01 | 0.3859 |
| 83992 | CTTNBP2 | HTA11_99999973899_84307 | Human | Colorectum | MSS | 1.33e-03 | 3.06e-01 | 0.2585 |
| 83992 | CTTNBP2 | HTA11_99999974143_84620 | Human | Colorectum | MSS | 8.85e-04 | 2.01e-01 | 0.3005 |
| 83992 | CTTNBP2 | A002-C-021 | Human | Colorectum | FAP | 1.13e-10 | 3.40e-01 | 0.1171 |
| 83992 | CTTNBP2 | A001-C-104 | Human | Colorectum | FAP | 2.61e-05 | 2.54e-01 | 0.0184 |
| 83992 | CTTNBP2 | A001-C-007 | Human | Colorectum | CRC | 1.62e-10 | 6.04e-01 | 0.1899 |
| 83992 | CTTNBP2 | CRC-1-8810 | Human | Colorectum | CRC | 1.93e-18 | 5.91e-01 | 0.6257 |
| 83992 | CTTNBP2 | HCC2_Meng | Human | Liver | HCC | 2.49e-08 | 1.42e-02 | 0.0107 |
| 83992 | CTTNBP2 | cirrhotic1 | Human | Liver | Cirrhotic | 1.74e-03 | 1.06e-01 | 0.0202 |
| 83992 | CTTNBP2 | cirrhotic2 | Human | Liver | Cirrhotic | 1.42e-04 | 1.03e-01 | 0.0201 |
| 83992 | CTTNBP2 | S027 | Human | Liver | HCC | 1.61e-15 | 1.14e+00 | 0.2446 |
| 83992 | CTTNBP2 | S028 | Human | Liver | HCC | 3.28e-41 | 1.80e+00 | 0.2503 |
| 83992 | CTTNBP2 | S029 | Human | Liver | HCC | 1.34e-26 | 1.37e+00 | 0.2581 |
| 83992 | CTTNBP2 | PTC01 | Human | Thyroid | PTC | 4.79e-02 | 1.57e-02 | 0.1899 |
| 83992 | CTTNBP2 | PTC05 | Human | Thyroid | PTC | 2.22e-08 | 4.88e-01 | 0.2065 |
| 83992 | CTTNBP2 | PTC06 | Human | Thyroid | PTC | 9.47e-06 | 1.67e-01 | 0.2057 |
| 83992 | CTTNBP2 | PTC07 | Human | Thyroid | PTC | 2.47e-11 | 6.53e-02 | 0.2044 |
| Page: 1 2 |
| Tissue | Expression Dynamics | Abbreviation |
| Colorectum (GSE201348) |  | FAP: Familial adenomatous polyposis |
| CRC: Colorectal cancer | ||
| Colorectum (HTA11) |  | AD: Adenomas |
| SER: Sessile serrated lesions | ||
| MSI-H: Microsatellite-high colorectal cancer | ||
| MSS: Microsatellite stable colorectal cancer | ||
| Liver |  | HCC: Hepatocellular carcinoma |
| NAFLD: Non-alcoholic fatty liver disease | ||
| Thyroid | 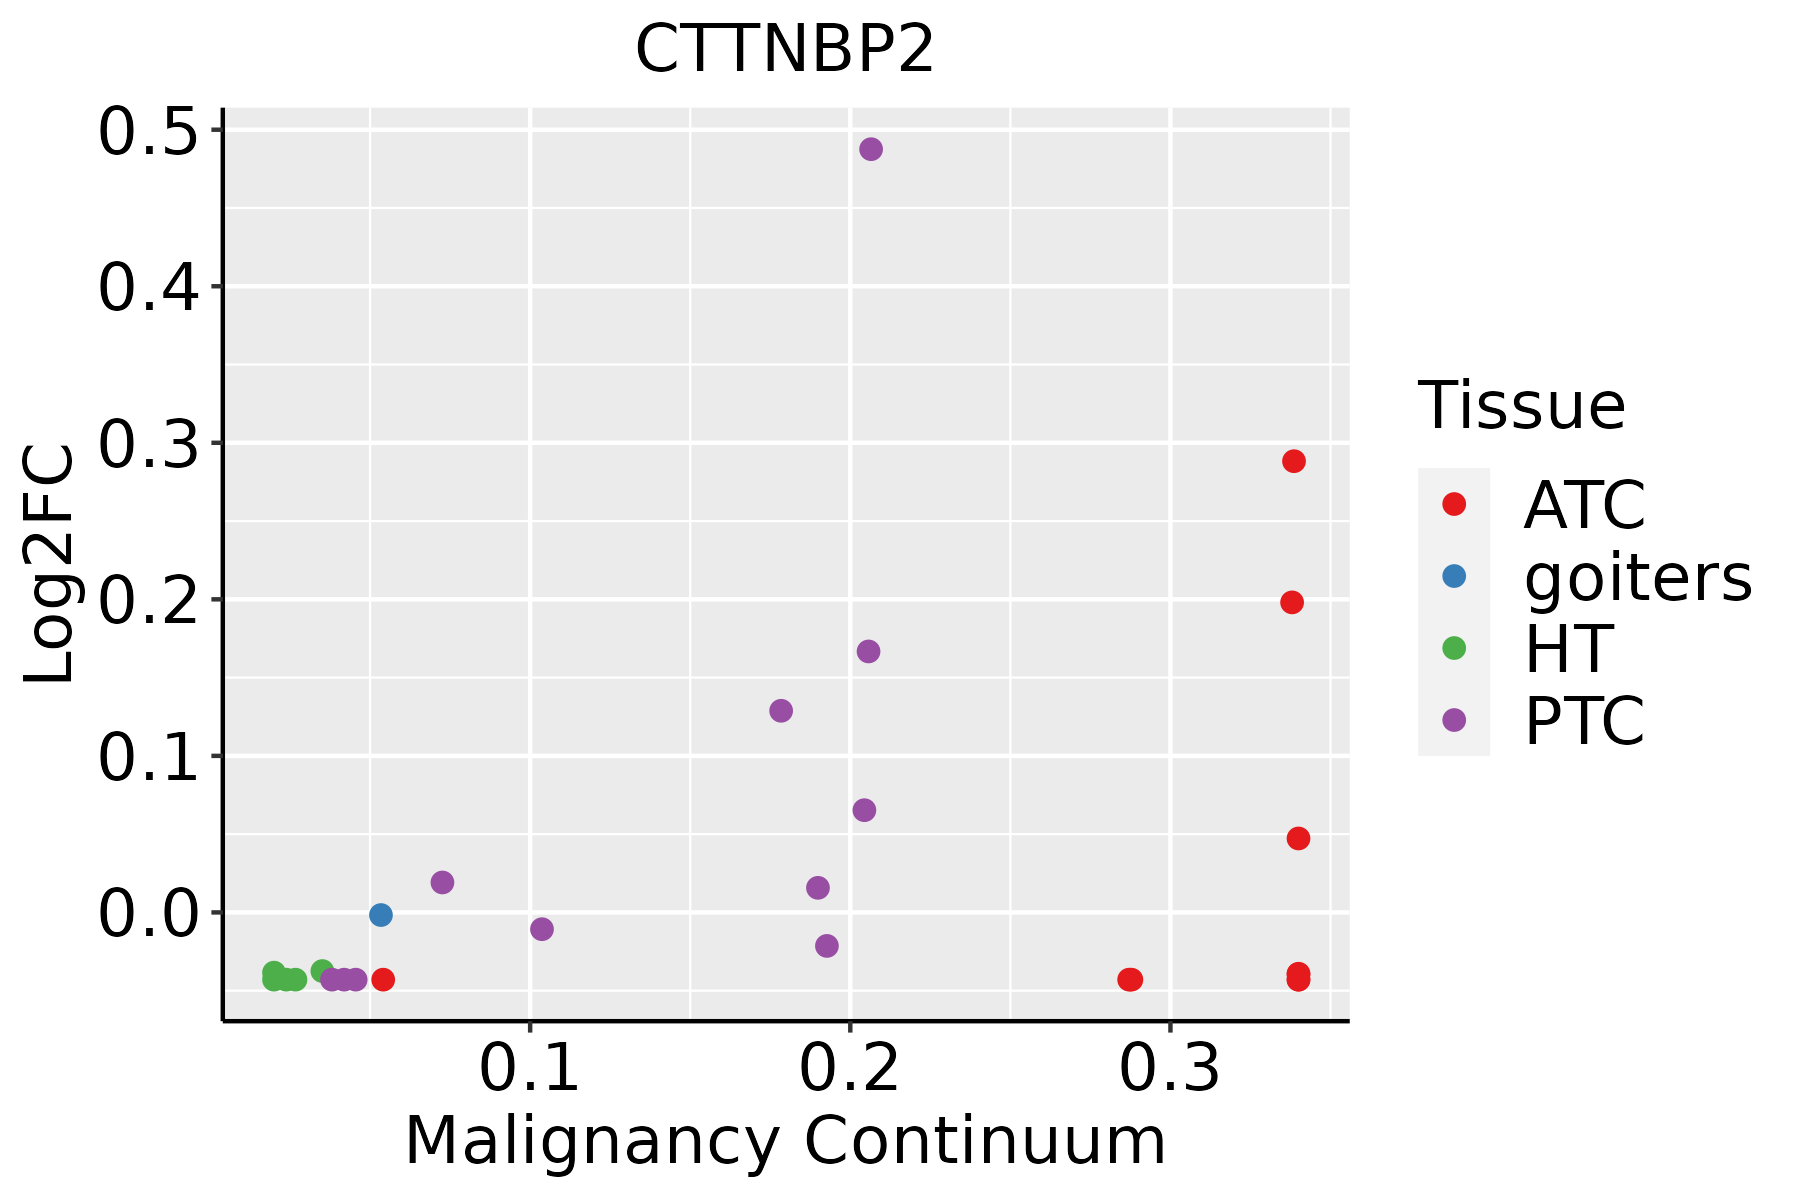 | ATC: Anaplastic thyroid cancer |
| HT: Hashimoto's thyroiditis | ||
| PTC: Papillary thyroid cancer |
| ∗log2FC in expression of this searched gene in stem-like cells from each diseased tissue sample relative to stem-like cells in normal samples in each tissue plotted against the malignancy continuum. Samples are colored based on if they are from different disease stage. |
Top |
Malignant transformation related pathway analysis |
| Find out the enriched GO biological processes and KEGG pathways involved in transition from healthy to precancer to cancer |
| Tissue | Disease Stage | Enriched GO biological Processes |
| Colorectum | AD |  |
| Colorectum | SER |  |
| Colorectum | MSS |  |
| Colorectum | MSI-H |  |
| Colorectum | FAP |  |
| ∗Top 15 enriched GO BP terms are showed in the bar plot of each disease state in each tissue. Each row represents a significant GO biological process which is colored according to the -log10(p.adjust). |
| Page: 1 2 3 4 5 6 7 8 9 |
| GO ID | Tissue | Disease Stage | Description | Gene Ratio | Bg Ratio | pvalue | p.adjust | Count |
| GO:0016311 | Colorectum | AD | dephosphorylation | 123/3918 | 417/18723 | 1.84e-05 | 3.82e-04 | 123 |
| GO:0006470 | Colorectum | AD | protein dephosphorylation | 88/3918 | 281/18723 | 2.56e-05 | 4.89e-04 | 88 |
| GO:0099010 | Colorectum | AD | modification of postsynaptic structure | 9/3918 | 16/18723 | 2.06e-03 | 1.64e-02 | 9 |
| GO:0099563 | Colorectum | AD | modification of synaptic structure | 11/3918 | 22/18723 | 2.32e-03 | 1.80e-02 | 11 |
| GO:0050808 | Colorectum | AD | synapse organization | 112/3918 | 426/18723 | 4.25e-03 | 2.92e-02 | 112 |
| GO:0050807 | Colorectum | AD | regulation of synapse organization | 60/3918 | 211/18723 | 5.67e-03 | 3.64e-02 | 60 |
| GO:00064701 | Colorectum | SER | protein dephosphorylation | 65/2897 | 281/18723 | 4.44e-04 | 6.51e-03 | 65 |
| GO:0051051 | Colorectum | SER | negative regulation of transport | 98/2897 | 470/18723 | 1.01e-03 | 1.19e-02 | 98 |
| GO:00163111 | Colorectum | SER | dephosphorylation | 86/2897 | 417/18723 | 2.73e-03 | 2.46e-02 | 86 |
| GO:0032409 | Colorectum | SER | regulation of transporter activity | 65/2897 | 310/18723 | 5.71e-03 | 4.19e-02 | 65 |
| GO:00064702 | Colorectum | MSS | protein dephosphorylation | 73/3467 | 281/18723 | 1.15e-03 | 1.12e-02 | 73 |
| GO:00163112 | Colorectum | MSS | dephosphorylation | 101/3467 | 417/18723 | 1.98e-03 | 1.70e-02 | 101 |
| GO:00324091 | Colorectum | MSS | regulation of transporter activity | 78/3467 | 310/18723 | 2.09e-03 | 1.78e-02 | 78 |
| GO:00508082 | Colorectum | MSS | synapse organization | 101/3467 | 426/18723 | 3.96e-03 | 2.89e-02 | 101 |
| GO:00510511 | Colorectum | MSS | negative regulation of transport | 110/3467 | 470/18723 | 4.20e-03 | 3.04e-02 | 110 |
| GO:00163113 | Colorectum | FAP | dephosphorylation | 95/2622 | 417/18723 | 7.07e-07 | 3.32e-05 | 95 |
| GO:00064704 | Colorectum | FAP | protein dephosphorylation | 69/2622 | 281/18723 | 1.47e-06 | 6.39e-05 | 69 |
| GO:00508083 | Colorectum | FAP | synapse organization | 91/2622 | 426/18723 | 1.90e-05 | 4.74e-04 | 91 |
| GO:00995631 | Colorectum | FAP | modification of synaptic structure | 11/2622 | 22/18723 | 6.30e-05 | 1.22e-03 | 11 |
| GO:00990101 | Colorectum | FAP | modification of postsynaptic structure | 9/2622 | 16/18723 | 9.19e-05 | 1.59e-03 | 9 |
| Page: 1 2 3 4 |
| Pathway ID | Tissue | Disease Stage | Description | Gene Ratio | Bg Ratio | pvalue | p.adjust | qvalue | Count |
| Page: 1 |
Top |
Cell-cell communication analysis |
| Identification of potential cell-cell interactions between two cell types and their ligand-receptor pairs for different disease states |
| Ligand | Receptor | LRpair | Pathway | Tissue | Disease Stage |
| Page: 1 |
Top |
Single-cell gene regulatory network inference analysis |
| Find out the significant the regulons (TFs) and the target genes of each regulon across cell types for different disease states |
| TF | Cell Type | Tissue | Disease Stage | Target Gene | RSS | Regulon Activity |
| ∗The dot plots of a searched regulon are shown for all cell subpopulations in each disease state of each tissue based on the regulon specific score inferred using pySCENIC and by calculating the average expression. |
| Page: 1 |
Top |
Somatic mutation of malignant transformation related genes |
| Annotation of somatic variants for genes involved in malignant transformation |
| Hugo Symbol | Variant Class | Variant Classification | dbSNP RS | HGVSc | HGVSp | HGVSp Short | SWISSPROT | BIOTYPE | SIFT | PolyPhen | Tumor Sample Barcode | Tissue | Histology | Sex | Age | Stage | Therapy Types | Drugs | Outcome |
| CTTNBP2 | SNV | Missense_Mutation | novel | c.1842N>C | p.Lys614Asn | p.K614N | Q8WZ74 | protein_coding | deleterious(0) | probably_damaging(0.997) | TCGA-A2-A0CS-01 | Breast | breast invasive carcinoma | Female | >=65 | III/IV | Hormone Therapy | anastrozole | SD |
| CTTNBP2 | SNV | Missense_Mutation | novel | c.1199N>A | p.Pro400Gln | p.P400Q | Q8WZ74 | protein_coding | tolerated(0.13) | benign(0.01) | TCGA-A7-A0DB-01 | Breast | breast invasive carcinoma | Female | <65 | I/II | Hormone Therapy | arimidex | SD |
| CTTNBP2 | SNV | Missense_Mutation | c.3128C>A | p.Ser1043Tyr | p.S1043Y | Q8WZ74 | protein_coding | tolerated(0.53) | benign(0.299) | TCGA-A8-A09Q-01 | Breast | breast invasive carcinoma | Female | >=65 | III/IV | Hormone Therapy | anastrozole | SD | |
| CTTNBP2 | SNV | Missense_Mutation | rs781254525 | c.4081G>A | p.Val1361Ile | p.V1361I | Q8WZ74 | protein_coding | tolerated(0.19) | benign(0.01) | TCGA-AC-A5EH-01 | Breast | breast invasive carcinoma | Female | >=65 | I/II | Unknown | Unknown | SD |
| CTTNBP2 | SNV | Missense_Mutation | novel | c.1949N>A | p.Ala650Glu | p.A650E | Q8WZ74 | protein_coding | deleterious(0) | probably_damaging(0.998) | TCGA-AN-A03X-01 | Breast | breast invasive carcinoma | Female | >=65 | I/II | Unknown | Unknown | SD |
| CTTNBP2 | SNV | Missense_Mutation | c.1259C>T | p.Ser420Leu | p.S420L | Q8WZ74 | protein_coding | deleterious(0.03) | benign(0.001) | TCGA-AN-A046-01 | Breast | breast invasive carcinoma | Female | >=65 | I/II | Unknown | Unknown | SD | |
| CTTNBP2 | SNV | Missense_Mutation | c.2459A>G | p.Asn820Ser | p.N820S | Q8WZ74 | protein_coding | tolerated(0.37) | possibly_damaging(0.478) | TCGA-BH-A0BR-01 | Breast | breast invasive carcinoma | Female | <65 | I/II | Unknown | Unknown | SD | |
| CTTNBP2 | SNV | Missense_Mutation | novel | c.1997C>G | p.Ser666Cys | p.S666C | Q8WZ74 | protein_coding | deleterious(0.05) | benign(0.027) | TCGA-BH-A2L8-01 | Breast | breast invasive carcinoma | Female | <65 | I/II | Chemotherapy | cytoxan | CR |
| CTTNBP2 | SNV | Missense_Mutation | rs370017291 | c.924N>C | p.Gln308His | p.Q308H | Q8WZ74 | protein_coding | deleterious(0) | probably_damaging(0.998) | TCGA-D8-A1JA-01 | Breast | breast invasive carcinoma | Female | <65 | III/IV | Chemotherapy | adriamycin | PD |
| CTTNBP2 | SNV | Missense_Mutation | novel | c.1842A>C | p.Lys614Asn | p.K614N | Q8WZ74 | protein_coding | deleterious(0) | probably_damaging(0.997) | TCGA-D8-A1JT-01 | Breast | breast invasive carcinoma | Female | >=65 | I/II | Hormone Therapy | arimidex | SD |
| Page: 1 2 3 4 5 6 7 8 9 10 11 12 13 14 15 16 17 18 19 20 |
Top |
Related drugs of malignant transformation related genes |
| Identification of chemicals and drugs interact with genes involved in malignant transfromation |
| (DGIdb 4.0) |
| Entrez ID | Symbol | Category | Interaction Types | Drug Claim Name | Drug Name | PMIDs |
| Page: 1 |

Copyright 2023-Present -The University of Texas Health Science Center at Houston |