
|
|||||
|
 | |
| |
| |
| |
| |
| |
|
Gene: CTTN |
Gene summary for CTTN |
| Gene information | Species | Human | Gene symbol | CTTN | Gene ID | 2017 |
| Gene name | cortactin | |
| Gene Alias | EMS1 | |
| Cytomap | 11q13.3 | |
| Gene Type | protein-coding | GO ID | GO:0000422 | UniProtAcc | Q14247 |
Top |
Malignant transformation analysis |
| Identification of the aberrant gene expression in precancerous and cancerous lesions by comparing the gene expression of stem-like cells in diseased tissues with normal stem cells |
| Entrez ID | Symbol | Replicates | Species | Organ | Tissue | Adj P-value | Log2FC | Malignancy |
| 2017 | CTTN | GSM4909285 | Human | Breast | IDC | 5.72e-05 | -2.84e-01 | 0.21 |
| 2017 | CTTN | GSM4909294 | Human | Breast | IDC | 2.84e-03 | -2.13e-01 | 0.2022 |
| 2017 | CTTN | GSM4909296 | Human | Breast | IDC | 1.99e-13 | -3.45e-01 | 0.1524 |
| 2017 | CTTN | GSM4909297 | Human | Breast | IDC | 4.52e-54 | 8.90e-01 | 0.1517 |
| 2017 | CTTN | GSM4909304 | Human | Breast | IDC | 4.59e-04 | 2.73e-01 | 0.1636 |
| 2017 | CTTN | GSM4909311 | Human | Breast | IDC | 1.17e-26 | -2.26e-01 | 0.1534 |
| 2017 | CTTN | GSM4909312 | Human | Breast | IDC | 9.97e-09 | -9.52e-02 | 0.1552 |
| 2017 | CTTN | GSM4909313 | Human | Breast | IDC | 1.78e-03 | 1.60e-01 | 0.0391 |
| 2017 | CTTN | GSM4909319 | Human | Breast | IDC | 1.06e-28 | -3.54e-01 | 0.1563 |
| 2017 | CTTN | GSM4909320 | Human | Breast | IDC | 3.44e-03 | -3.29e-01 | 0.1575 |
| 2017 | CTTN | GSM4909321 | Human | Breast | IDC | 1.01e-11 | -2.11e-01 | 0.1559 |
| 2017 | CTTN | ctrl6 | Human | Breast | Precancer | 1.45e-08 | 5.55e-01 | -0.0061 |
| 2017 | CTTN | brca1 | Human | Breast | Precancer | 2.47e-02 | -2.01e-01 | -0.0338 |
| 2017 | CTTN | brca2 | Human | Breast | Precancer | 3.43e-04 | 3.13e-01 | -0.024 |
| 2017 | CTTN | brca10 | Human | Breast | Precancer | 3.22e-10 | 4.68e-01 | -0.0029 |
| 2017 | CTTN | M5 | Human | Breast | IDC | 4.39e-05 | 6.52e-01 | 0.1598 |
| 2017 | CTTN | NCCBC14 | Human | Breast | DCIS | 3.12e-07 | -3.79e-02 | 0.2021 |
| 2017 | CTTN | NCCBC2 | Human | Breast | DCIS | 3.26e-05 | 1.93e-01 | 0.1554 |
| 2017 | CTTN | NCCBC3 | Human | Breast | DCIS | 1.67e-03 | -1.90e-01 | 0.1198 |
| 2017 | CTTN | NCCBC5 | Human | Breast | DCIS | 2.95e-14 | 1.93e-01 | 0.2046 |
| Page: 1 2 3 4 5 6 7 8 9 10 |
| Tissue | Expression Dynamics | Abbreviation |
| Breast | 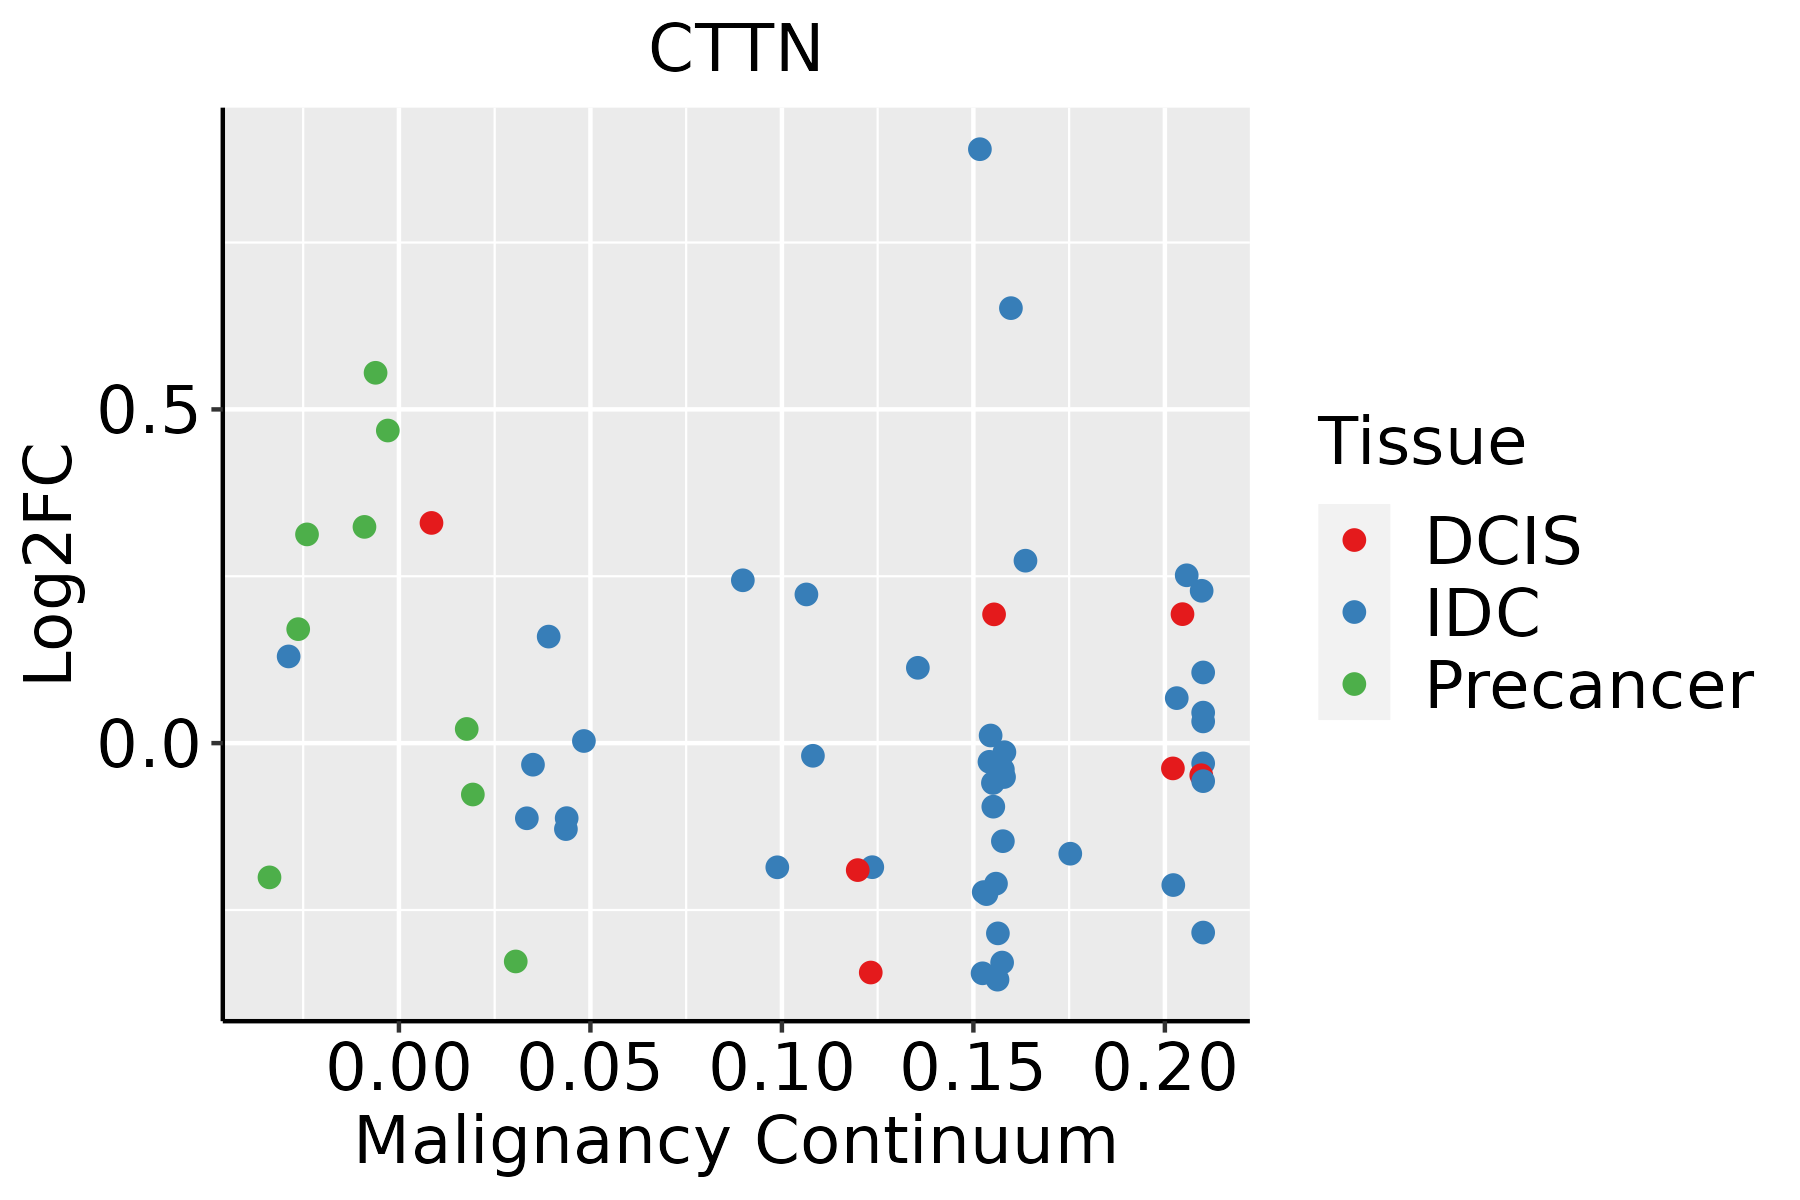 | IDC: Invasive ductal carcinoma |
| DCIS: Ductal carcinoma in situ | ||
| Precancer(BRCA1-mut): Precancerous lesion from BRCA1 mutation carriers | ||
| Colorectum (GSE201348) |  | FAP: Familial adenomatous polyposis |
| CRC: Colorectal cancer | ||
| Colorectum (HTA11) | 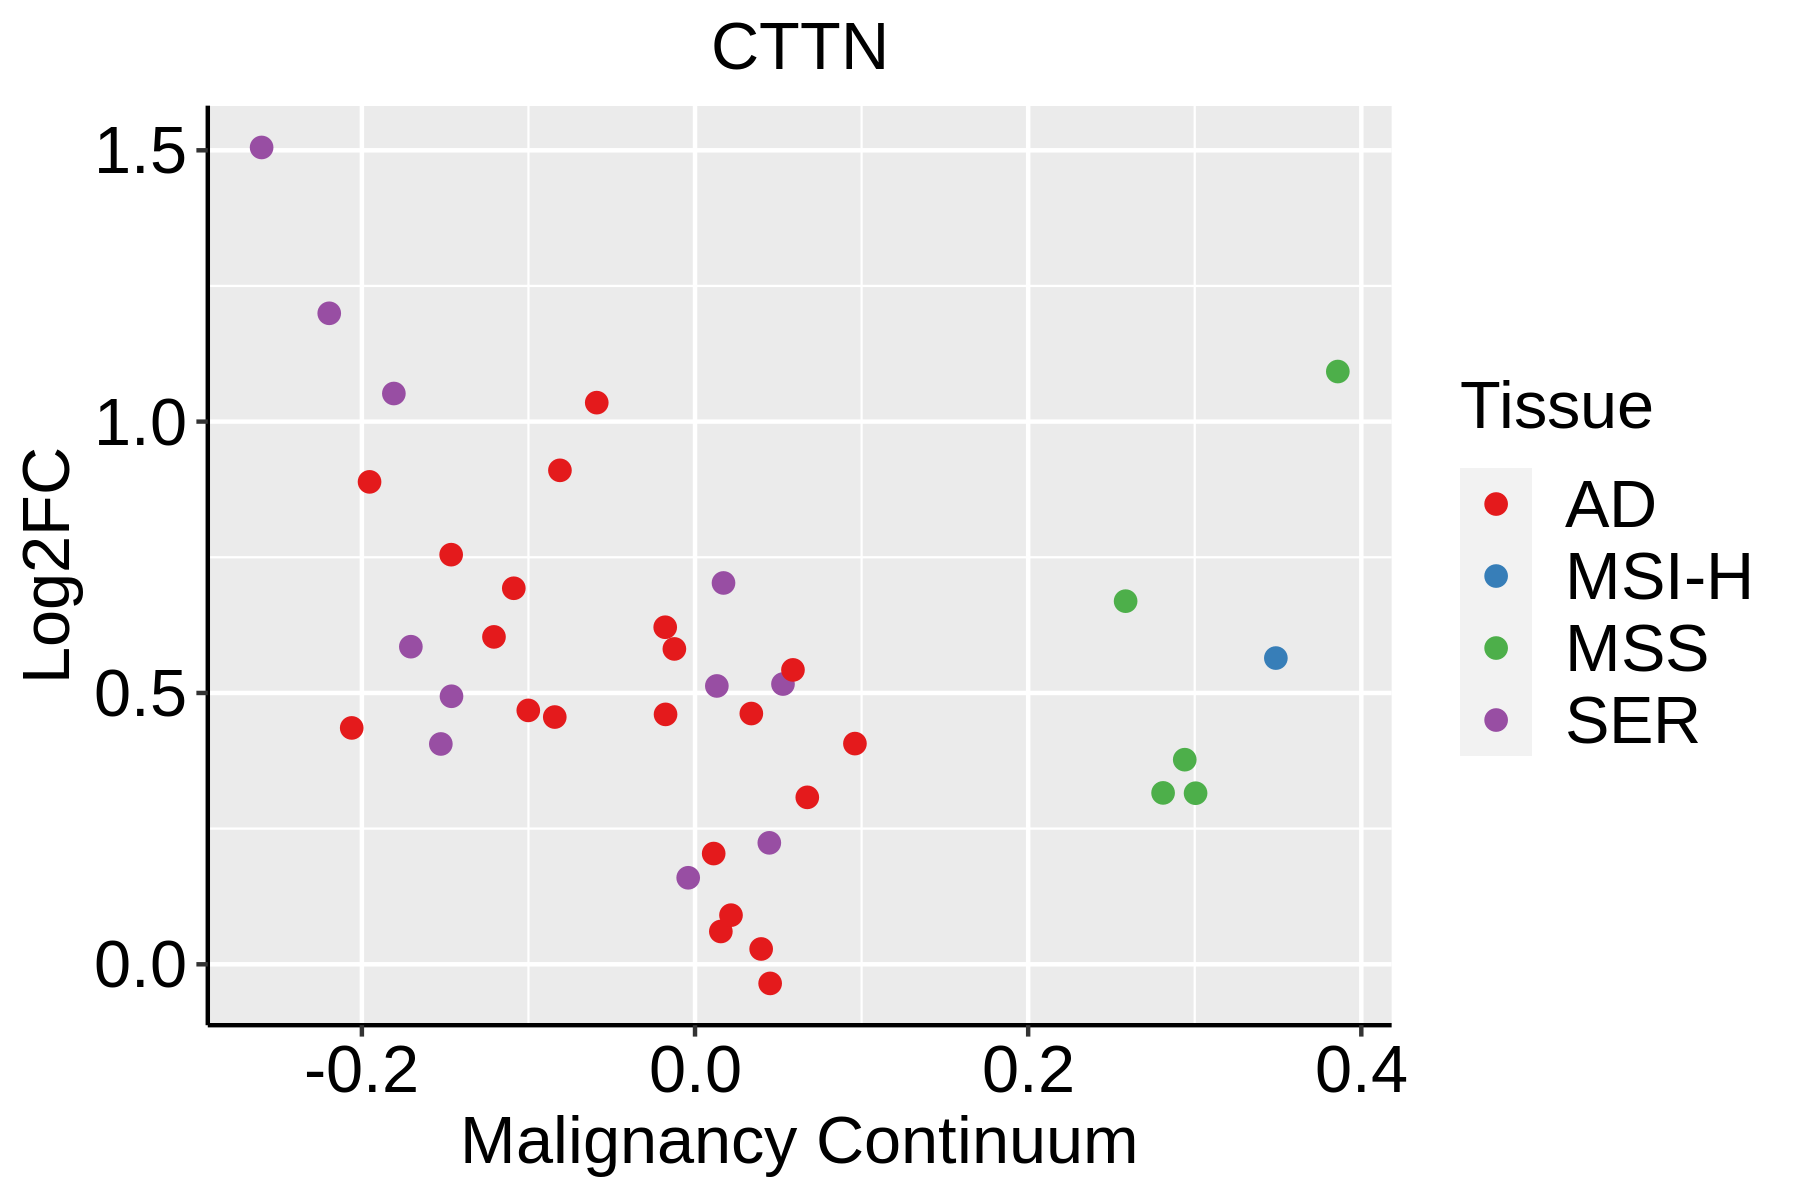 | AD: Adenomas |
| SER: Sessile serrated lesions | ||
| MSI-H: Microsatellite-high colorectal cancer | ||
| MSS: Microsatellite stable colorectal cancer | ||
| Esophagus |  | ESCC: Esophageal squamous cell carcinoma |
| HGIN: High-grade intraepithelial neoplasias | ||
| LGIN: Low-grade intraepithelial neoplasias | ||
| Liver | 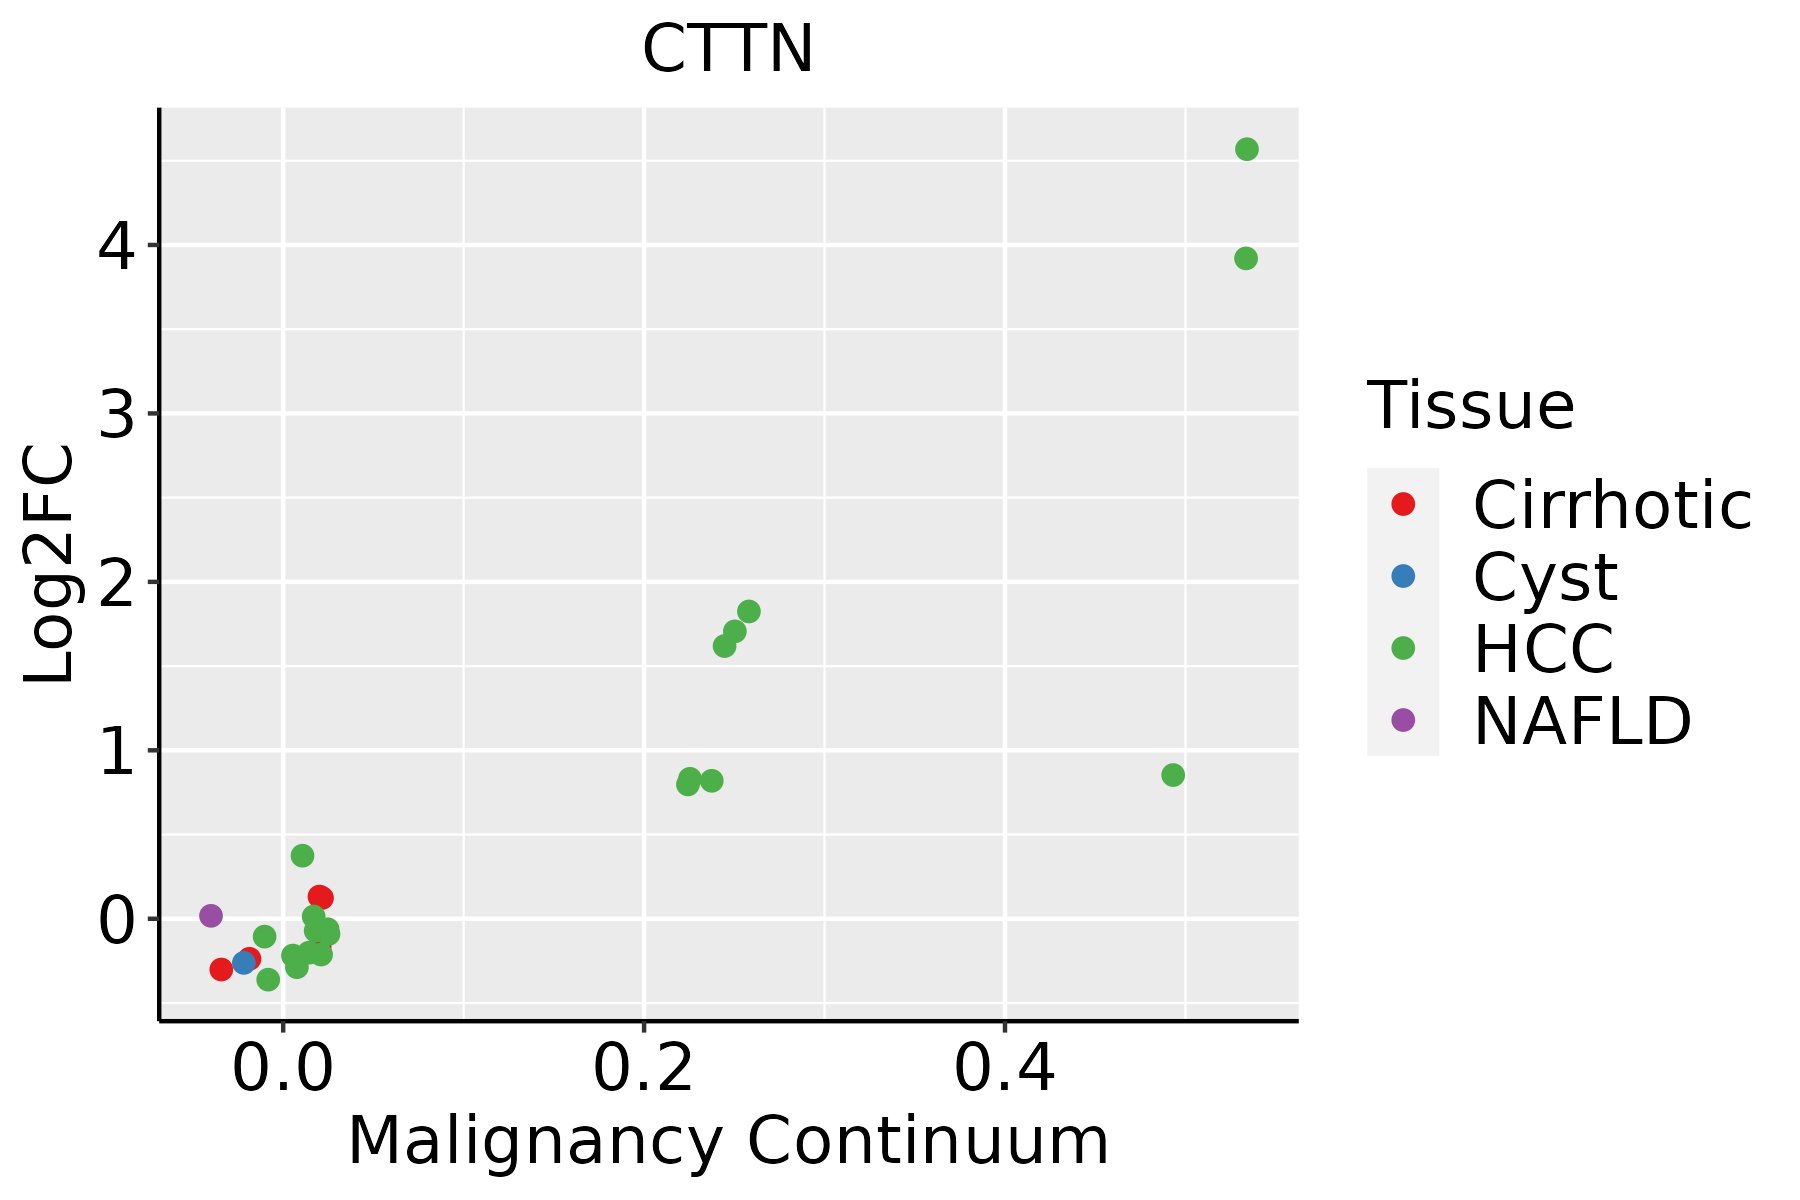 | HCC: Hepatocellular carcinoma |
| NAFLD: Non-alcoholic fatty liver disease | ||
| Lung | 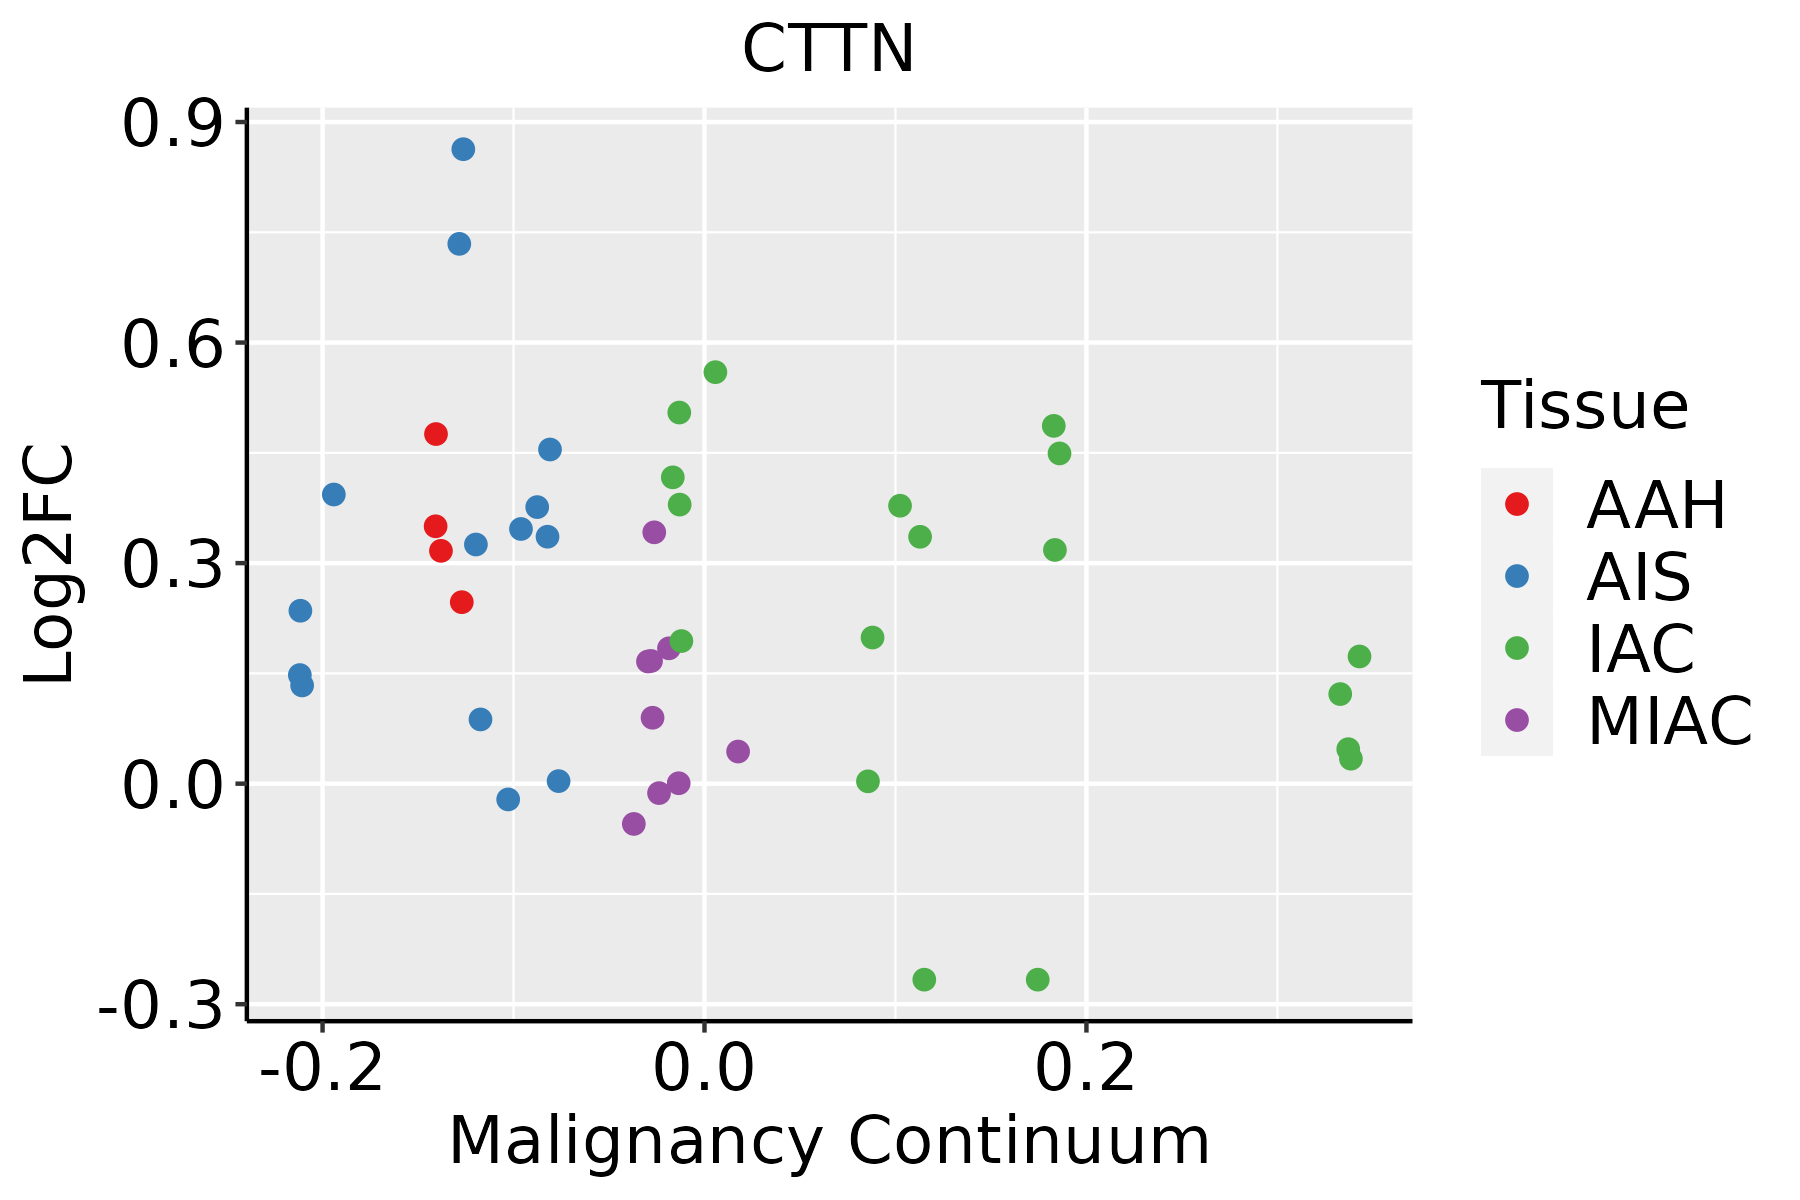 | AAH: Atypical adenomatous hyperplasia |
| AIS: Adenocarcinoma in situ | ||
| IAC: Invasive lung adenocarcinoma | ||
| MIA: Minimally invasive adenocarcinoma | ||
| Oral Cavity | 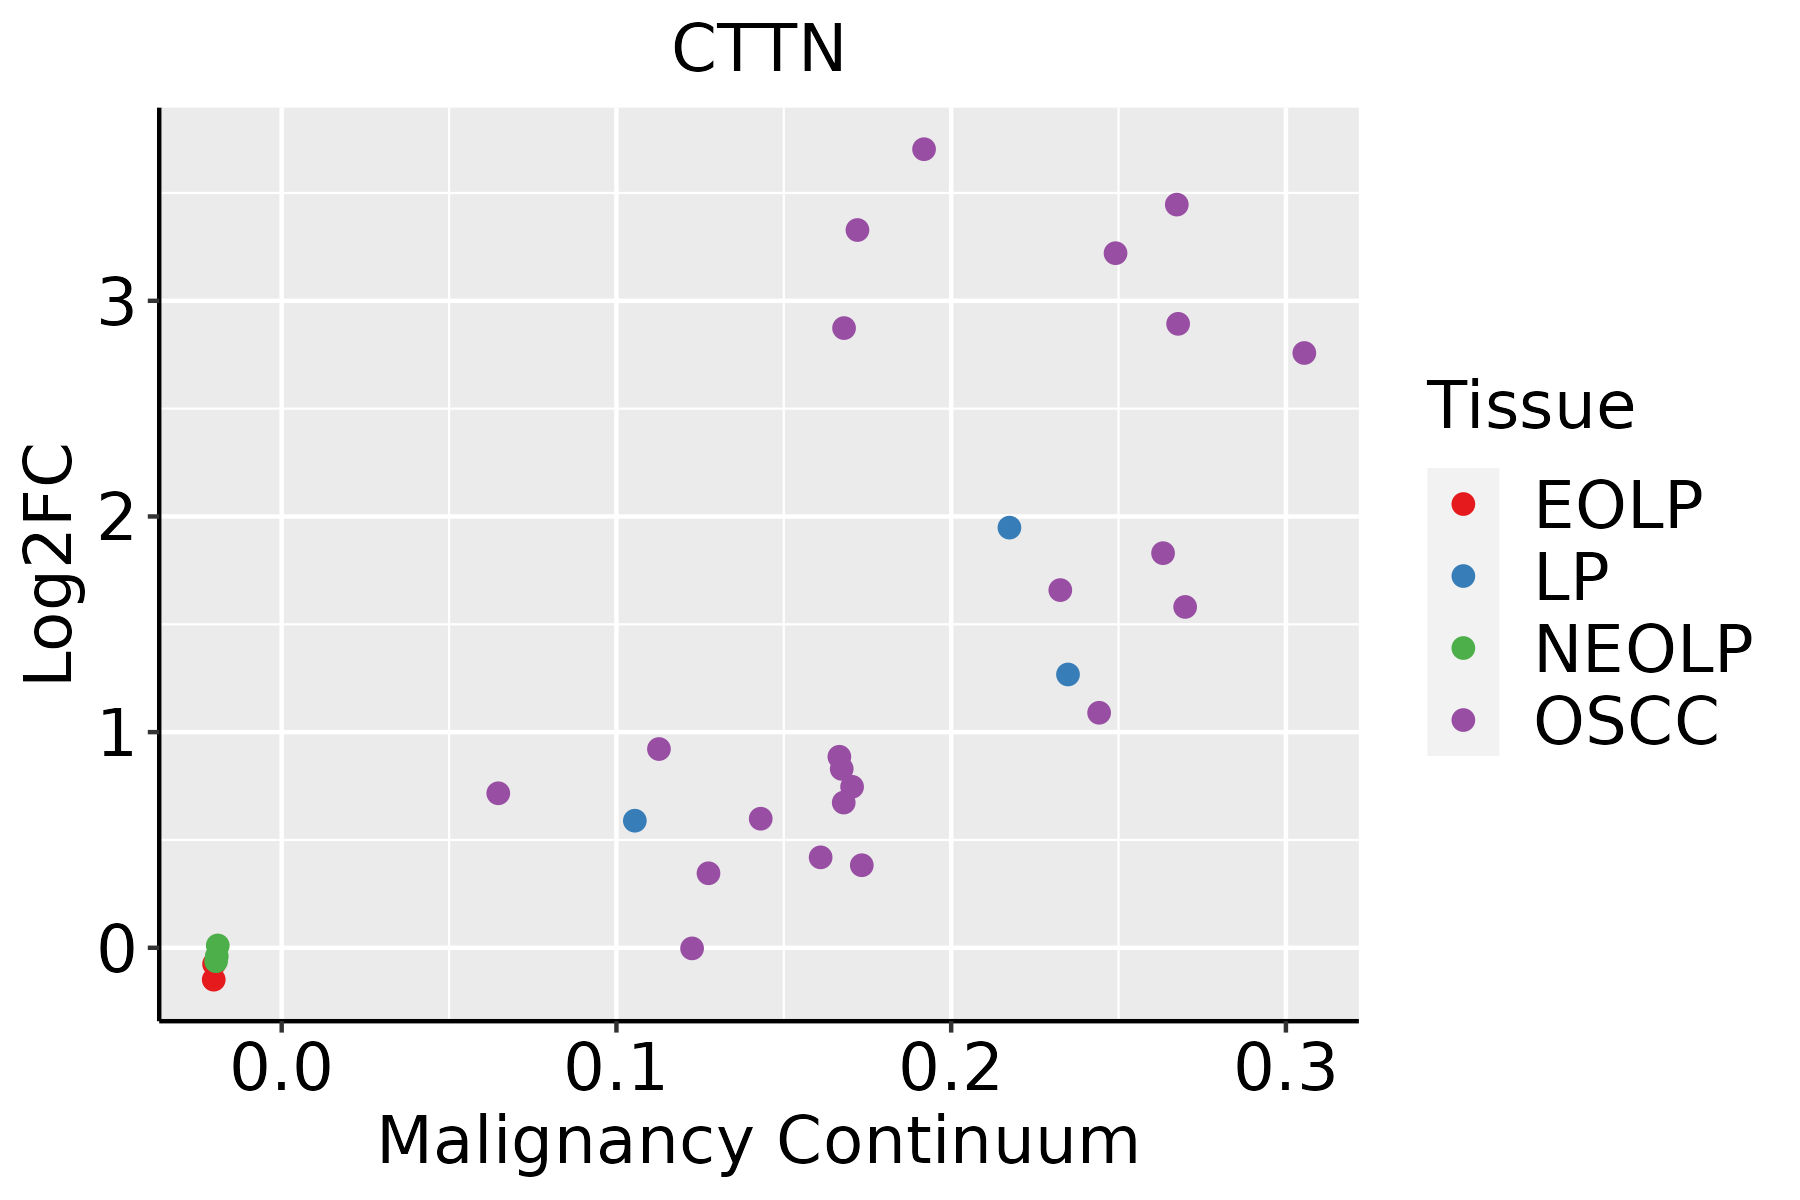 | EOLP: Erosive Oral lichen planus |
| LP: leukoplakia | ||
| NEOLP: Non-erosive oral lichen planus | ||
| OSCC: Oral squamous cell carcinoma | ||
| Skin | 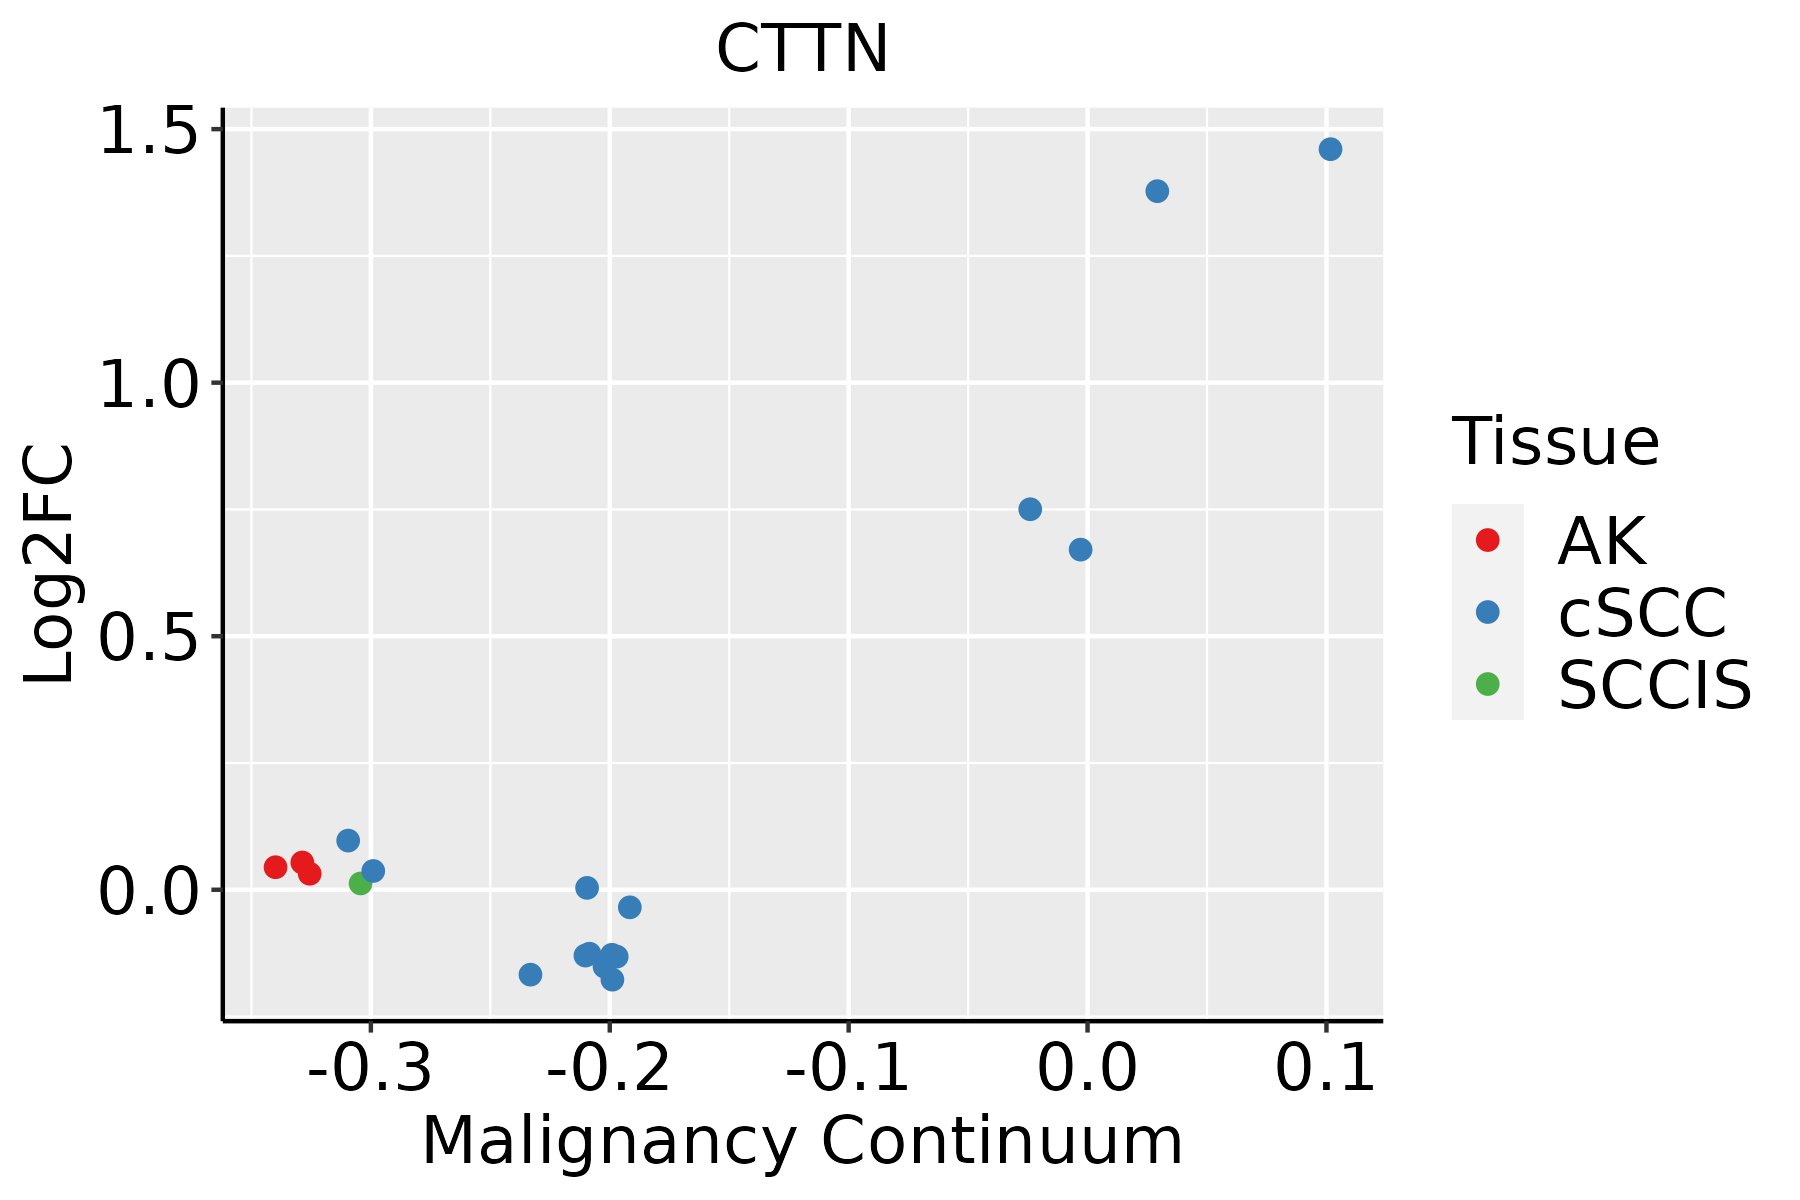 | AK: Actinic keratosis |
| cSCC: Cutaneous squamous cell carcinoma | ||
| SCCIS:squamous cell carcinoma in situ | ||
| Thyroid | 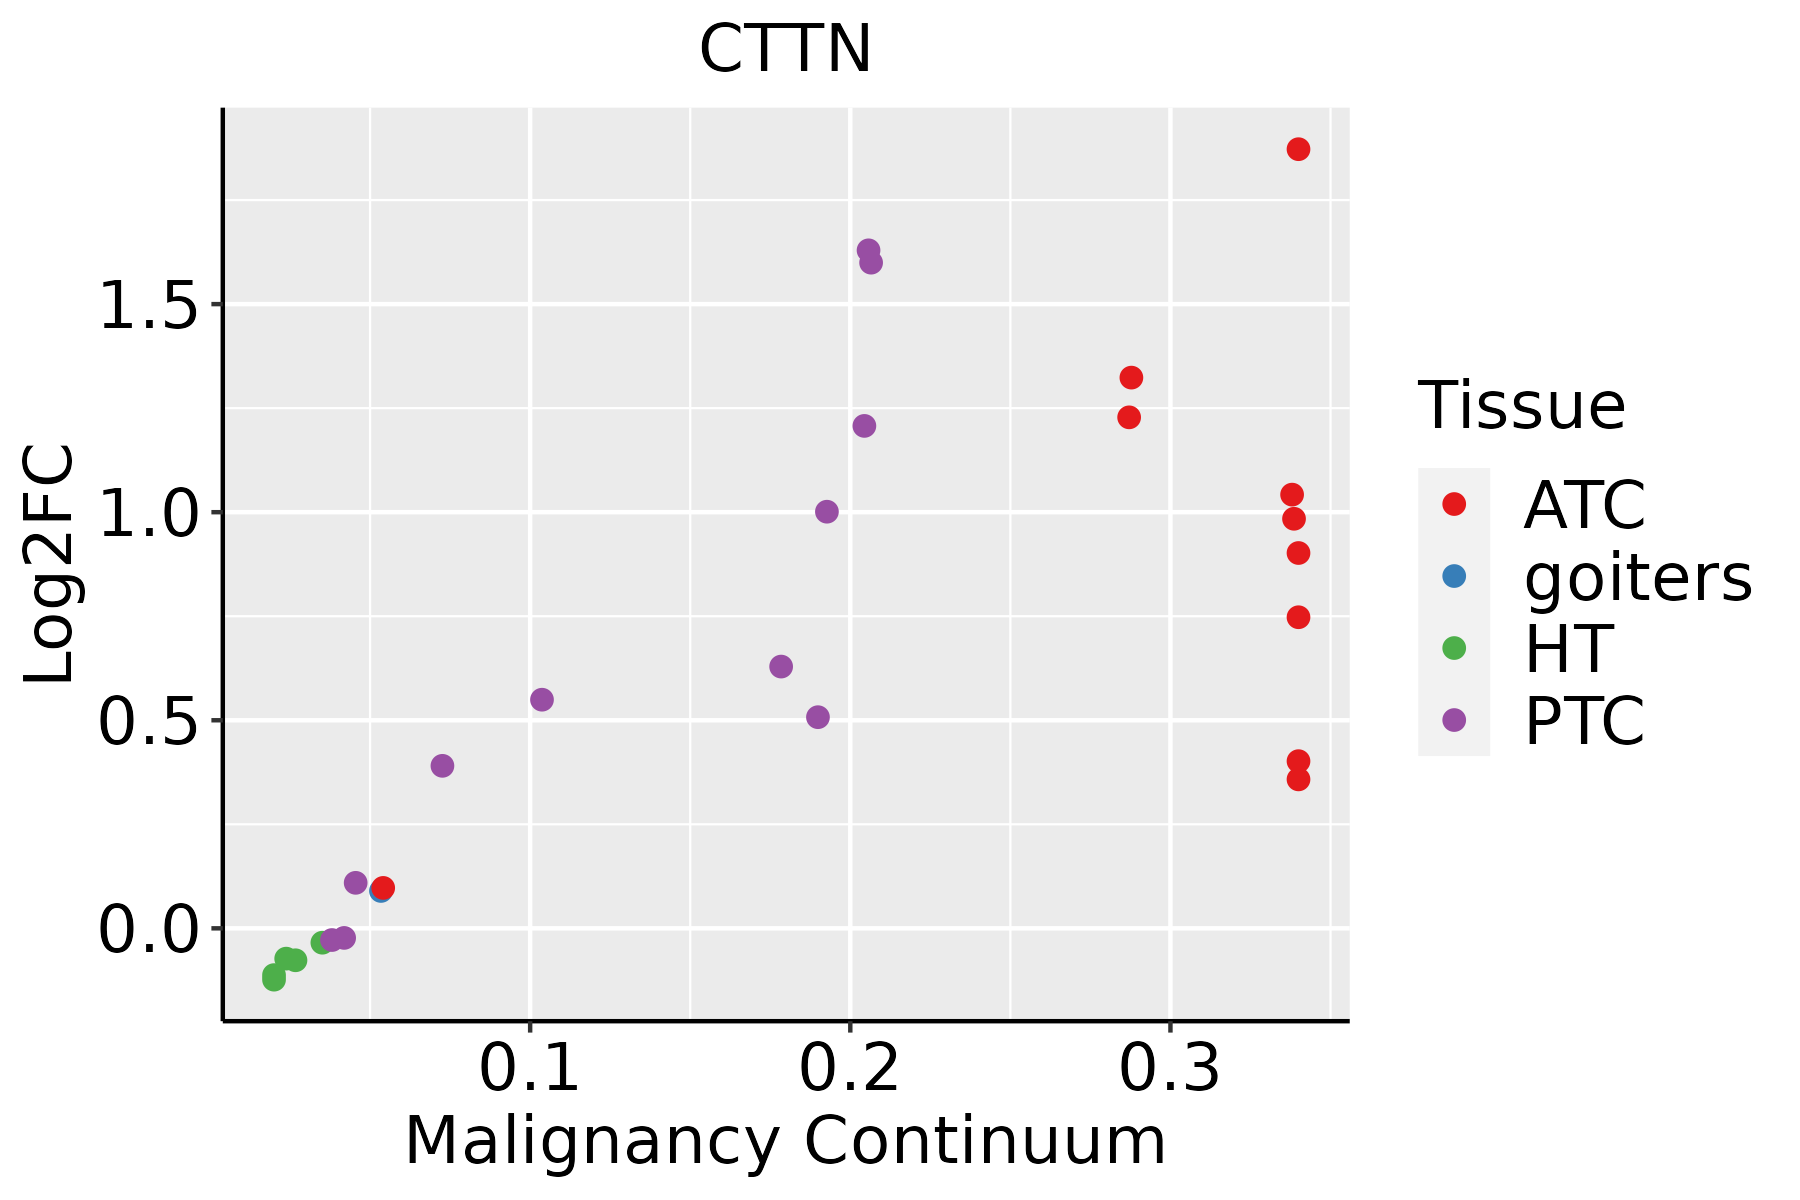 | ATC: Anaplastic thyroid cancer |
| HT: Hashimoto's thyroiditis | ||
| PTC: Papillary thyroid cancer |
| ∗log2FC in expression of this searched gene in stem-like cells from each diseased tissue sample relative to stem-like cells in normal samples in each tissue plotted against the malignancy continuum. Samples are colored based on if they are from different disease stage. |
Top |
Malignant transformation related pathway analysis |
| Find out the enriched GO biological processes and KEGG pathways involved in transition from healthy to precancer to cancer |
| Tissue | Disease Stage | Enriched GO biological Processes |
| Colorectum | AD |  |
| Colorectum | SER |  |
| Colorectum | MSS |  |
| Colorectum | MSI-H |  |
| Colorectum | FAP |  |
| ∗Top 15 enriched GO BP terms are showed in the bar plot of each disease state in each tissue. Each row represents a significant GO biological process which is colored according to the -log10(p.adjust). |
| Page: 1 2 3 4 5 6 7 8 9 |
| GO ID | Tissue | Disease Stage | Description | Gene Ratio | Bg Ratio | pvalue | p.adjust | Count |
| GO:20012339 | Breast | Precancer | regulation of apoptotic signaling pathway | 65/1080 | 356/18723 | 7.70e-17 | 3.17e-14 | 65 |
| GO:20012349 | Breast | Precancer | negative regulation of apoptotic signaling pathway | 39/1080 | 224/18723 | 5.35e-10 | 4.77e-08 | 39 |
| GO:00432549 | Breast | Precancer | regulation of protein-containing complex assembly | 50/1080 | 428/18723 | 1.63e-06 | 5.97e-05 | 50 |
| GO:00313349 | Breast | Precancer | positive regulation of protein-containing complex assembly | 33/1080 | 237/18723 | 2.39e-06 | 8.21e-05 | 33 |
| GO:20012369 | Breast | Precancer | regulation of extrinsic apoptotic signaling pathway | 24/1080 | 151/18723 | 5.78e-06 | 1.70e-04 | 24 |
| GO:00971919 | Breast | Precancer | extrinsic apoptotic signaling pathway | 30/1080 | 219/18723 | 9.42e-06 | 2.50e-04 | 30 |
| GO:19029059 | Breast | Precancer | positive regulation of supramolecular fiber organization | 28/1080 | 209/18723 | 2.79e-05 | 6.28e-04 | 28 |
| GO:19029039 | Breast | Precancer | regulation of supramolecular fiber organization | 42/1080 | 383/18723 | 4.92e-05 | 1.04e-03 | 42 |
| GO:00329709 | Breast | Precancer | regulation of actin filament-based process | 42/1080 | 397/18723 | 1.11e-04 | 2.01e-03 | 42 |
| GO:00514959 | Breast | Precancer | positive regulation of cytoskeleton organization | 28/1080 | 226/18723 | 1.13e-04 | 2.04e-03 | 28 |
| GO:20012379 | Breast | Precancer | negative regulation of extrinsic apoptotic signaling pathway | 16/1080 | 97/18723 | 1.29e-04 | 2.24e-03 | 16 |
| GO:00004226 | Breast | Precancer | autophagy of mitochondrion | 14/1080 | 81/18723 | 2.01e-04 | 3.16e-03 | 14 |
| GO:00617266 | Breast | Precancer | mitochondrion disassembly | 14/1080 | 81/18723 | 2.01e-04 | 3.16e-03 | 14 |
| GO:00070159 | Breast | Precancer | actin filament organization | 44/1080 | 442/18723 | 3.02e-04 | 4.35e-03 | 44 |
| GO:00224119 | Breast | Precancer | cellular component disassembly | 44/1080 | 443/18723 | 3.17e-04 | 4.51e-03 | 44 |
| GO:00160497 | Breast | Precancer | cell growth | 46/1080 | 482/18723 | 5.63e-04 | 7.16e-03 | 46 |
| GO:00108217 | Breast | Precancer | regulation of mitochondrion organization | 19/1080 | 144/18723 | 6.26e-04 | 7.78e-03 | 19 |
| GO:00329569 | Breast | Precancer | regulation of actin cytoskeleton organization | 36/1080 | 358/18723 | 8.56e-04 | 9.88e-03 | 36 |
| GO:00068986 | Breast | Precancer | receptor-mediated endocytosis | 27/1080 | 244/18723 | 9.01e-04 | 1.03e-02 | 27 |
| GO:00322739 | Breast | Precancer | positive regulation of protein polymerization | 18/1080 | 138/18723 | 9.85e-04 | 1.11e-02 | 18 |
| Page: 1 2 3 4 5 6 7 8 9 10 11 12 13 14 15 16 17 18 19 20 21 22 23 24 25 26 27 28 29 30 31 32 33 34 35 36 37 38 39 40 41 42 43 44 45 46 |
| Pathway ID | Tissue | Disease Stage | Description | Gene Ratio | Bg Ratio | pvalue | p.adjust | qvalue | Count |
| hsa0513018 | Breast | Precancer | Pathogenic Escherichia coli infection | 38/684 | 197/8465 | 3.12e-07 | 5.81e-06 | 4.45e-06 | 38 |
| hsa0513118 | Breast | Precancer | Shigellosis | 44/684 | 247/8465 | 3.91e-07 | 6.86e-06 | 5.26e-06 | 44 |
| hsa0453018 | Breast | Precancer | Tight junction | 31/684 | 169/8465 | 1.13e-05 | 1.26e-04 | 9.64e-05 | 31 |
| hsa0510018 | Breast | Precancer | Bacterial invasion of epithelial cells | 16/684 | 77/8465 | 3.55e-04 | 2.80e-03 | 2.15e-03 | 16 |
| hsa0520514 | Breast | Precancer | Proteoglycans in cancer | 30/684 | 205/8465 | 1.00e-03 | 7.18e-03 | 5.50e-03 | 30 |
| hsa0513019 | Breast | Precancer | Pathogenic Escherichia coli infection | 38/684 | 197/8465 | 3.12e-07 | 5.81e-06 | 4.45e-06 | 38 |
| hsa0513119 | Breast | Precancer | Shigellosis | 44/684 | 247/8465 | 3.91e-07 | 6.86e-06 | 5.26e-06 | 44 |
| hsa0453019 | Breast | Precancer | Tight junction | 31/684 | 169/8465 | 1.13e-05 | 1.26e-04 | 9.64e-05 | 31 |
| hsa0510019 | Breast | Precancer | Bacterial invasion of epithelial cells | 16/684 | 77/8465 | 3.55e-04 | 2.80e-03 | 2.15e-03 | 16 |
| hsa0520515 | Breast | Precancer | Proteoglycans in cancer | 30/684 | 205/8465 | 1.00e-03 | 7.18e-03 | 5.50e-03 | 30 |
| hsa0453024 | Breast | IDC | Tight junction | 38/867 | 169/8465 | 2.07e-06 | 3.20e-05 | 2.39e-05 | 38 |
| hsa0513024 | Breast | IDC | Pathogenic Escherichia coli infection | 42/867 | 197/8465 | 2.66e-06 | 3.92e-05 | 2.94e-05 | 42 |
| hsa0520523 | Breast | IDC | Proteoglycans in cancer | 42/867 | 205/8465 | 7.69e-06 | 9.99e-05 | 7.48e-05 | 42 |
| hsa0513124 | Breast | IDC | Shigellosis | 47/867 | 247/8465 | 1.78e-05 | 2.00e-04 | 1.49e-04 | 47 |
| hsa0510024 | Breast | IDC | Bacterial invasion of epithelial cells | 17/867 | 77/8465 | 1.69e-03 | 1.19e-02 | 8.93e-03 | 17 |
| hsa0453034 | Breast | IDC | Tight junction | 38/867 | 169/8465 | 2.07e-06 | 3.20e-05 | 2.39e-05 | 38 |
| hsa0513034 | Breast | IDC | Pathogenic Escherichia coli infection | 42/867 | 197/8465 | 2.66e-06 | 3.92e-05 | 2.94e-05 | 42 |
| hsa0520533 | Breast | IDC | Proteoglycans in cancer | 42/867 | 205/8465 | 7.69e-06 | 9.99e-05 | 7.48e-05 | 42 |
| hsa0513134 | Breast | IDC | Shigellosis | 47/867 | 247/8465 | 1.78e-05 | 2.00e-04 | 1.49e-04 | 47 |
| hsa0510034 | Breast | IDC | Bacterial invasion of epithelial cells | 17/867 | 77/8465 | 1.69e-03 | 1.19e-02 | 8.93e-03 | 17 |
| Page: 1 2 3 4 5 6 7 8 |
Top |
Cell-cell communication analysis |
| Identification of potential cell-cell interactions between two cell types and their ligand-receptor pairs for different disease states |
| Ligand | Receptor | LRpair | Pathway | Tissue | Disease Stage |
| Page: 1 |
Top |
Single-cell gene regulatory network inference analysis |
| Find out the significant the regulons (TFs) and the target genes of each regulon across cell types for different disease states |
| TF | Cell Type | Tissue | Disease Stage | Target Gene | RSS | Regulon Activity |
| ∗The dot plots of a searched regulon are shown for all cell subpopulations in each disease state of each tissue based on the regulon specific score inferred using pySCENIC and by calculating the average expression. |
| Page: 1 |
Top |
Somatic mutation of malignant transformation related genes |
| Annotation of somatic variants for genes involved in malignant transformation |
| Hugo Symbol | Variant Class | Variant Classification | dbSNP RS | HGVSc | HGVSp | HGVSp Short | SWISSPROT | BIOTYPE | SIFT | PolyPhen | Tumor Sample Barcode | Tissue | Histology | Sex | Age | Stage | Therapy Types | Drugs | Outcome |
| CTTN | SNV | Missense_Mutation | c.254N>C | p.Gly85Ala | p.G85A | Q14247 | protein_coding | deleterious(0.01) | probably_damaging(0.999) | TCGA-A8-A07B-01 | Breast | breast invasive carcinoma | Female | >=65 | I/II | Unknown | Unknown | SD | |
| CTTN | SNV | Missense_Mutation | novel | c.1373N>G | p.Ile458Ser | p.I458S | Q14247 | protein_coding | deleterious(0.01) | possibly_damaging(0.816) | TCGA-OL-A5DA-01 | Breast | breast invasive carcinoma | Female | <65 | I/II | Unknown | Unknown | SD |
| CTTN | insertion | Nonsense_Mutation | novel | c.281_282insTCCCTTCAGCTGAGAAAGATTTAGTCCTTCCTCCAGAAAAGAAGGCAC | p.Arg94_Met95insProPheSerTerGluArgPheSerProSerSerArgLysGluGlyThr | p.R94_M95insPFS*ERFSPSSRKEGT | Q14247 | protein_coding | TCGA-A8-A079-01 | Breast | breast invasive carcinoma | Female | >=65 | III/IV | Chemotherapy | 5-fluorouracil | SD | ||
| CTTN | insertion | Frame_Shift_Ins | novel | c.1049_1050insAACCCCTGCCTCCCAGGTTCAAGCGATT | p.Arg351ThrfsTer44 | p.R351Tfs*44 | Q14247 | protein_coding | TCGA-AN-A0FL-01 | Breast | breast invasive carcinoma | Female | <65 | I/II | Unknown | Unknown | SD | ||
| CTTN | SNV | Missense_Mutation | novel | c.56N>T | p.Ala19Val | p.A19V | Q14247 | protein_coding | tolerated(0.07) | benign(0.082) | TCGA-2W-A8YY-01 | Cervix | cervical & endocervical cancer | Female | <65 | I/II | Chemotherapy | cisplatin | CR |
| CTTN | SNV | Missense_Mutation | rs532238783 | c.1091N>T | p.Thr364Met | p.T364M | Q14247 | protein_coding | deleterious(0.01) | possibly_damaging(0.584) | TCGA-2W-A8YY-01 | Cervix | cervical & endocervical cancer | Female | <65 | I/II | Chemotherapy | cisplatin | CR |
| CTTN | SNV | Missense_Mutation | rs200712952 | c.1480N>T | p.Arg494Cys | p.R494C | Q14247 | protein_coding | deleterious(0.01) | possibly_damaging(0.693) | TCGA-2W-A8YY-01 | Cervix | cervical & endocervical cancer | Female | <65 | I/II | Chemotherapy | cisplatin | CR |
| CTTN | SNV | Missense_Mutation | rs774668913 | c.1384G>A | p.Ala462Thr | p.A462T | Q14247 | protein_coding | deleterious(0) | probably_damaging(1) | TCGA-EA-A410-01 | Cervix | cervical & endocervical cancer | Female | <65 | I/II | Unknown | Unknown | SD |
| CTTN | SNV | Missense_Mutation | c.941G>C | p.Arg314Thr | p.R314T | Q14247 | protein_coding | deleterious(0) | probably_damaging(0.954) | TCGA-EK-A2RJ-01 | Cervix | cervical & endocervical cancer | Female | <65 | I/II | Unknown | Unknown | SD | |
| CTTN | SNV | Missense_Mutation | novel | c.397G>T | p.Asp133Tyr | p.D133Y | Q14247 | protein_coding | deleterious(0.01) | probably_damaging(1) | TCGA-AZ-4315-01 | Colorectum | colon adenocarcinoma | Male | <65 | I/II | Unknown | Unknown | SD |
| Page: 1 2 3 4 5 6 7 |
Top |
Related drugs of malignant transformation related genes |
| Identification of chemicals and drugs interact with genes involved in malignant transfromation |
| (DGIdb 4.0) |
| Entrez ID | Symbol | Category | Interaction Types | Drug Claim Name | Drug Name | PMIDs |
| Page: 1 |

Copyright 2023-Present -The University of Texas Health Science Center at Houston |