
|
|||||
|
 | |
| |
| |
| |
| |
| |
|
Gene: CTSZ |
Gene summary for CTSZ |
| Gene information | Species | Human | Gene symbol | CTSZ | Gene ID | 1522 |
| Gene name | cathepsin Z | |
| Gene Alias | CTSX | |
| Cytomap | 20q13.32 | |
| Gene Type | protein-coding | GO ID | GO:0001763 | UniProtAcc | Q9UBR2 |
Top |
Malignant transformation analysis |
| Identification of the aberrant gene expression in precancerous and cancerous lesions by comparing the gene expression of stem-like cells in diseased tissues with normal stem cells |
| Entrez ID | Symbol | Replicates | Species | Organ | Tissue | Adj P-value | Log2FC | Malignancy |
| 1522 | CTSZ | GSM4909293 | Human | Breast | IDC | 9.34e-03 | 2.37e-01 | 0.1581 |
| 1522 | CTSZ | GSM4909295 | Human | Breast | IDC | 6.67e-05 | 4.74e-01 | 0.0898 |
| 1522 | CTSZ | GSM4909297 | Human | Breast | IDC | 1.29e-03 | 8.63e-02 | 0.1517 |
| 1522 | CTSZ | GSM4909308 | Human | Breast | IDC | 2.55e-02 | 2.68e-01 | 0.158 |
| 1522 | CTSZ | GSM4909311 | Human | Breast | IDC | 1.38e-14 | -2.41e-02 | 0.1534 |
| 1522 | CTSZ | GSM4909319 | Human | Breast | IDC | 2.10e-19 | -6.62e-03 | 0.1563 |
| 1522 | CTSZ | GSM4909321 | Human | Breast | IDC | 1.25e-04 | 7.12e-02 | 0.1559 |
| 1522 | CTSZ | brca1 | Human | Breast | Precancer | 3.88e-03 | 2.42e-01 | -0.0338 |
| 1522 | CTSZ | NCCBC11 | Human | Breast | DCIS | 1.41e-05 | 2.69e-01 | 0.1232 |
| 1522 | CTSZ | NCCBC14 | Human | Breast | DCIS | 7.62e-15 | 2.34e-01 | 0.2021 |
| 1522 | CTSZ | NCCBC3 | Human | Breast | DCIS | 8.20e-22 | 7.02e-01 | 0.1198 |
| 1522 | CTSZ | NCCBC5 | Human | Breast | DCIS | 1.01e-08 | 2.32e-01 | 0.2046 |
| 1522 | CTSZ | P1 | Human | Breast | IDC | 1.92e-09 | 1.16e-02 | 0.1527 |
| 1522 | CTSZ | DCIS2 | Human | Breast | DCIS | 3.13e-75 | 7.29e-01 | 0.0085 |
| 1522 | CTSZ | CA_HPV_1 | Human | Cervix | CC | 1.50e-15 | 6.56e-01 | 0.0264 |
| 1522 | CTSZ | N_HPV_2 | Human | Cervix | N_HPV | 3.17e-02 | 2.78e-01 | -0.0131 |
| 1522 | CTSZ | CCI_1 | Human | Cervix | CC | 2.88e-02 | -5.11e-01 | 0.528 |
| 1522 | CTSZ | CCI_3 | Human | Cervix | CC | 1.93e-04 | -5.24e-01 | 0.516 |
| 1522 | CTSZ | CCII_1 | Human | Cervix | CC | 4.22e-07 | -5.26e-01 | 0.3249 |
| 1522 | CTSZ | Tumor | Human | Cervix | CC | 1.76e-02 | -2.15e-01 | 0.1241 |
| Page: 1 2 3 4 5 6 7 8 9 10 |
| Tissue | Expression Dynamics | Abbreviation |
| Breast |  | IDC: Invasive ductal carcinoma |
| DCIS: Ductal carcinoma in situ | ||
| Precancer(BRCA1-mut): Precancerous lesion from BRCA1 mutation carriers | ||
| Cervix | 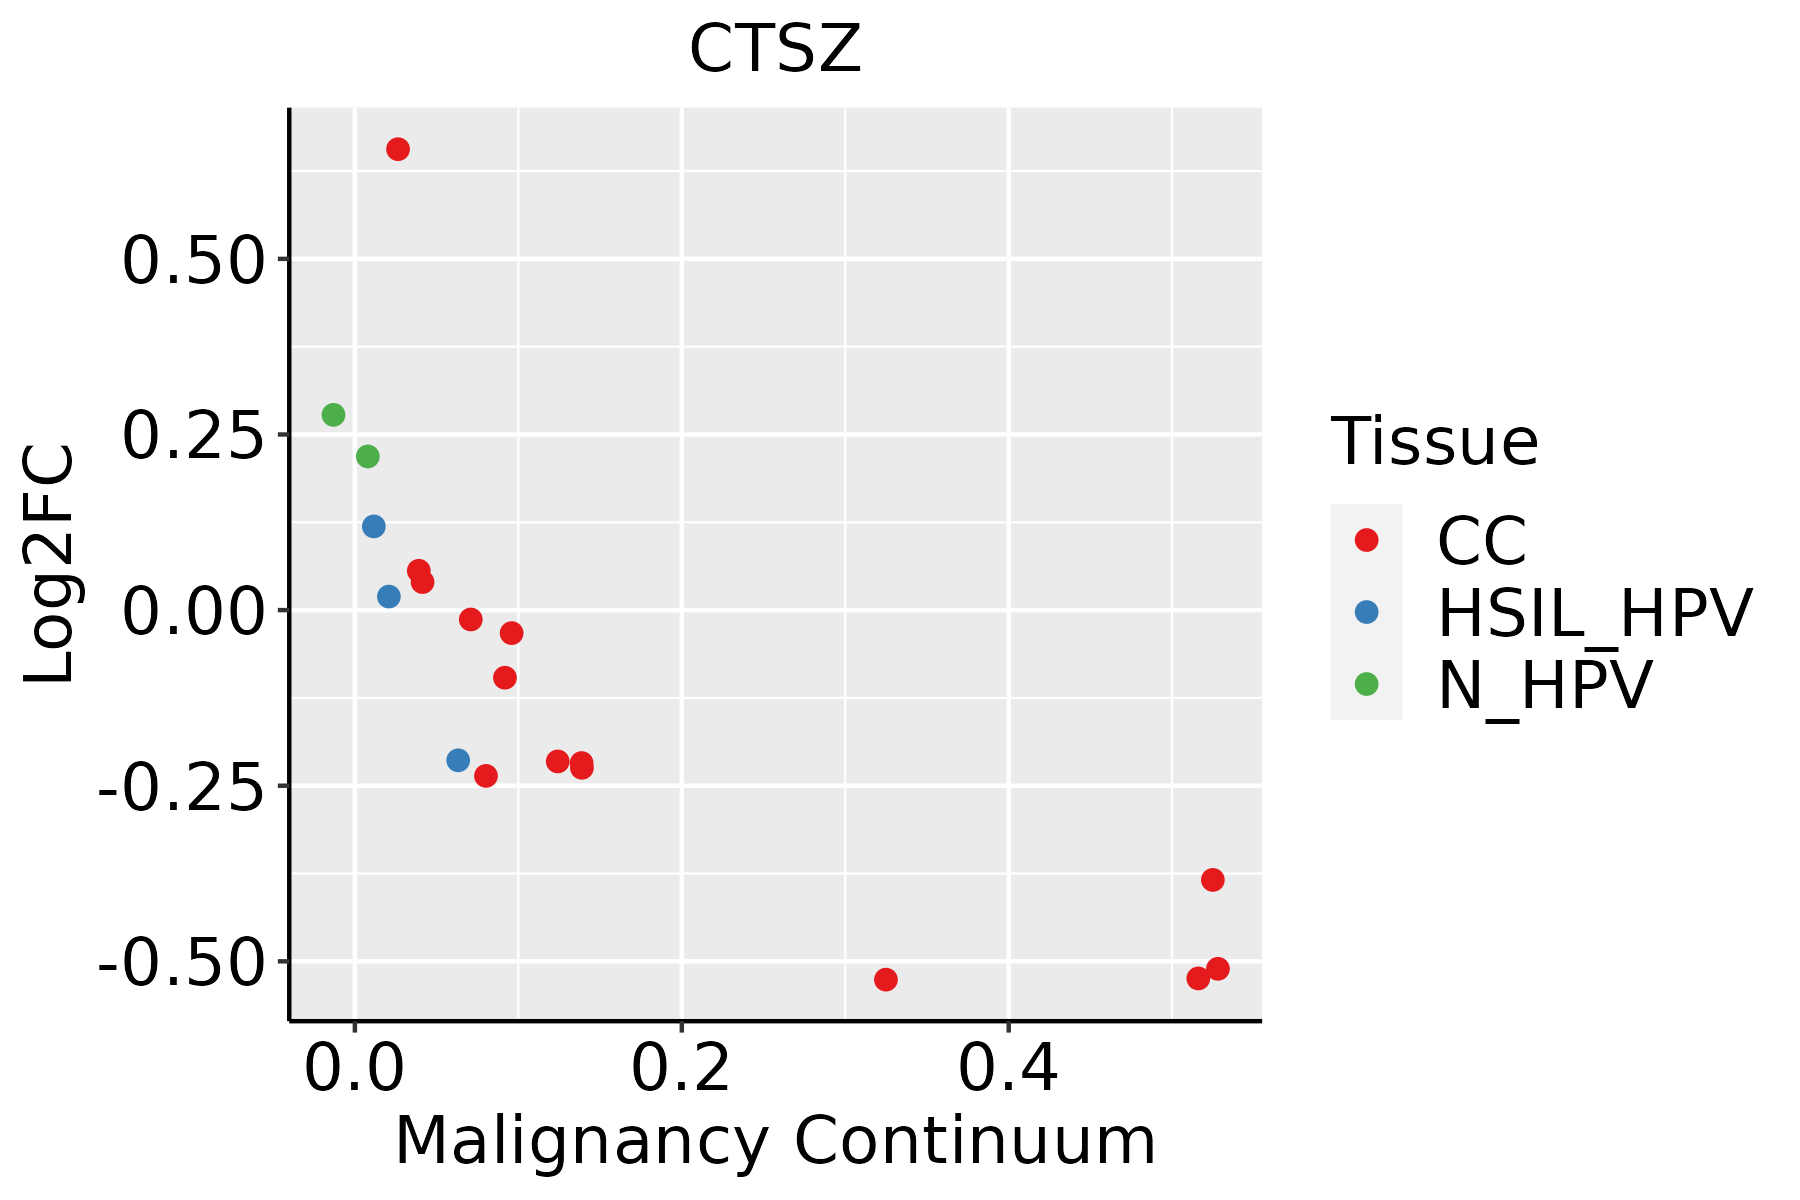 | CC: Cervix cancer |
| HSIL_HPV: HPV-infected high-grade squamous intraepithelial lesions | ||
| N_HPV: HPV-infected normal cervix | ||
| Colorectum (GSE201348) | 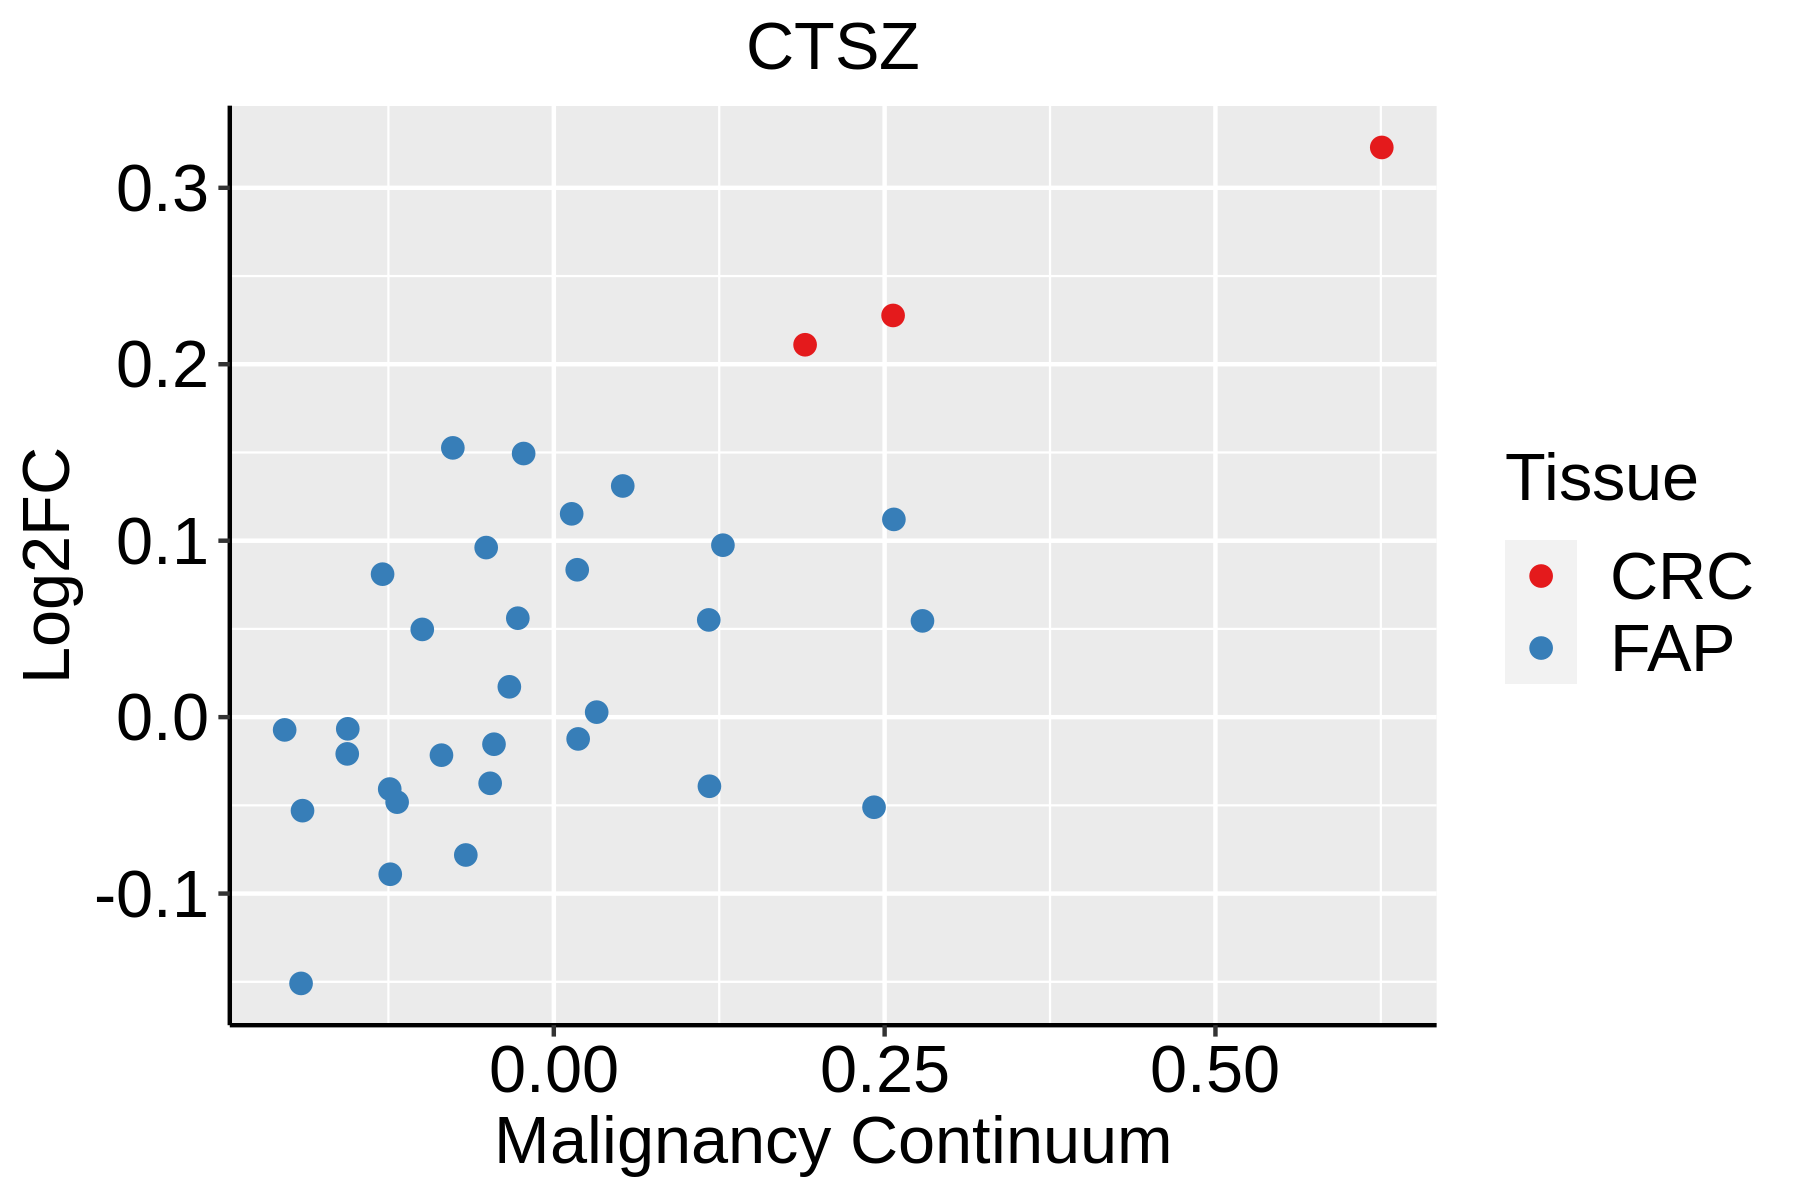 | FAP: Familial adenomatous polyposis |
| CRC: Colorectal cancer | ||
| Colorectum (HTA11) | 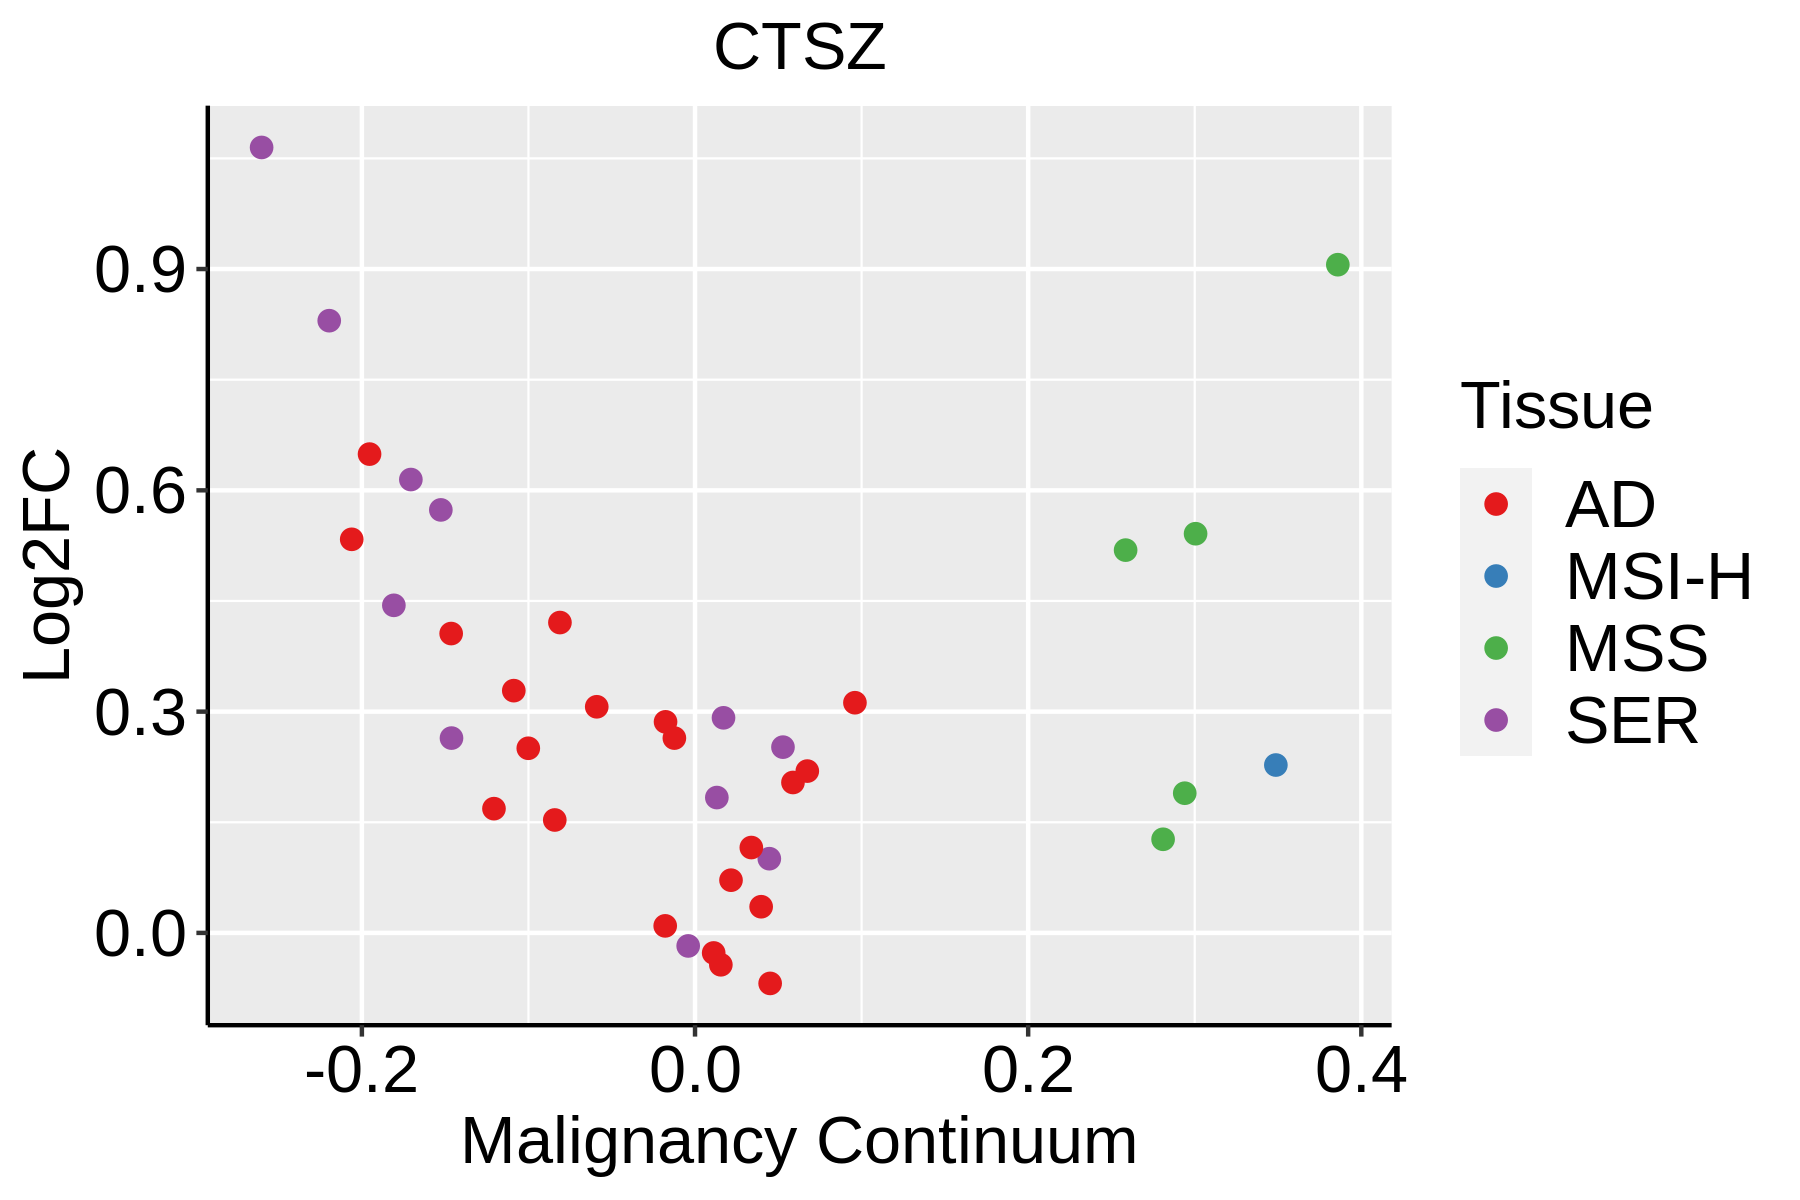 | AD: Adenomas |
| SER: Sessile serrated lesions | ||
| MSI-H: Microsatellite-high colorectal cancer | ||
| MSS: Microsatellite stable colorectal cancer | ||
| Esophagus | 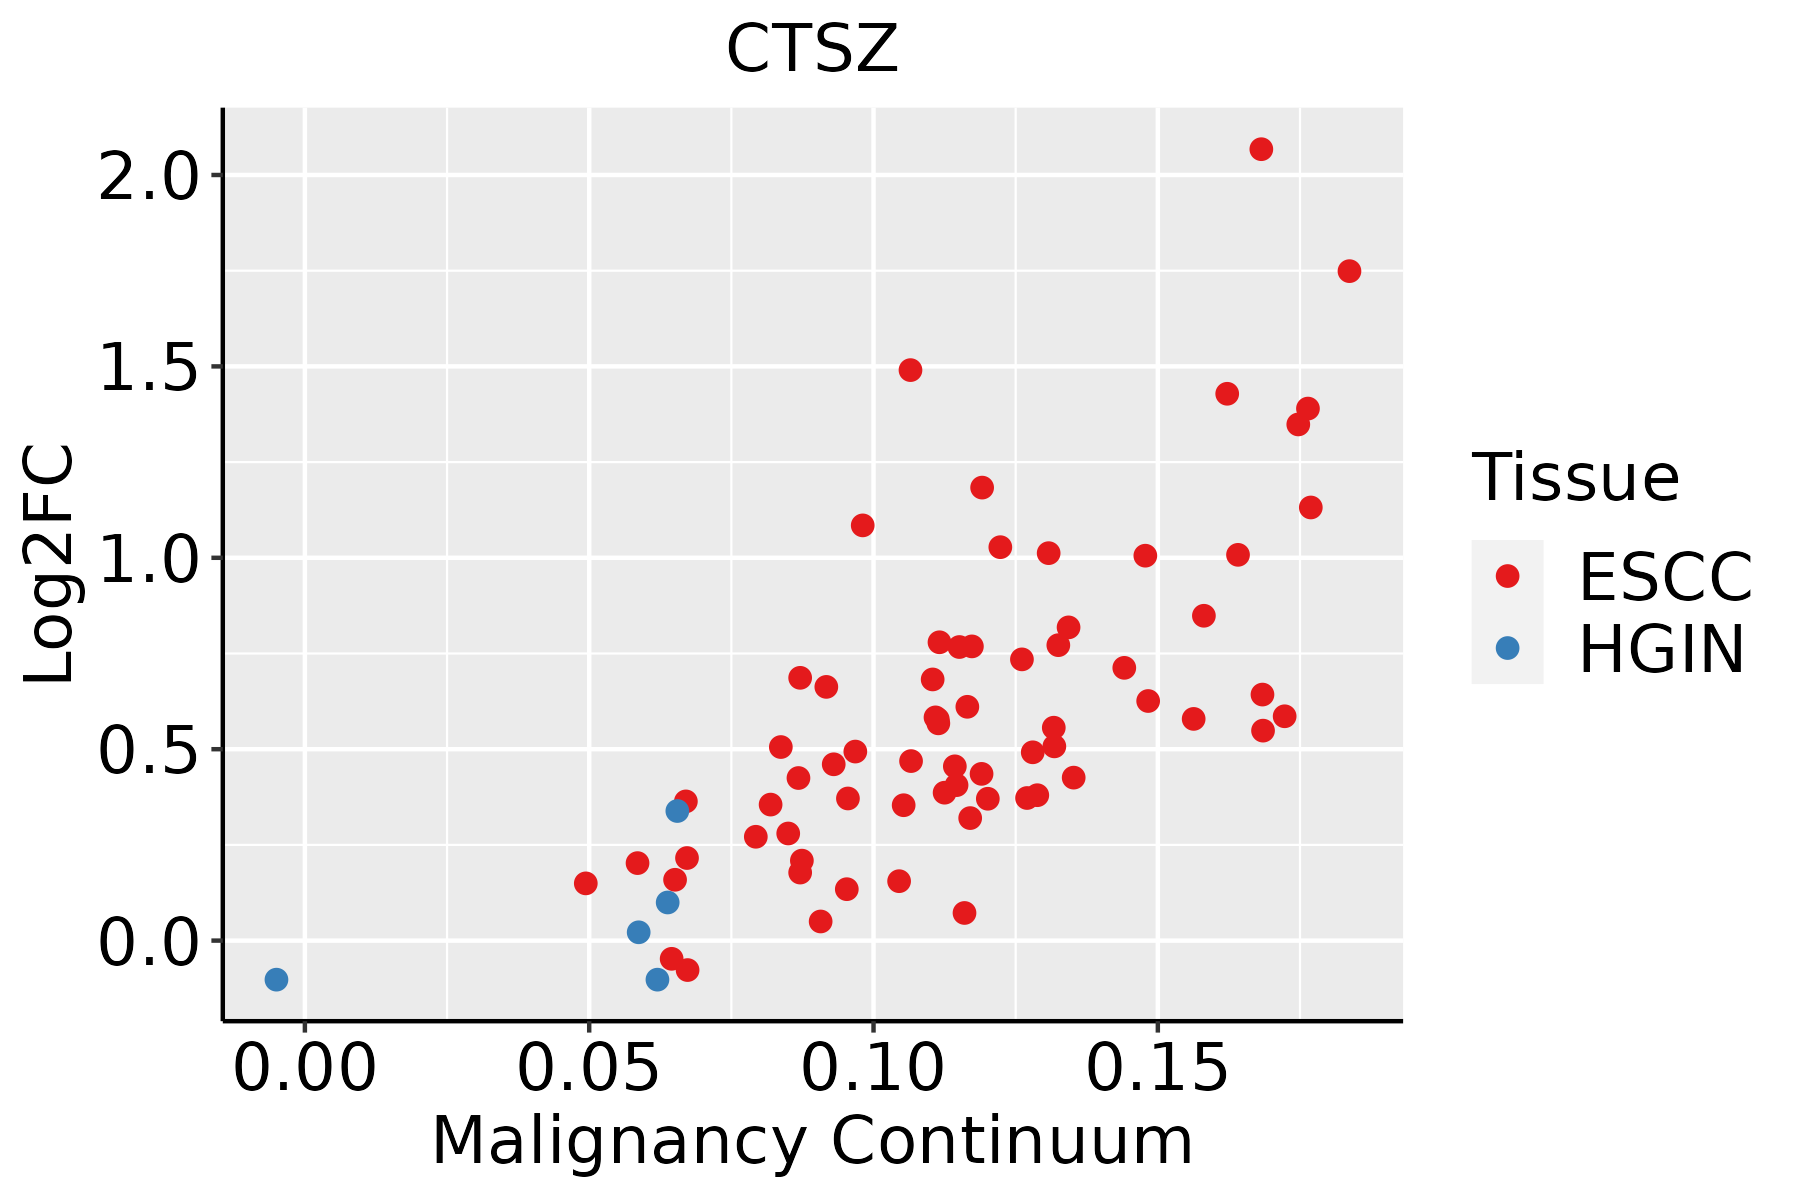 | ESCC: Esophageal squamous cell carcinoma |
| HGIN: High-grade intraepithelial neoplasias | ||
| LGIN: Low-grade intraepithelial neoplasias | ||
| GC | 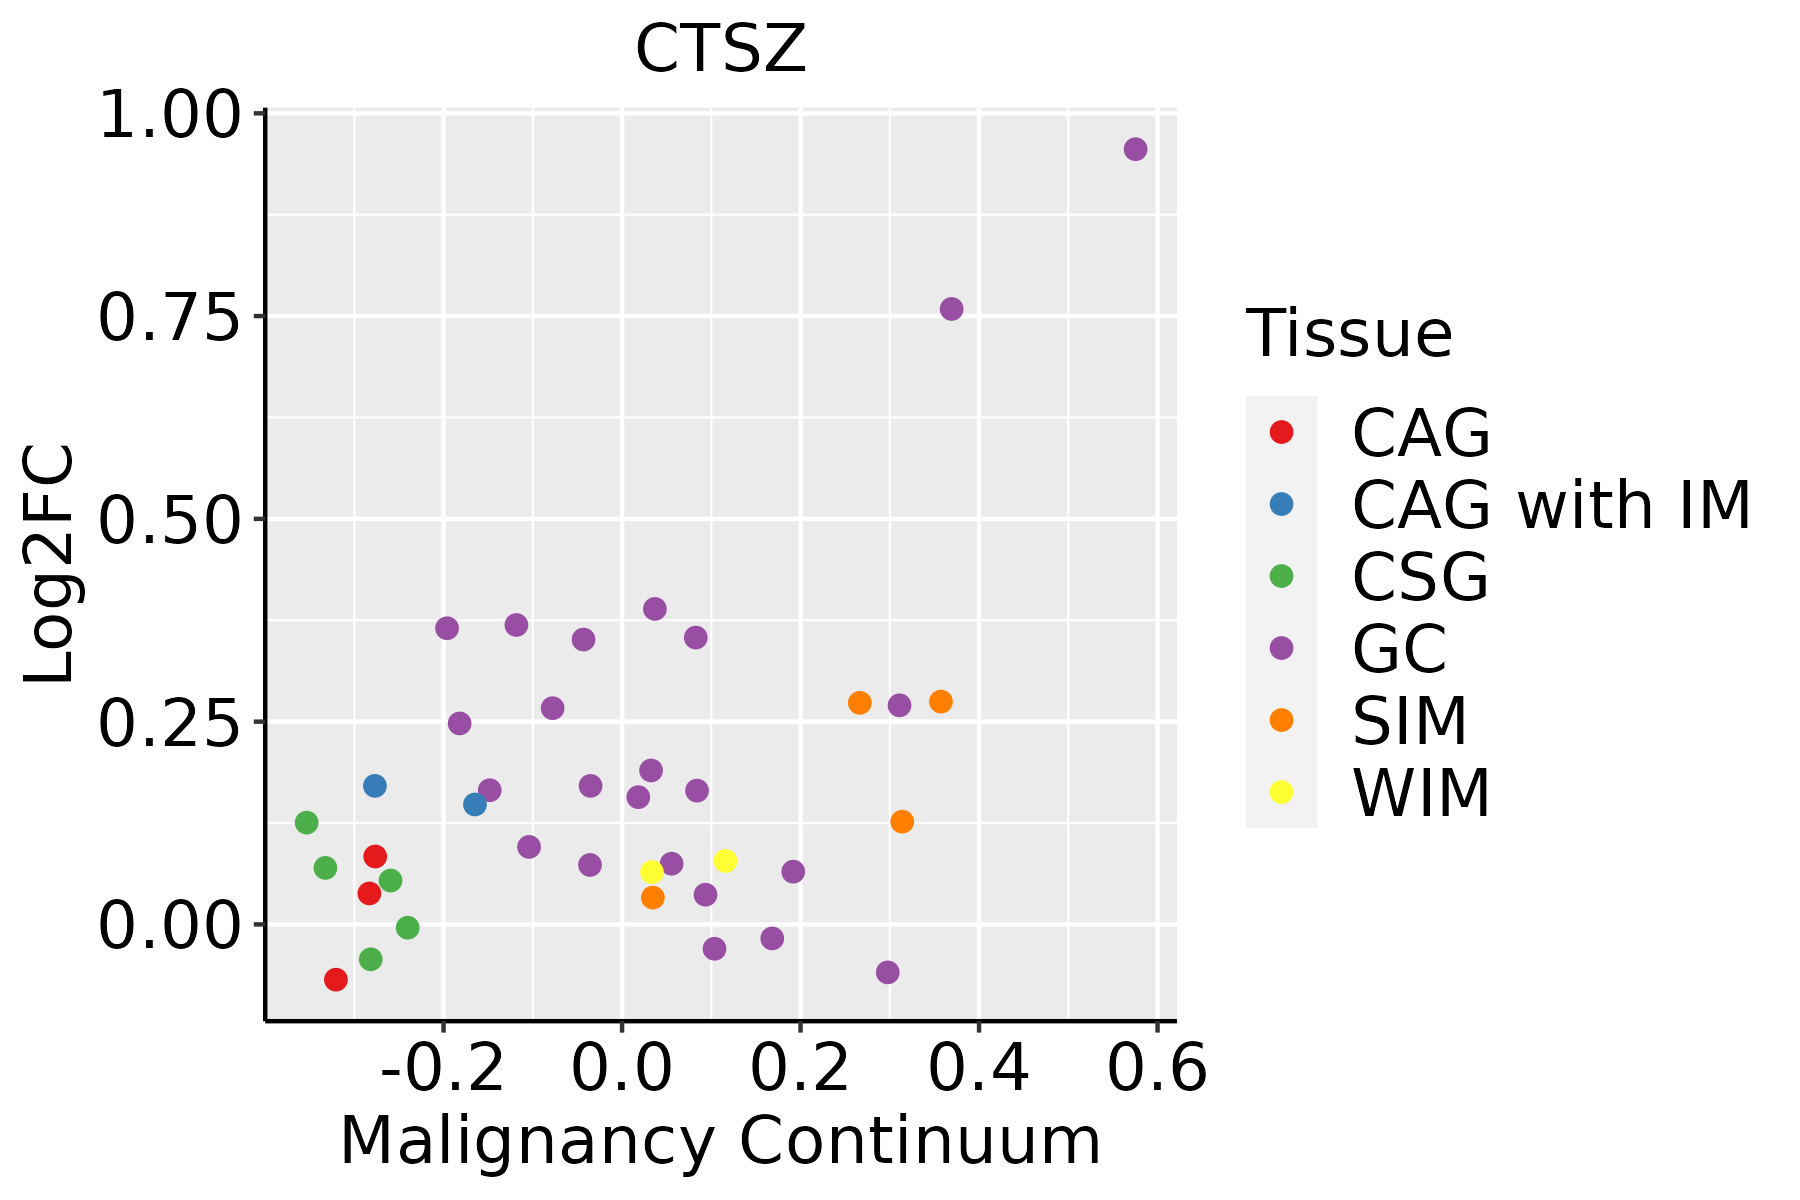 | CAG: Chronic atrophic gastritis |
| CAG with IM: Chronic atrophic gastritis with intestinal metaplasia | ||
| CSG: Chronic superficial gastritis | ||
| GC: Gastric cancer | ||
| SIM: Severe intestinal metaplasia | ||
| WIM: Wild intestinal metaplasia | ||
| Liver | 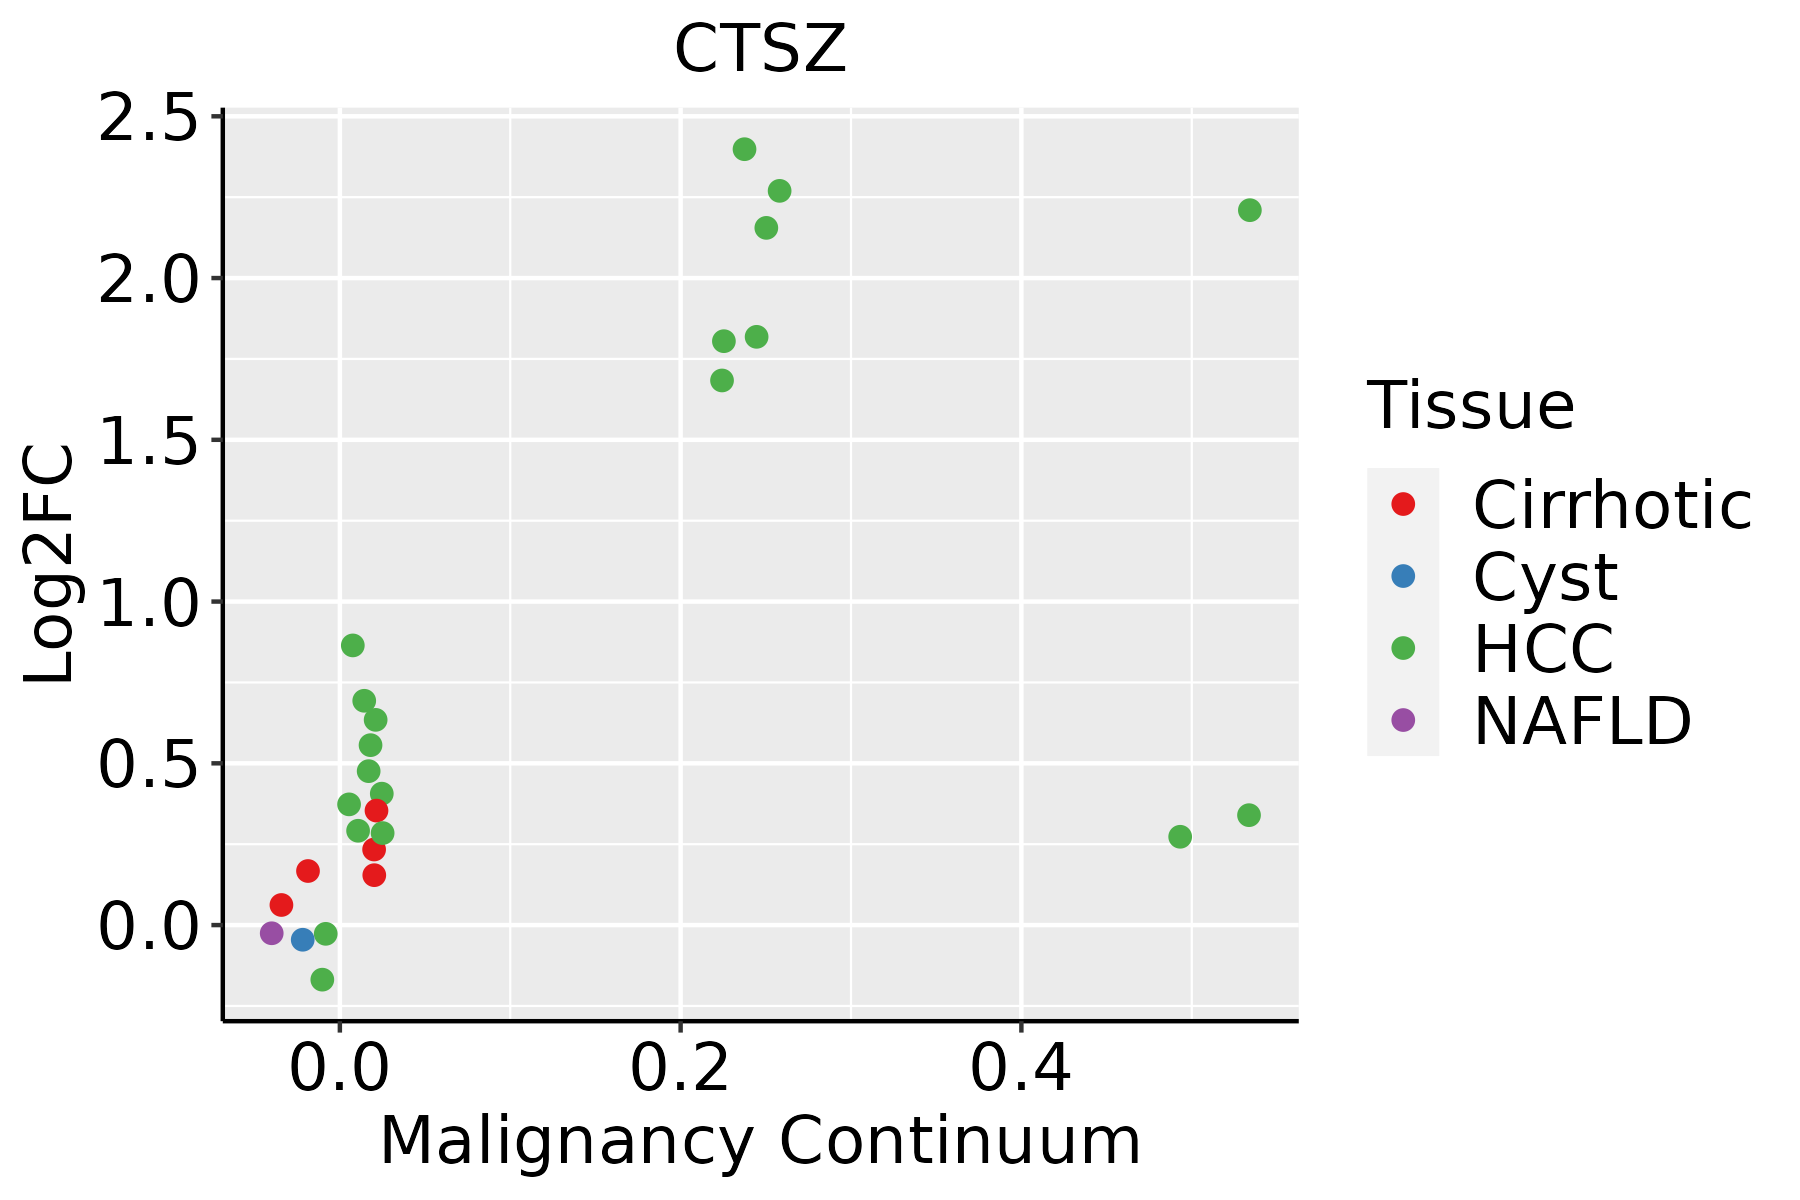 | HCC: Hepatocellular carcinoma |
| NAFLD: Non-alcoholic fatty liver disease | ||
| Oral Cavity | 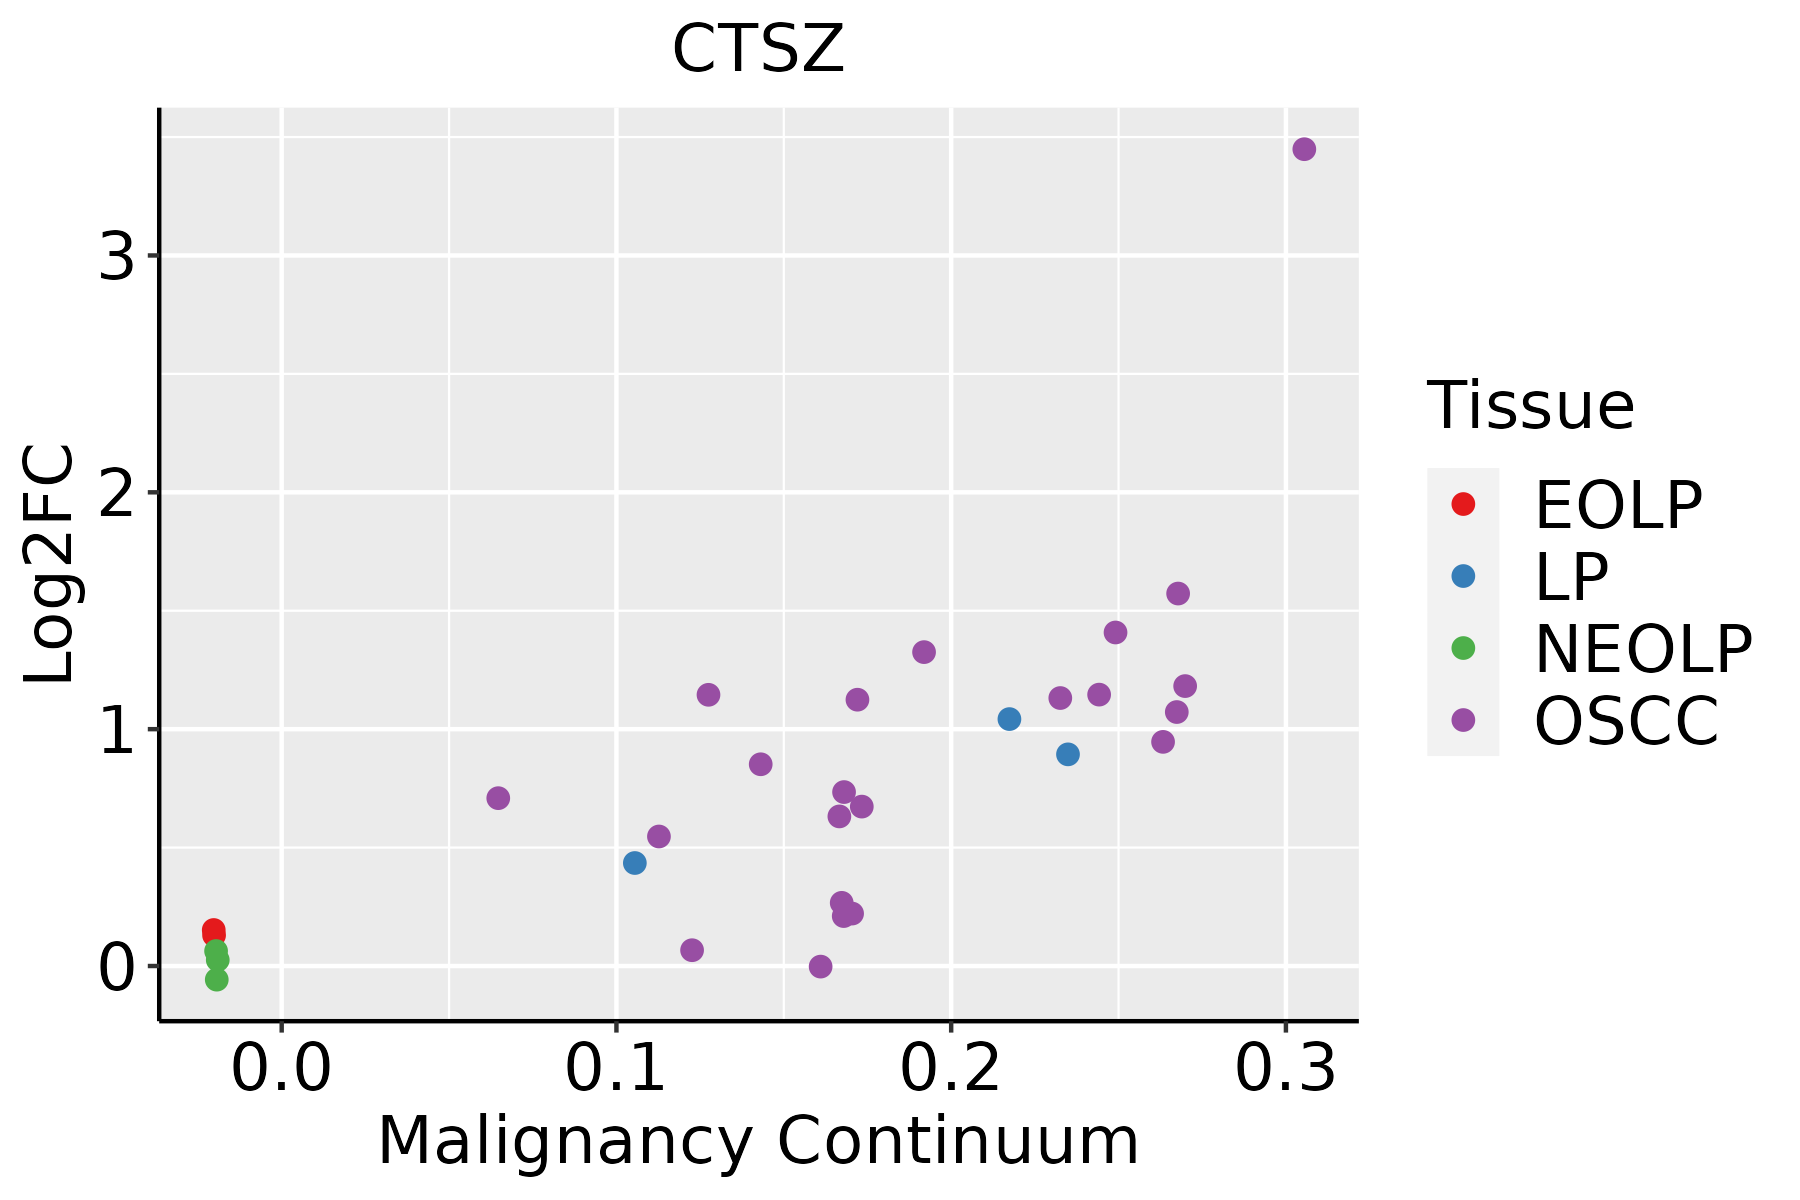 | EOLP: Erosive Oral lichen planus |
| LP: leukoplakia | ||
| NEOLP: Non-erosive oral lichen planus | ||
| OSCC: Oral squamous cell carcinoma | ||
| Skin |  | AK: Actinic keratosis |
| cSCC: Cutaneous squamous cell carcinoma | ||
| SCCIS:squamous cell carcinoma in situ | ||
| Thyroid | 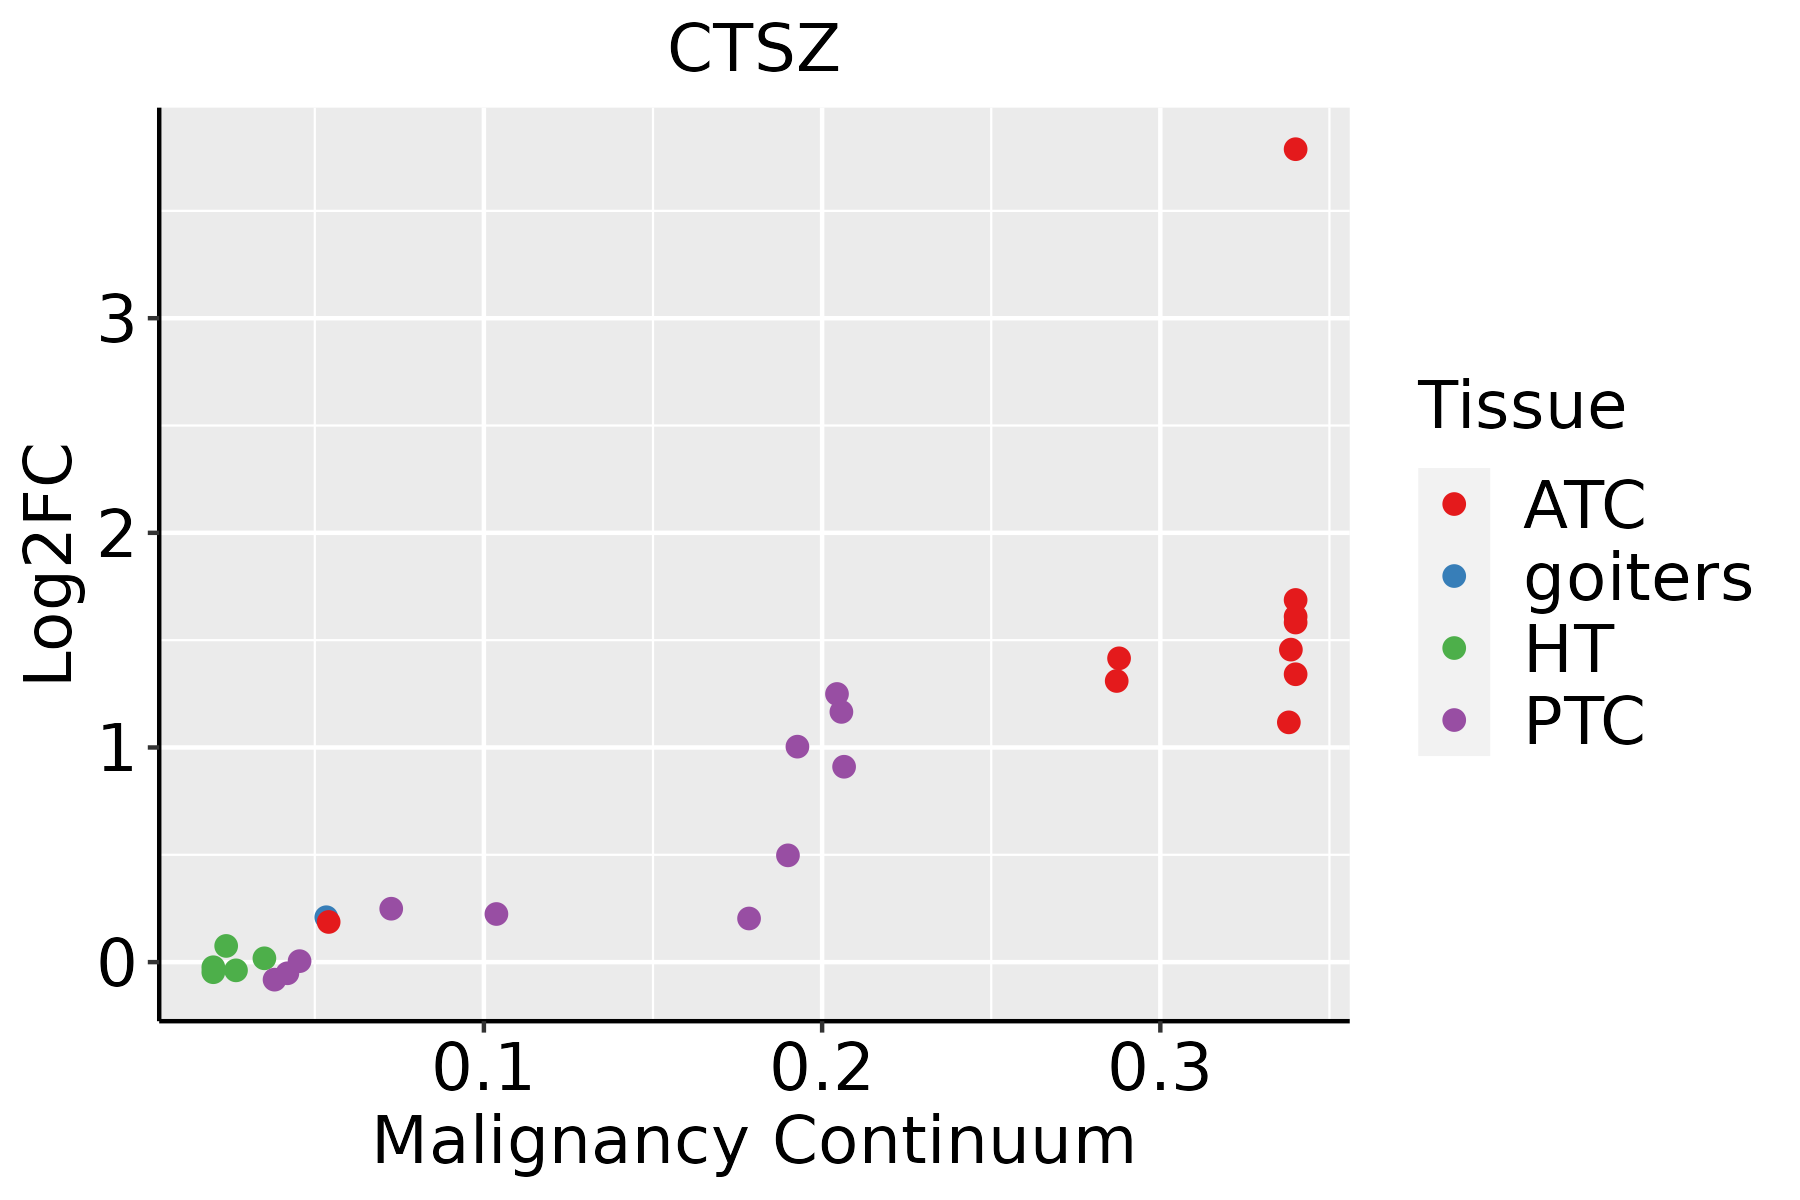 | ATC: Anaplastic thyroid cancer |
| HT: Hashimoto's thyroiditis | ||
| PTC: Papillary thyroid cancer |
| ∗log2FC in expression of this searched gene in stem-like cells from each diseased tissue sample relative to stem-like cells in normal samples in each tissue plotted against the malignancy continuum. Samples are colored based on if they are from different disease stage. |
Top |
Malignant transformation related pathway analysis |
| Find out the enriched GO biological processes and KEGG pathways involved in transition from healthy to precancer to cancer |
| Tissue | Disease Stage | Enriched GO biological Processes |
| Colorectum | AD |  |
| Colorectum | SER |  |
| Colorectum | MSS |  |
| Colorectum | MSI-H |  |
| Colorectum | FAP |  |
| ∗Top 15 enriched GO BP terms are showed in the bar plot of each disease state in each tissue. Each row represents a significant GO biological process which is colored according to the -log10(p.adjust). |
| Page: 1 2 3 4 5 6 7 8 9 |
| GO ID | Tissue | Disease Stage | Description | Gene Ratio | Bg Ratio | pvalue | p.adjust | Count |
| GO:00458619 | Breast | Precancer | negative regulation of proteolysis | 50/1080 | 351/18723 | 2.99e-09 | 2.39e-07 | 50 |
| GO:00709979 | Breast | Precancer | neuron death | 50/1080 | 361/18723 | 7.75e-09 | 5.70e-07 | 50 |
| GO:00514029 | Breast | Precancer | neuron apoptotic process | 38/1080 | 246/18723 | 2.68e-08 | 1.75e-06 | 38 |
| GO:19012149 | Breast | Precancer | regulation of neuron death | 41/1080 | 319/18723 | 1.27e-06 | 4.80e-05 | 41 |
| GO:00435237 | Breast | Precancer | regulation of neuron apoptotic process | 31/1080 | 212/18723 | 1.69e-06 | 6.08e-05 | 31 |
| GO:00510989 | Breast | Precancer | regulation of binding | 44/1080 | 363/18723 | 2.59e-06 | 8.65e-05 | 44 |
| GO:19012169 | Breast | Precancer | positive regulation of neuron death | 16/1080 | 97/18723 | 1.29e-04 | 2.24e-03 | 16 |
| GO:00435258 | Breast | Precancer | positive regulation of neuron apoptotic process | 11/1080 | 58/18723 | 4.17e-04 | 5.56e-03 | 11 |
| GO:00316393 | Breast | Precancer | plasminogen activation | 6/1080 | 24/18723 | 1.99e-03 | 1.90e-02 | 6 |
| GO:00511008 | Breast | Precancer | negative regulation of binding | 19/1080 | 162/18723 | 2.56e-03 | 2.32e-02 | 19 |
| GO:00605625 | Breast | Precancer | epithelial tube morphogenesis | 31/1080 | 325/18723 | 4.21e-03 | 3.31e-02 | 31 |
| GO:00516047 | Breast | Precancer | protein maturation | 28/1080 | 294/18723 | 6.45e-03 | 4.50e-02 | 28 |
| GO:004586114 | Breast | IDC | negative regulation of proteolysis | 70/1434 | 351/18723 | 8.21e-14 | 2.22e-11 | 70 |
| GO:007099714 | Breast | IDC | neuron death | 57/1434 | 361/18723 | 1.31e-07 | 7.38e-06 | 57 |
| GO:005109814 | Breast | IDC | regulation of binding | 57/1434 | 363/18723 | 1.59e-07 | 8.76e-06 | 57 |
| GO:005140213 | Breast | IDC | neuron apoptotic process | 42/1434 | 246/18723 | 7.21e-07 | 3.35e-05 | 42 |
| GO:190121414 | Breast | IDC | regulation of neuron death | 48/1434 | 319/18723 | 5.01e-06 | 1.69e-04 | 48 |
| GO:004352313 | Breast | IDC | regulation of neuron apoptotic process | 35/1434 | 212/18723 | 1.26e-05 | 3.29e-04 | 35 |
| GO:190121614 | Breast | IDC | positive regulation of neuron death | 19/1434 | 97/18723 | 1.22e-04 | 2.25e-03 | 19 |
| GO:006056212 | Breast | IDC | epithelial tube morphogenesis | 44/1434 | 325/18723 | 1.58e-04 | 2.73e-03 | 44 |
| Page: 1 2 3 4 5 6 7 8 9 10 11 12 13 14 15 16 17 18 |
| Pathway ID | Tissue | Disease Stage | Description | Gene Ratio | Bg Ratio | pvalue | p.adjust | qvalue | Count |
| hsa042108 | Breast | Precancer | Apoptosis | 25/684 | 136/8465 | 7.61e-05 | 6.87e-04 | 5.26e-04 | 25 |
| hsa0421013 | Breast | Precancer | Apoptosis | 25/684 | 136/8465 | 7.61e-05 | 6.87e-04 | 5.26e-04 | 25 |
| hsa0421022 | Breast | IDC | Apoptosis | 31/867 | 136/8465 | 1.34e-05 | 1.61e-04 | 1.20e-04 | 31 |
| hsa0421032 | Breast | IDC | Apoptosis | 31/867 | 136/8465 | 1.34e-05 | 1.61e-04 | 1.20e-04 | 31 |
| hsa0421041 | Breast | DCIS | Apoptosis | 29/846 | 136/8465 | 5.92e-05 | 5.97e-04 | 4.40e-04 | 29 |
| hsa0421051 | Breast | DCIS | Apoptosis | 29/846 | 136/8465 | 5.92e-05 | 5.97e-04 | 4.40e-04 | 29 |
| hsa042109 | Cervix | CC | Apoptosis | 36/1267 | 136/8465 | 3.21e-04 | 1.68e-03 | 9.91e-04 | 36 |
| hsa0421014 | Cervix | CC | Apoptosis | 36/1267 | 136/8465 | 3.21e-04 | 1.68e-03 | 9.91e-04 | 36 |
| hsa0421042 | Cervix | N_HPV | Apoptosis | 14/349 | 136/8465 | 1.40e-03 | 9.06e-03 | 7.08e-03 | 14 |
| hsa0421052 | Cervix | N_HPV | Apoptosis | 14/349 | 136/8465 | 1.40e-03 | 9.06e-03 | 7.08e-03 | 14 |
| hsa04142 | Colorectum | SER | Lysosome | 38/1580 | 132/8465 | 2.87e-03 | 2.03e-02 | 1.47e-02 | 38 |
| hsa041421 | Colorectum | SER | Lysosome | 38/1580 | 132/8465 | 2.87e-03 | 2.03e-02 | 1.47e-02 | 38 |
| hsa04210 | Colorectum | MSS | Apoptosis | 44/1875 | 136/8465 | 3.66e-03 | 1.66e-02 | 1.01e-02 | 44 |
| hsa042101 | Colorectum | MSS | Apoptosis | 44/1875 | 136/8465 | 3.66e-03 | 1.66e-02 | 1.01e-02 | 44 |
| hsa0414222 | Esophagus | ESCC | Lysosome | 102/4205 | 132/8465 | 5.11e-11 | 7.13e-10 | 3.65e-10 | 102 |
| hsa0421027 | Esophagus | ESCC | Apoptosis | 102/4205 | 136/8465 | 1.05e-09 | 1.21e-08 | 6.21e-09 | 102 |
| hsa0414232 | Esophagus | ESCC | Lysosome | 102/4205 | 132/8465 | 5.11e-11 | 7.13e-10 | 3.65e-10 | 102 |
| hsa0421037 | Esophagus | ESCC | Apoptosis | 102/4205 | 136/8465 | 1.05e-09 | 1.21e-08 | 6.21e-09 | 102 |
| hsa041424 | Liver | Cirrhotic | Lysosome | 68/2530 | 132/8465 | 1.34e-07 | 1.97e-06 | 1.21e-06 | 68 |
| hsa042106 | Liver | Cirrhotic | Apoptosis | 58/2530 | 136/8465 | 9.84e-04 | 5.55e-03 | 3.42e-03 | 58 |
| Page: 1 2 |
Top |
Cell-cell communication analysis |
| Identification of potential cell-cell interactions between two cell types and their ligand-receptor pairs for different disease states |
| Ligand | Receptor | LRpair | Pathway | Tissue | Disease Stage |
| Page: 1 |
Top |
Single-cell gene regulatory network inference analysis |
| Find out the significant the regulons (TFs) and the target genes of each regulon across cell types for different disease states |
| TF | Cell Type | Tissue | Disease Stage | Target Gene | RSS | Regulon Activity |
| ∗The dot plots of a searched regulon are shown for all cell subpopulations in each disease state of each tissue based on the regulon specific score inferred using pySCENIC and by calculating the average expression. |
| Page: 1 |
Top |
Somatic mutation of malignant transformation related genes |
| Annotation of somatic variants for genes involved in malignant transformation |
| Hugo Symbol | Variant Class | Variant Classification | dbSNP RS | HGVSc | HGVSp | HGVSp Short | SWISSPROT | BIOTYPE | SIFT | PolyPhen | Tumor Sample Barcode | Tissue | Histology | Sex | Age | Stage | Therapy Types | Drugs | Outcome |
| CTSZ | SNV | Missense_Mutation | c.731C>T | p.Ser244Phe | p.S244F | Q9UBR2 | protein_coding | deleterious(0) | probably_damaging(0.995) | TCGA-EW-A1J5-01 | Breast | breast invasive carcinoma | Female | <65 | I/II | Chemotherapy | adriamycin | SD | |
| CTSZ | SNV | Missense_Mutation | c.867C>G | p.Asn289Lys | p.N289K | Q9UBR2 | protein_coding | deleterious(0) | probably_damaging(0.993) | TCGA-EW-A1OZ-01 | Breast | breast invasive carcinoma | Female | <65 | I/II | Targeted Molecular therapy | trastuzumab | SD | |
| CTSZ | SNV | Missense_Mutation | c.785N>T | p.Ser262Leu | p.S262L | Q9UBR2 | protein_coding | deleterious(0) | probably_damaging(1) | TCGA-C5-A1MP-01 | Cervix | cervical & endocervical cancer | Female | <65 | I/II | Unknown | Unknown | SD | |
| CTSZ | SNV | Missense_Mutation | novel | c.668N>G | p.Ala223Gly | p.A223G | Q9UBR2 | protein_coding | tolerated(0.06) | benign(0.001) | TCGA-IR-A3LH-01 | Cervix | cervical & endocervical cancer | Female | <65 | I/II | Chemotherapy | cisplatin | CR |
| CTSZ | SNV | Missense_Mutation | rs748740856 | c.418N>A | p.Val140Met | p.V140M | Q9UBR2 | protein_coding | deleterious(0) | probably_damaging(0.992) | TCGA-5M-AAT6-01 | Colorectum | colon adenocarcinoma | Female | <65 | III/IV | Unknown | Unknown | PD |
| CTSZ | SNV | Missense_Mutation | rs201081854 | c.335N>T | p.Ala112Val | p.A112V | Q9UBR2 | protein_coding | tolerated(0.12) | benign(0.015) | TCGA-AA-3715-01 | Colorectum | colon adenocarcinoma | Male | >=65 | I/II | Unknown | Unknown | PD |
| CTSZ | SNV | Missense_Mutation | novel | c.718N>C | p.Asn240His | p.N240H | Q9UBR2 | protein_coding | deleterious(0) | probably_damaging(0.991) | TCGA-CA-6717-01 | Colorectum | colon adenocarcinoma | Male | <65 | I/II | Chemotherapy | oxaliplatin | CR |
| CTSZ | SNV | Missense_Mutation | rs201081854 | c.335N>T | p.Ala112Val | p.A112V | Q9UBR2 | protein_coding | tolerated(0.12) | benign(0.015) | TCGA-F4-6856-01 | Colorectum | colon adenocarcinoma | Male | <65 | I/II | Ancillary | leucovorin | CR |
| CTSZ | SNV | Missense_Mutation | rs202127342 | c.580N>A | p.Gly194Ser | p.G194S | Q9UBR2 | protein_coding | deleterious(0) | probably_damaging(0.997) | TCGA-G4-6628-01 | Colorectum | colon adenocarcinoma | Male | >=65 | I/II | Unknown | Unknown | SD |
| CTSZ | SNV | Missense_Mutation | rs368797360 | c.880N>A | p.Glu294Lys | p.E294K | Q9UBR2 | protein_coding | tolerated(0.53) | benign(0.003) | TCGA-A5-A0G2-01 | Endometrium | uterine corpus endometrioid carcinoma | Female | <65 | III/IV | Unknown | Unknown | SD |
| Page: 1 2 3 |
Top |
Related drugs of malignant transformation related genes |
| Identification of chemicals and drugs interact with genes involved in malignant transfromation |
| (DGIdb 4.0) |
| Entrez ID | Symbol | Category | Interaction Types | Drug Claim Name | Drug Name | PMIDs |
| 1522 | CTSZ | DRUGGABLE GENOME, PROTEASE, ENZYME | inhibitor | 178103092 | ODANACATIB |
| Page: 1 |

Copyright 2023-Present -The University of Texas Health Science Center at Houston |