
|
|||||
|
 | |
| |
| |
| |
| |
| |
|
Gene: CTSW |
Gene summary for CTSW |
| Gene information | Species | Human | Gene symbol | CTSW | Gene ID | 1521 |
| Gene name | cathepsin W | |
| Gene Alias | LYPN | |
| Cytomap | 11q13.1 | |
| Gene Type | protein-coding | GO ID | GO:0002376 | UniProtAcc | P56202 |
Top |
Malignant transformation analysis |
| Identification of the aberrant gene expression in precancerous and cancerous lesions by comparing the gene expression of stem-like cells in diseased tissues with normal stem cells |
| Entrez ID | Symbol | Replicates | Species | Organ | Tissue | Adj P-value | Log2FC | Malignancy |
| 1521 | CTSW | C21 | Human | Oral cavity | OSCC | 2.33e-16 | 5.77e-01 | 0.2678 |
| 1521 | CTSW | C38 | Human | Oral cavity | OSCC | 3.10e-09 | 1.10e+00 | 0.172 |
| 1521 | CTSW | C46 | Human | Oral cavity | OSCC | 1.64e-03 | 1.18e-01 | 0.1673 |
| 1521 | CTSW | LN22 | Human | Oral cavity | OSCC | 5.72e-05 | 8.23e-01 | 0.1733 |
| 1521 | CTSW | LN38 | Human | Oral cavity | OSCC | 1.54e-03 | 3.97e-01 | 0.168 |
| 1521 | CTSW | EOLP-2 | Human | Oral cavity | EOLP | 6.16e-03 | 2.43e-01 | -0.0203 |
| Page: 1 |
| Tissue | Expression Dynamics | Abbreviation |
| Oral Cavity | 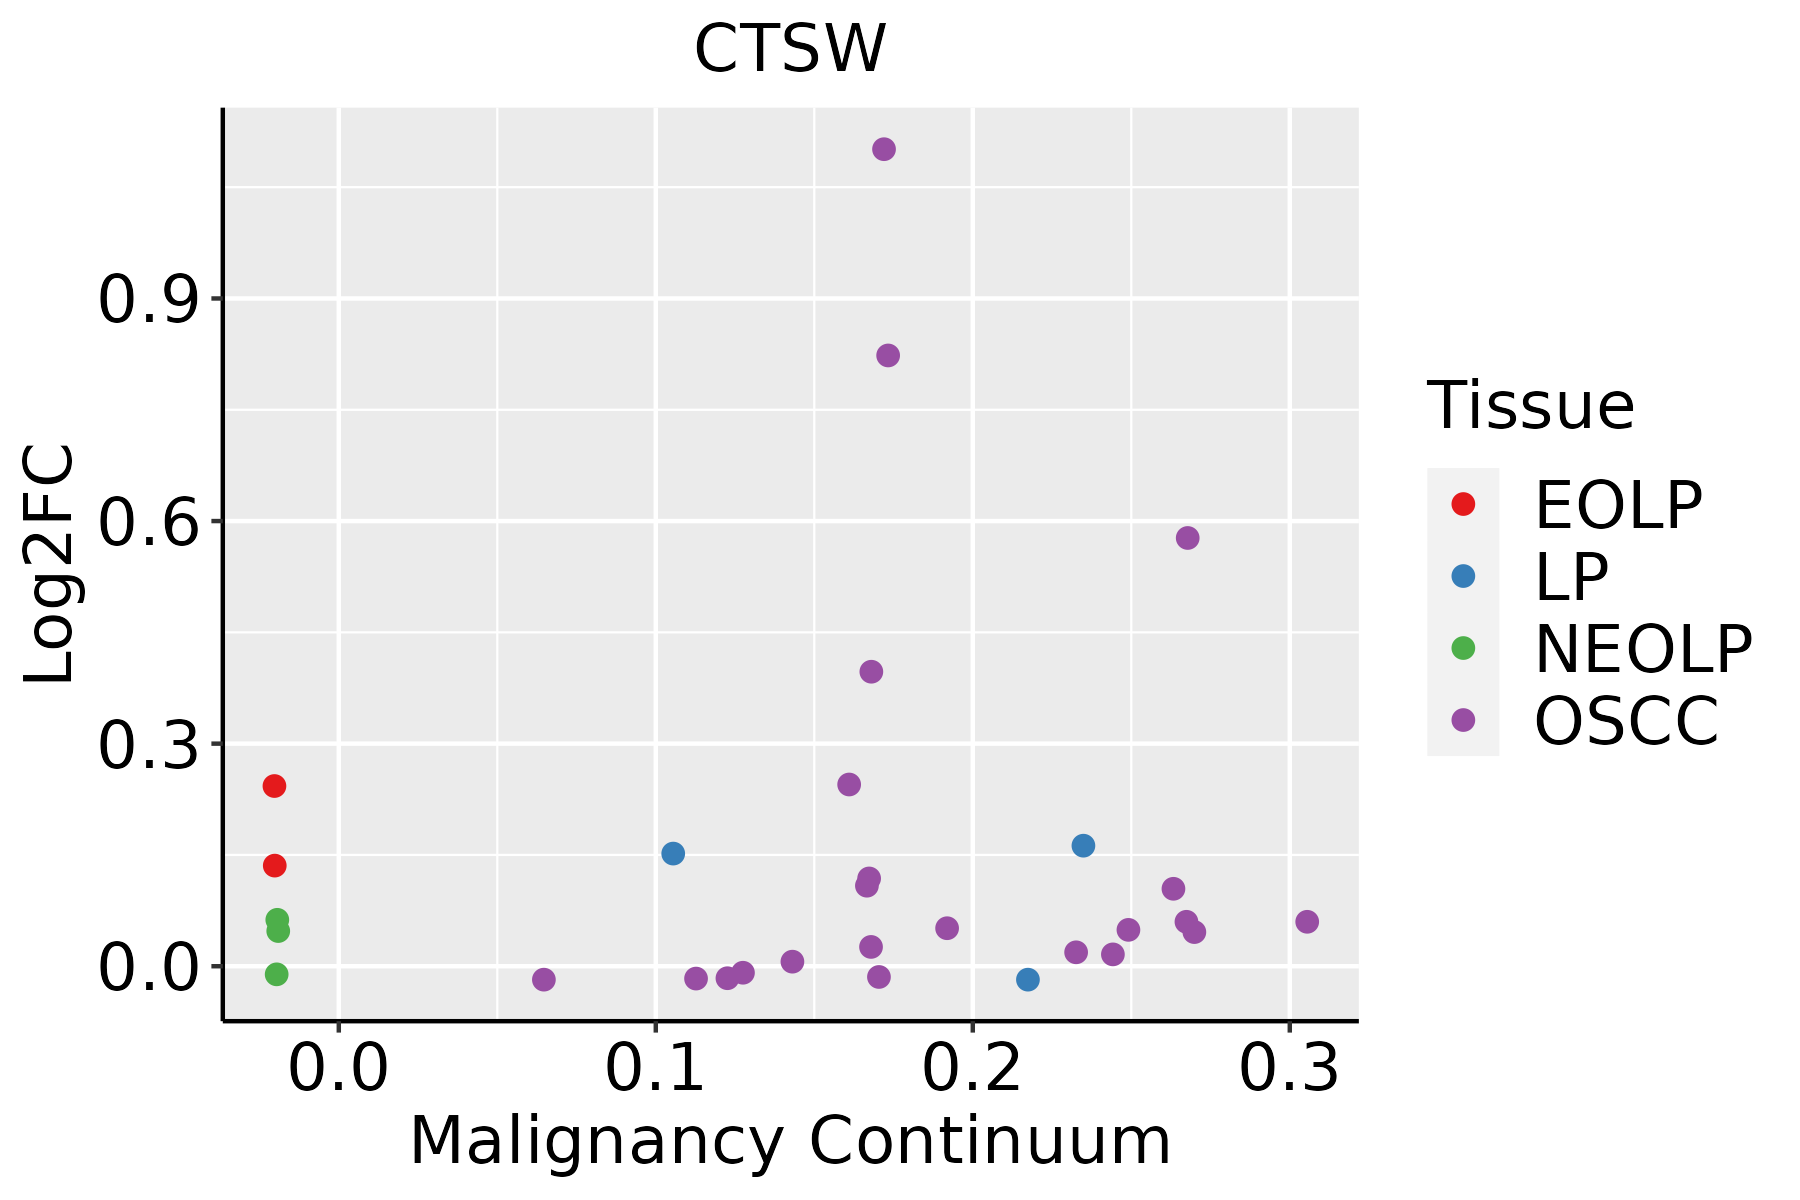 | EOLP: Erosive Oral lichen planus |
| LP: leukoplakia | ||
| NEOLP: Non-erosive oral lichen planus | ||
| OSCC: Oral squamous cell carcinoma |
| ∗log2FC in expression of this searched gene in stem-like cells from each diseased tissue sample relative to stem-like cells in normal samples in each tissue plotted against the malignancy continuum. Samples are colored based on if they are from different disease stage. |
Top |
Malignant transformation related pathway analysis |
| Find out the enriched GO biological processes and KEGG pathways involved in transition from healthy to precancer to cancer |
| Tissue | Disease Stage | Enriched GO biological Processes |
| Colorectum | AD |  |
| Colorectum | SER |  |
| Colorectum | MSS |  |
| Colorectum | MSI-H |  |
| Colorectum | FAP |  |
| ∗Top 15 enriched GO BP terms are showed in the bar plot of each disease state in each tissue. Each row represents a significant GO biological process which is colored according to the -log10(p.adjust). |
| Page: 1 2 3 4 5 6 7 8 9 |
| GO ID | Tissue | Disease Stage | Description | Gene Ratio | Bg Ratio | pvalue | p.adjust | Count |
| Page: 1 |
| Pathway ID | Tissue | Disease Stage | Description | Gene Ratio | Bg Ratio | pvalue | p.adjust | qvalue | Count |
| hsa0421018 | Oral cavity | OSCC | Apoptosis | 101/3704 | 136/8465 | 3.34e-13 | 7.00e-12 | 3.56e-12 | 101 |
| hsa041425 | Oral cavity | OSCC | Lysosome | 87/3704 | 132/8465 | 1.97e-07 | 1.35e-06 | 6.86e-07 | 87 |
| hsa0421019 | Oral cavity | OSCC | Apoptosis | 101/3704 | 136/8465 | 3.34e-13 | 7.00e-12 | 3.56e-12 | 101 |
| hsa0414212 | Oral cavity | OSCC | Lysosome | 87/3704 | 132/8465 | 1.97e-07 | 1.35e-06 | 6.86e-07 | 87 |
| Page: 1 |
Top |
Cell-cell communication analysis |
| Identification of potential cell-cell interactions between two cell types and their ligand-receptor pairs for different disease states |
| Ligand | Receptor | LRpair | Pathway | Tissue | Disease Stage |
| Page: 1 |
Top |
Single-cell gene regulatory network inference analysis |
| Find out the significant the regulons (TFs) and the target genes of each regulon across cell types for different disease states |
| TF | Cell Type | Tissue | Disease Stage | Target Gene | RSS | Regulon Activity |
| ∗The dot plots of a searched regulon are shown for all cell subpopulations in each disease state of each tissue based on the regulon specific score inferred using pySCENIC and by calculating the average expression. |
| Page: 1 |
Top |
Somatic mutation of malignant transformation related genes |
| Annotation of somatic variants for genes involved in malignant transformation |
| Hugo Symbol | Variant Class | Variant Classification | dbSNP RS | HGVSc | HGVSp | HGVSp Short | SWISSPROT | BIOTYPE | SIFT | PolyPhen | Tumor Sample Barcode | Tissue | Histology | Sex | Age | Stage | Therapy Types | Drugs | Outcome |
| CTSW | SNV | Missense_Mutation | rs754243026 | c.592G>A | p.Asp198Asn | p.D198N | P56202 | protein_coding | tolerated(0.1) | benign(0.055) | TCGA-A8-A09B-01 | Breast | breast invasive carcinoma | Female | <65 | III/IV | Chemotherapy | 5-fluorouracil | SD |
| CTSW | SNV | Missense_Mutation | novel | c.489G>T | p.Glu163Asp | p.E163D | P56202 | protein_coding | deleterious(0.01) | probably_damaging(0.995) | TCGA-AA-3949-01 | Colorectum | colon adenocarcinoma | Female | >=65 | III/IV | Unknown | Unknown | SD |
| CTSW | SNV | Missense_Mutation | c.1058G>T | p.Gly353Val | p.G353V | P56202 | protein_coding | deleterious(0) | probably_damaging(0.999) | TCGA-AA-A02K-01 | Colorectum | colon adenocarcinoma | Male | <65 | III/IV | Chemotherapy | folinic | PD | |
| CTSW | SNV | Missense_Mutation | c.419N>T | p.Ala140Val | p.A140V | P56202 | protein_coding | tolerated(0.67) | benign(0.107) | TCGA-AD-6895-01 | Colorectum | colon adenocarcinoma | Male | >=65 | III/IV | Unknown | Unknown | SD | |
| CTSW | SNV | Missense_Mutation | rs377646629 | c.577N>A | p.Gly193Ser | p.G193S | P56202 | protein_coding | deleterious(0) | probably_damaging(0.998) | TCGA-CM-6162-01 | Colorectum | colon adenocarcinoma | Female | <65 | III/IV | Chemotherapy | oxaliplatin | SD |
| CTSW | SNV | Missense_Mutation | c.758N>G | p.Tyr253Cys | p.Y253C | P56202 | protein_coding | deleterious(0.01) | benign(0.1) | TCGA-G4-6304-01 | Colorectum | colon adenocarcinoma | Female | >=65 | I/II | Chemotherapy | fluorouracil | PD | |
| CTSW | SNV | Missense_Mutation | rs760246700 | c.1085N>A | p.Arg362His | p.R362H | P56202 | protein_coding | tolerated(0.36) | possibly_damaging(0.806) | TCGA-G4-6588-01 | Colorectum | colon adenocarcinoma | Female | <65 | I/II | Unknown | Unknown | SD |
| CTSW | deletion | Frame_Shift_Del | c.998delN | p.Ala335ProfsTer34 | p.A335Pfs*34 | P56202 | protein_coding | TCGA-F4-6570-01 | Colorectum | colon adenocarcinoma | Female | >=65 | I/II | Unknown | Unknown | SD | |||
| CTSW | SNV | Missense_Mutation | rs560156512 | c.473N>T | p.Ala158Val | p.A158V | P56202 | protein_coding | tolerated(0.1) | benign(0.177) | TCGA-A5-A0G2-01 | Endometrium | uterine corpus endometrioid carcinoma | Female | <65 | III/IV | Unknown | Unknown | SD |
| CTSW | SNV | Missense_Mutation | rs536157333 | c.802N>T | p.Pro268Ser | p.P268S | P56202 | protein_coding | tolerated(0.19) | benign(0.02) | TCGA-AP-A059-01 | Endometrium | uterine corpus endometrioid carcinoma | Female | >=65 | I/II | Unknown | Unknown | SD |
| Page: 1 2 3 4 5 |
Top |
Related drugs of malignant transformation related genes |
| Identification of chemicals and drugs interact with genes involved in malignant transfromation |
| (DGIdb 4.0) |
| Entrez ID | Symbol | Category | Interaction Types | Drug Claim Name | Drug Name | PMIDs |
| Page: 1 |

Copyright 2023-Present -The University of Texas Health Science Center at Houston |