
|
|||||
|
 | |
| |
| |
| |
| |
| |
|
Gene: CTSV |
Gene summary for CTSV |
| Gene information | Species | Human | Gene symbol | CTSV | Gene ID | 1515 |
| Gene name | cathepsin V | |
| Gene Alias | CATL2 | |
| Cytomap | 9q22.33 | |
| Gene Type | protein-coding | GO ID | GO:0000003 | UniProtAcc | A0A024R141 |
Top |
Malignant transformation analysis |
| Identification of the aberrant gene expression in precancerous and cancerous lesions by comparing the gene expression of stem-like cells in diseased tissues with normal stem cells |
| Entrez ID | Symbol | Replicates | Species | Organ | Tissue | Adj P-value | Log2FC | Malignancy |
| 1515 | CTSV | LZE4T | Human | Esophagus | ESCC | 1.05e-06 | -1.45e-01 | 0.0811 |
| 1515 | CTSV | LZE8T | Human | Esophagus | ESCC | 2.12e-02 | -1.27e-01 | 0.067 |
| 1515 | CTSV | LZE24T | Human | Esophagus | ESCC | 8.32e-11 | 2.47e-03 | 0.0596 |
| 1515 | CTSV | P2T-E | Human | Esophagus | ESCC | 2.51e-14 | 2.51e-02 | 0.1177 |
| 1515 | CTSV | P4T-E | Human | Esophagus | ESCC | 3.27e-07 | 1.86e-01 | 0.1323 |
| 1515 | CTSV | P5T-E | Human | Esophagus | ESCC | 2.75e-09 | -1.27e-01 | 0.1327 |
| 1515 | CTSV | P8T-E | Human | Esophagus | ESCC | 4.98e-14 | -1.66e-01 | 0.0889 |
| 1515 | CTSV | P9T-E | Human | Esophagus | ESCC | 7.02e-06 | 3.84e-01 | 0.1131 |
| 1515 | CTSV | P10T-E | Human | Esophagus | ESCC | 3.10e-59 | 1.51e+00 | 0.116 |
| 1515 | CTSV | P12T-E | Human | Esophagus | ESCC | 3.28e-07 | 6.88e-01 | 0.1122 |
| 1515 | CTSV | P15T-E | Human | Esophagus | ESCC | 1.29e-14 | 5.42e-01 | 0.1149 |
| 1515 | CTSV | P16T-E | Human | Esophagus | ESCC | 3.04e-11 | -6.64e-02 | 0.1153 |
| 1515 | CTSV | P17T-E | Human | Esophagus | ESCC | 1.81e-02 | -1.28e-02 | 0.1278 |
| 1515 | CTSV | P20T-E | Human | Esophagus | ESCC | 3.01e-06 | -2.52e-01 | 0.1124 |
| 1515 | CTSV | P21T-E | Human | Esophagus | ESCC | 5.96e-10 | 4.08e-01 | 0.1617 |
| 1515 | CTSV | P22T-E | Human | Esophagus | ESCC | 3.70e-09 | -8.21e-02 | 0.1236 |
| 1515 | CTSV | P24T-E | Human | Esophagus | ESCC | 4.66e-02 | 7.85e-02 | 0.1287 |
| 1515 | CTSV | P26T-E | Human | Esophagus | ESCC | 9.25e-05 | 1.05e-01 | 0.1276 |
| 1515 | CTSV | P27T-E | Human | Esophagus | ESCC | 4.72e-02 | 1.31e-01 | 0.1055 |
| 1515 | CTSV | P28T-E | Human | Esophagus | ESCC | 1.57e-06 | -4.57e-02 | 0.1149 |
| Page: 1 2 3 4 |
| Tissue | Expression Dynamics | Abbreviation |
| Esophagus |  | ESCC: Esophageal squamous cell carcinoma |
| HGIN: High-grade intraepithelial neoplasias | ||
| LGIN: Low-grade intraepithelial neoplasias | ||
| Liver |  | HCC: Hepatocellular carcinoma |
| NAFLD: Non-alcoholic fatty liver disease | ||
| Oral Cavity | 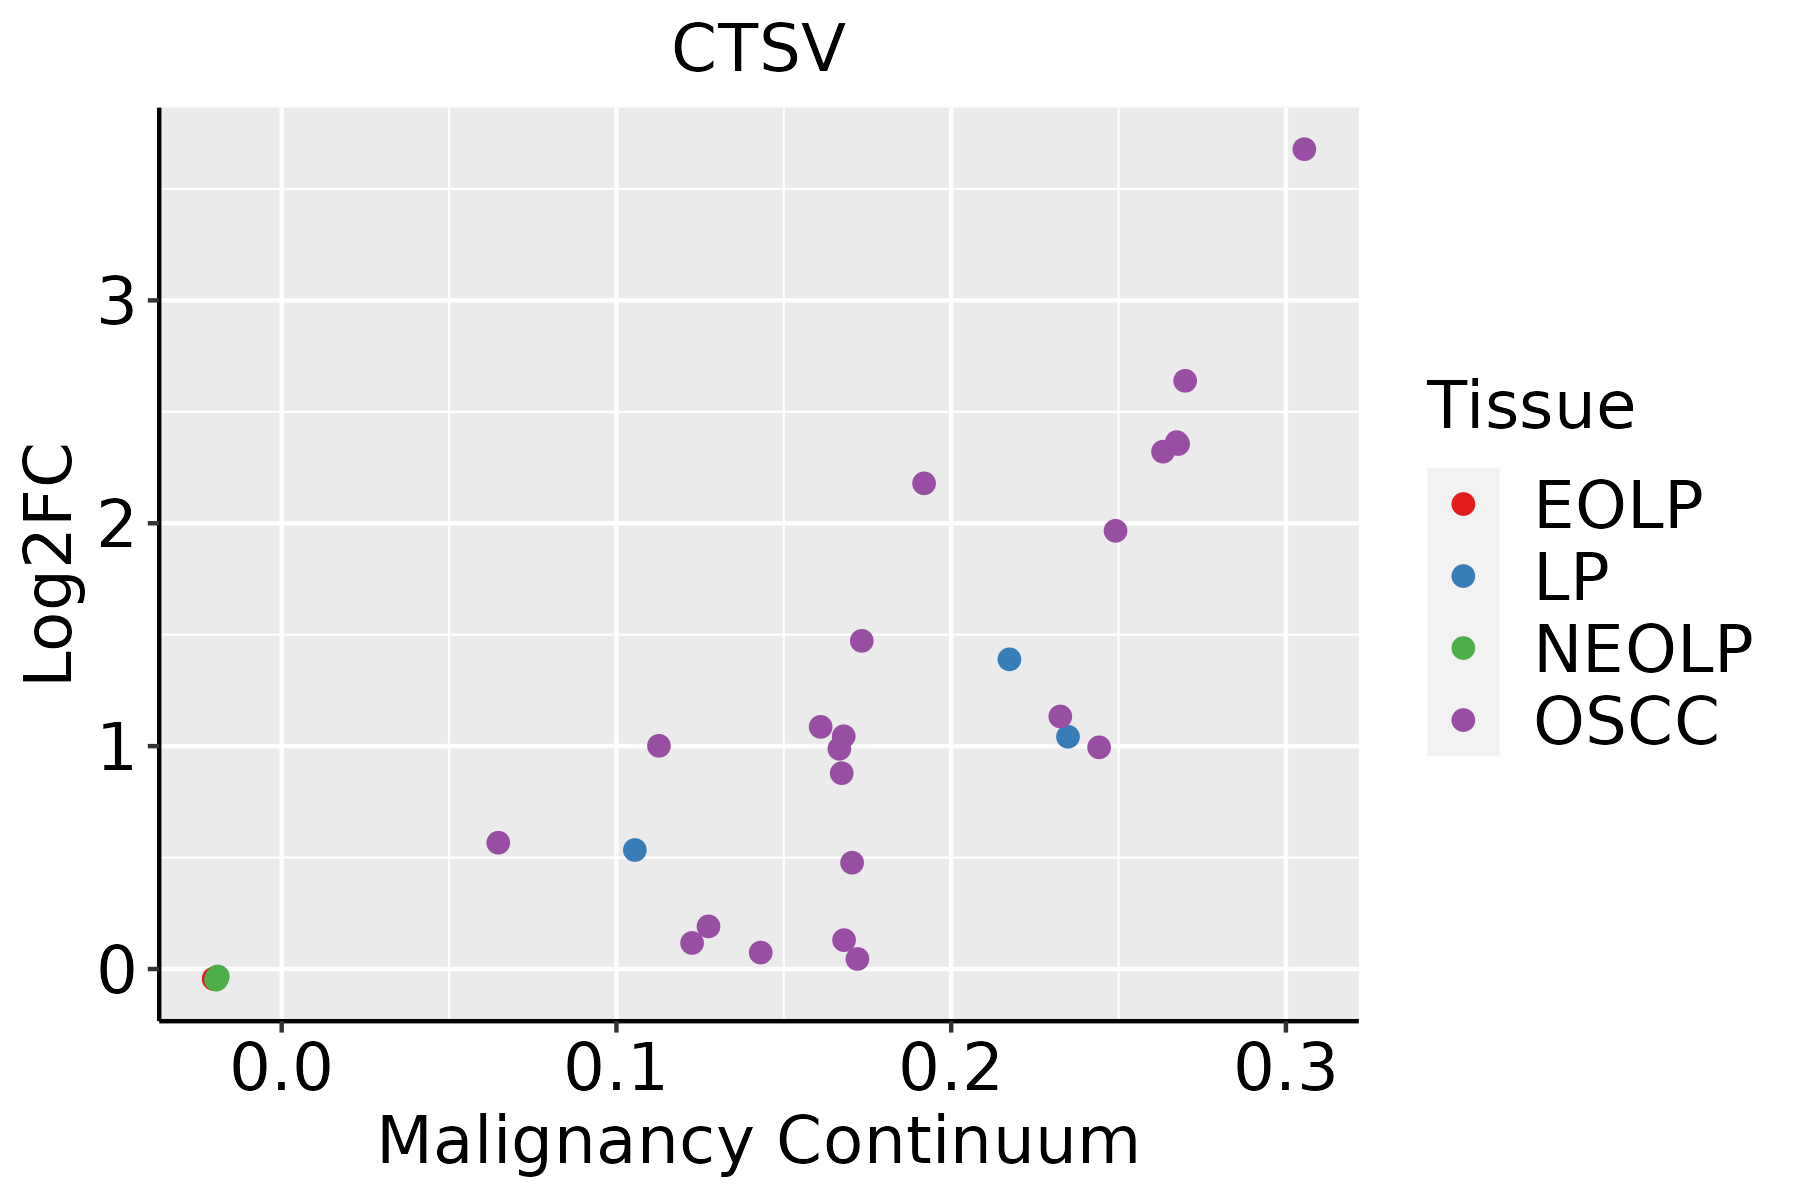 | EOLP: Erosive Oral lichen planus |
| LP: leukoplakia | ||
| NEOLP: Non-erosive oral lichen planus | ||
| OSCC: Oral squamous cell carcinoma | ||
| Skin | 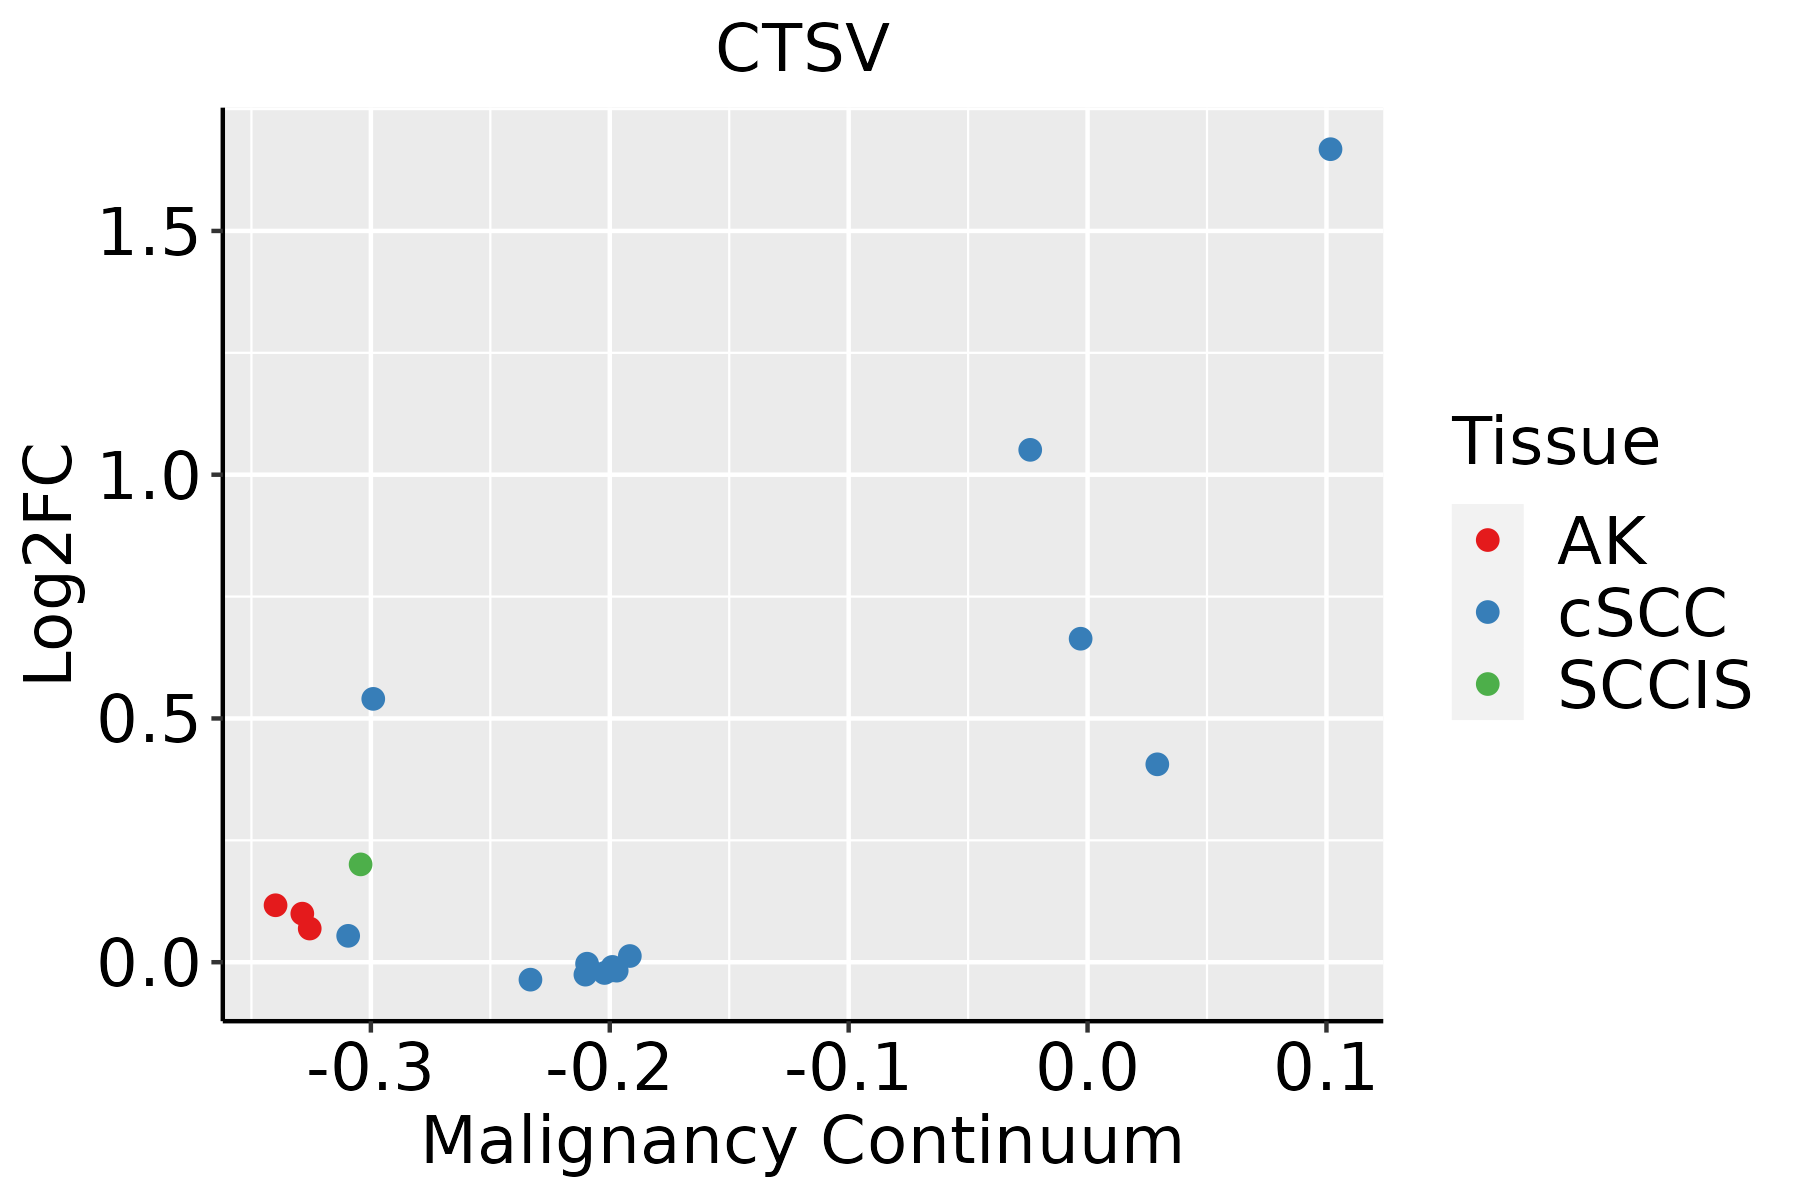 | AK: Actinic keratosis |
| cSCC: Cutaneous squamous cell carcinoma | ||
| SCCIS:squamous cell carcinoma in situ |
| ∗log2FC in expression of this searched gene in stem-like cells from each diseased tissue sample relative to stem-like cells in normal samples in each tissue plotted against the malignancy continuum. Samples are colored based on if they are from different disease stage. |
Top |
Malignant transformation related pathway analysis |
| Find out the enriched GO biological processes and KEGG pathways involved in transition from healthy to precancer to cancer |
| Tissue | Disease Stage | Enriched GO biological Processes |
| Colorectum | AD |  |
| Colorectum | SER |  |
| Colorectum | MSS |  |
| Colorectum | MSI-H |  |
| Colorectum | FAP |  |
| ∗Top 15 enriched GO BP terms are showed in the bar plot of each disease state in each tissue. Each row represents a significant GO biological process which is colored according to the -log10(p.adjust). |
| Page: 1 2 3 4 5 6 7 8 9 |
| GO ID | Tissue | Disease Stage | Description | Gene Ratio | Bg Ratio | pvalue | p.adjust | Count |
| GO:0022411111 | Esophagus | ESCC | cellular component disassembly | 305/8552 | 443/18723 | 1.94e-23 | 4.57e-21 | 305 |
| GO:0071496111 | Esophagus | ESCC | cellular response to external stimulus | 215/8552 | 320/18723 | 4.29e-15 | 2.43e-13 | 215 |
| GO:0031668111 | Esophagus | ESCC | cellular response to extracellular stimulus | 168/8552 | 246/18723 | 4.93e-13 | 2.23e-11 | 168 |
| GO:0031669110 | Esophagus | ESCC | cellular response to nutrient levels | 148/8552 | 215/18723 | 4.58e-12 | 1.76e-10 | 148 |
| GO:0031667111 | Esophagus | ESCC | response to nutrient levels | 289/8552 | 474/18723 | 9.25e-12 | 3.47e-10 | 289 |
| GO:0009267110 | Esophagus | ESCC | cellular response to starvation | 110/8552 | 156/18723 | 2.63e-10 | 7.37e-09 | 110 |
| GO:004259419 | Esophagus | ESCC | response to starvation | 133/8552 | 197/18723 | 4.31e-10 | 1.14e-08 | 133 |
| GO:0001890110 | Esophagus | ESCC | placenta development | 98/8552 | 144/18723 | 4.46e-08 | 8.11e-07 | 98 |
| GO:0048545111 | Esophagus | ESCC | response to steroid hormone | 204/8552 | 339/18723 | 4.47e-08 | 8.11e-07 | 204 |
| GO:0061458110 | Esophagus | ESCC | reproductive system development | 247/8552 | 427/18723 | 2.24e-07 | 3.42e-06 | 247 |
| GO:000756820 | Esophagus | ESCC | aging | 201/8552 | 339/18723 | 2.64e-07 | 3.94e-06 | 201 |
| GO:004860818 | Esophagus | ESCC | reproductive structure development | 245/8552 | 424/18723 | 2.82e-07 | 4.14e-06 | 245 |
| GO:00018937 | Esophagus | ESCC | maternal placenta development | 28/8552 | 35/18723 | 3.40e-05 | 2.78e-04 | 28 |
| GO:004800220 | Esophagus | ESCC | antigen processing and presentation of peptide antigen | 44/8552 | 62/18723 | 4.81e-05 | 3.78e-04 | 44 |
| GO:00301984 | Esophagus | ESCC | extracellular matrix organization | 171/8552 | 301/18723 | 6.08e-05 | 4.67e-04 | 171 |
| GO:00430624 | Esophagus | ESCC | extracellular structure organization | 171/8552 | 302/18723 | 7.73e-05 | 5.76e-04 | 171 |
| GO:00452294 | Esophagus | ESCC | external encapsulating structure organization | 172/8552 | 304/18723 | 7.80e-05 | 5.80e-04 | 172 |
| GO:000247820 | Esophagus | ESCC | antigen processing and presentation of exogenous peptide antigen | 29/8552 | 38/18723 | 1.18e-04 | 8.13e-04 | 29 |
| GO:001988225 | Esophagus | ESCC | antigen processing and presentation | 67/8552 | 106/18723 | 2.03e-04 | 1.28e-03 | 67 |
| GO:00466975 | Esophagus | ESCC | decidualization | 21/8552 | 26/18723 | 2.69e-04 | 1.63e-03 | 21 |
| Page: 1 2 3 4 5 6 7 8 9 |
| Pathway ID | Tissue | Disease Stage | Description | Gene Ratio | Bg Ratio | pvalue | p.adjust | qvalue | Count |
| hsa0414222 | Esophagus | ESCC | Lysosome | 102/4205 | 132/8465 | 5.11e-11 | 7.13e-10 | 3.65e-10 | 102 |
| hsa0421027 | Esophagus | ESCC | Apoptosis | 102/4205 | 136/8465 | 1.05e-09 | 1.21e-08 | 6.21e-09 | 102 |
| hsa0414232 | Esophagus | ESCC | Lysosome | 102/4205 | 132/8465 | 5.11e-11 | 7.13e-10 | 3.65e-10 | 102 |
| hsa0421037 | Esophagus | ESCC | Apoptosis | 102/4205 | 136/8465 | 1.05e-09 | 1.21e-08 | 6.21e-09 | 102 |
| hsa041422 | Liver | HCC | Lysosome | 100/4020 | 132/8465 | 2.32e-11 | 4.31e-10 | 2.40e-10 | 100 |
| hsa042102 | Liver | HCC | Apoptosis | 83/4020 | 136/8465 | 9.51e-04 | 3.58e-03 | 1.99e-03 | 83 |
| hsa041423 | Liver | HCC | Lysosome | 100/4020 | 132/8465 | 2.32e-11 | 4.31e-10 | 2.40e-10 | 100 |
| hsa042103 | Liver | HCC | Apoptosis | 83/4020 | 136/8465 | 9.51e-04 | 3.58e-03 | 1.99e-03 | 83 |
| hsa0421018 | Oral cavity | OSCC | Apoptosis | 101/3704 | 136/8465 | 3.34e-13 | 7.00e-12 | 3.56e-12 | 101 |
| hsa041425 | Oral cavity | OSCC | Lysosome | 87/3704 | 132/8465 | 1.97e-07 | 1.35e-06 | 6.86e-07 | 87 |
| hsa0421019 | Oral cavity | OSCC | Apoptosis | 101/3704 | 136/8465 | 3.34e-13 | 7.00e-12 | 3.56e-12 | 101 |
| hsa0414212 | Oral cavity | OSCC | Lysosome | 87/3704 | 132/8465 | 1.97e-07 | 1.35e-06 | 6.86e-07 | 87 |
| hsa0414221 | Oral cavity | LP | Lysosome | 67/2418 | 132/8465 | 5.13e-08 | 7.77e-07 | 5.01e-07 | 67 |
| hsa0421026 | Oral cavity | LP | Apoptosis | 65/2418 | 136/8465 | 1.33e-06 | 1.48e-05 | 9.53e-06 | 65 |
| hsa0414231 | Oral cavity | LP | Lysosome | 67/2418 | 132/8465 | 5.13e-08 | 7.77e-07 | 5.01e-07 | 67 |
| hsa0421036 | Oral cavity | LP | Apoptosis | 65/2418 | 136/8465 | 1.33e-06 | 1.48e-05 | 9.53e-06 | 65 |
| Page: 1 |
Top |
Cell-cell communication analysis |
| Identification of potential cell-cell interactions between two cell types and their ligand-receptor pairs for different disease states |
| Ligand | Receptor | LRpair | Pathway | Tissue | Disease Stage |
| Page: 1 |
Top |
Single-cell gene regulatory network inference analysis |
| Find out the significant the regulons (TFs) and the target genes of each regulon across cell types for different disease states |
| TF | Cell Type | Tissue | Disease Stage | Target Gene | RSS | Regulon Activity |
| ∗The dot plots of a searched regulon are shown for all cell subpopulations in each disease state of each tissue based on the regulon specific score inferred using pySCENIC and by calculating the average expression. |
| Page: 1 |
Top |
Somatic mutation of malignant transformation related genes |
| Annotation of somatic variants for genes involved in malignant transformation |
| Hugo Symbol | Variant Class | Variant Classification | dbSNP RS | HGVSc | HGVSp | HGVSp Short | SWISSPROT | BIOTYPE | SIFT | PolyPhen | Tumor Sample Barcode | Tissue | Histology | Sex | Age | Stage | Therapy Types | Drugs | Outcome |
| CTSV | SNV | Missense_Mutation | c.511C>T | p.Arg171Cys | p.R171C | O60911 | protein_coding | deleterious(0.04) | possibly_damaging(0.882) | TCGA-AO-A128-01 | Breast | breast invasive carcinoma | Female | <65 | I/II | Chemotherapy | doxorubicin | SD | |
| CTSV | SNV | Missense_Mutation | c.539G>C | p.Gly180Ala | p.G180A | O60911 | protein_coding | deleterious(0.01) | probably_damaging(1) | TCGA-B6-A0RH-01 | Breast | breast invasive carcinoma | Female | <65 | I/II | Unknown | Unknown | PD | |
| CTSV | SNV | Missense_Mutation | rs149543665 | c.721N>A | p.Ala241Thr | p.A241T | O60911 | protein_coding | deleterious(0.01) | possibly_damaging(0.8) | TCGA-EW-A1IZ-01 | Breast | breast invasive carcinoma | Female | <65 | III/IV | Chemotherapy | taxotere | SD |
| CTSV | SNV | Missense_Mutation | novel | c.313N>T | p.Val105Leu | p.V105L | O60911 | protein_coding | tolerated(0.69) | benign(0) | TCGA-2W-A8YY-01 | Cervix | cervical & endocervical cancer | Female | <65 | I/II | Chemotherapy | cisplatin | CR |
| CTSV | SNV | Missense_Mutation | c.916G>C | p.Glu306Gln | p.E306Q | O60911 | protein_coding | tolerated(0.47) | benign(0.018) | TCGA-C5-A1BI-01 | Cervix | cervical & endocervical cancer | Female | <65 | III/IV | Chemotherapy | cisplatin | SD | |
| CTSV | SNV | Missense_Mutation | c.479N>T | p.Ser160Leu | p.S160L | O60911 | protein_coding | deleterious(0.02) | probably_damaging(0.97) | TCGA-R2-A69V-01 | Cervix | cervical & endocervical cancer | Female | <65 | I/II | Chemotherapy | cisplatin | SD | |
| CTSV | SNV | Missense_Mutation | c.162G>T | p.Lys54Asn | p.K54N | O60911 | protein_coding | tolerated(0.11) | benign(0.418) | TCGA-CA-6717-01 | Colorectum | colon adenocarcinoma | Male | <65 | I/II | Chemotherapy | oxaliplatin | CR | |
| CTSV | SNV | Missense_Mutation | novel | c.648N>T | p.Glu216Asp | p.E216D | O60911 | protein_coding | tolerated(0.13) | benign(0.131) | TCGA-AG-A002-01 | Colorectum | rectum adenocarcinoma | Male | <65 | I/II | Unknown | Unknown | SD |
| CTSV | SNV | Missense_Mutation | c.167N>G | p.Met56Arg | p.M56R | O60911 | protein_coding | tolerated(0.13) | benign(0.03) | TCGA-AG-A025-01 | Colorectum | rectum adenocarcinoma | Female | <65 | I/II | Unknown | Unknown | SD | |
| CTSV | SNV | Missense_Mutation | rs757644240 | c.487N>A | p.Glu163Lys | p.E163K | O60911 | protein_coding | deleterious(0.04) | probably_damaging(0.987) | TCGA-F5-6814-01 | Colorectum | rectum adenocarcinoma | Male | <65 | I/II | Unknown | Unknown | SD |
| Page: 1 2 3 4 5 |
Top |
Related drugs of malignant transformation related genes |
| Identification of chemicals and drugs interact with genes involved in malignant transfromation |
| (DGIdb 4.0) |
| Entrez ID | Symbol | Category | Interaction Types | Drug Claim Name | Drug Name | PMIDs |
| 1515 | CTSV | ENZYME, DRUGGABLE GENOME, PROTEASE | inhibitor | 252166762 | CITIBRASINE | |
| 1515 | CTSV | ENZYME, DRUGGABLE GENOME, PROTEASE | inhibitor | 363894149 | PETESICATIB | |
| 1515 | CTSV | ENZYME, DRUGGABLE GENOME, PROTEASE | PMID27998201-Compound-12 | |||
| 1515 | CTSV | ENZYME, DRUGGABLE GENOME, PROTEASE | inhibitor | 405067337 |
| Page: 1 |

Copyright 2023-Present -The University of Texas Health Science Center at Houston |