
|
|||||
|
 | |
| |
| |
| |
| |
| |
|
Gene: CTSS |
Gene summary for CTSS |
| Gene information | Species | Human | Gene symbol | CTSS | Gene ID | 1520 |
| Gene name | cathepsin S | |
| Gene Alias | CTSS | |
| Cytomap | 1q21.3 | |
| Gene Type | protein-coding | GO ID | GO:0002221 | UniProtAcc | P25774 |
Top |
Malignant transformation analysis |
| Identification of the aberrant gene expression in precancerous and cancerous lesions by comparing the gene expression of stem-like cells in diseased tissues with normal stem cells |
| Entrez ID | Symbol | Replicates | Species | Organ | Tissue | Adj P-value | Log2FC | Malignancy |
| 1520 | CTSS | CA_HPV_1 | Human | Cervix | CC | 5.74e-23 | 8.57e-01 | 0.0264 |
| 1520 | CTSS | HSIL_HPV_1 | Human | Cervix | HSIL_HPV | 6.75e-04 | 5.12e-01 | 0.0116 |
| 1520 | CTSS | HSIL_HPV_2 | Human | Cervix | HSIL_HPV | 1.20e-02 | 4.21e-01 | 0.0208 |
| 1520 | CTSS | N_HPV_2 | Human | Cervix | N_HPV | 6.07e-07 | 6.21e-01 | -0.0131 |
| 1520 | CTSS | CCII_1 | Human | Cervix | CC | 1.44e-08 | -6.03e-01 | 0.3249 |
| 1520 | CTSS | Tumor | Human | Cervix | CC | 4.96e-12 | -5.22e-01 | 0.1241 |
| 1520 | CTSS | sample3 | Human | Cervix | CC | 6.39e-12 | -4.96e-01 | 0.1387 |
| 1520 | CTSS | H2 | Human | Cervix | HSIL_HPV | 2.34e-02 | -2.51e-01 | 0.0632 |
| 1520 | CTSS | T1 | Human | Cervix | CC | 4.26e-06 | -3.56e-01 | 0.0918 |
| 1520 | CTSS | T3 | Human | Cervix | CC | 3.05e-14 | -5.26e-01 | 0.1389 |
| 1520 | CTSS | HTA11_2487_2000001011 | Human | Colorectum | SER | 9.09e-09 | 6.62e-01 | -0.1808 |
| 1520 | CTSS | HTA11_1938_2000001011 | Human | Colorectum | AD | 5.51e-13 | 8.10e-01 | -0.0811 |
| 1520 | CTSS | HTA11_78_2000001011 | Human | Colorectum | AD | 4.13e-10 | 7.97e-01 | -0.1088 |
| 1520 | CTSS | HTA11_347_2000001011 | Human | Colorectum | AD | 2.87e-58 | 1.54e+00 | -0.1954 |
| 1520 | CTSS | HTA11_411_2000001011 | Human | Colorectum | SER | 5.28e-07 | 1.07e+00 | -0.2602 |
| 1520 | CTSS | HTA11_83_2000001011 | Human | Colorectum | SER | 2.92e-08 | 8.16e-01 | -0.1526 |
| 1520 | CTSS | HTA11_696_2000001011 | Human | Colorectum | AD | 1.11e-11 | 7.42e-01 | -0.1464 |
| 1520 | CTSS | HTA11_866_2000001011 | Human | Colorectum | AD | 5.67e-05 | 4.66e-01 | -0.1001 |
| 1520 | CTSS | HTA11_1391_2000001011 | Human | Colorectum | AD | 1.44e-11 | 7.62e-01 | -0.059 |
| 1520 | CTSS | HTA11_5212_2000001011 | Human | Colorectum | AD | 1.08e-09 | 1.07e+00 | -0.2061 |
| Page: 1 2 3 4 5 6 7 |
| Tissue | Expression Dynamics | Abbreviation |
| Cervix |  | CC: Cervix cancer |
| HSIL_HPV: HPV-infected high-grade squamous intraepithelial lesions | ||
| N_HPV: HPV-infected normal cervix | ||
| Colorectum (GSE201348) |  | FAP: Familial adenomatous polyposis |
| CRC: Colorectal cancer | ||
| Colorectum (HTA11) |  | AD: Adenomas |
| SER: Sessile serrated lesions | ||
| MSI-H: Microsatellite-high colorectal cancer | ||
| MSS: Microsatellite stable colorectal cancer | ||
| Esophagus |  | ESCC: Esophageal squamous cell carcinoma |
| HGIN: High-grade intraepithelial neoplasias | ||
| LGIN: Low-grade intraepithelial neoplasias | ||
| Liver |  | HCC: Hepatocellular carcinoma |
| NAFLD: Non-alcoholic fatty liver disease | ||
| Oral Cavity |  | EOLP: Erosive Oral lichen planus |
| LP: leukoplakia | ||
| NEOLP: Non-erosive oral lichen planus | ||
| OSCC: Oral squamous cell carcinoma | ||
| Prostate | 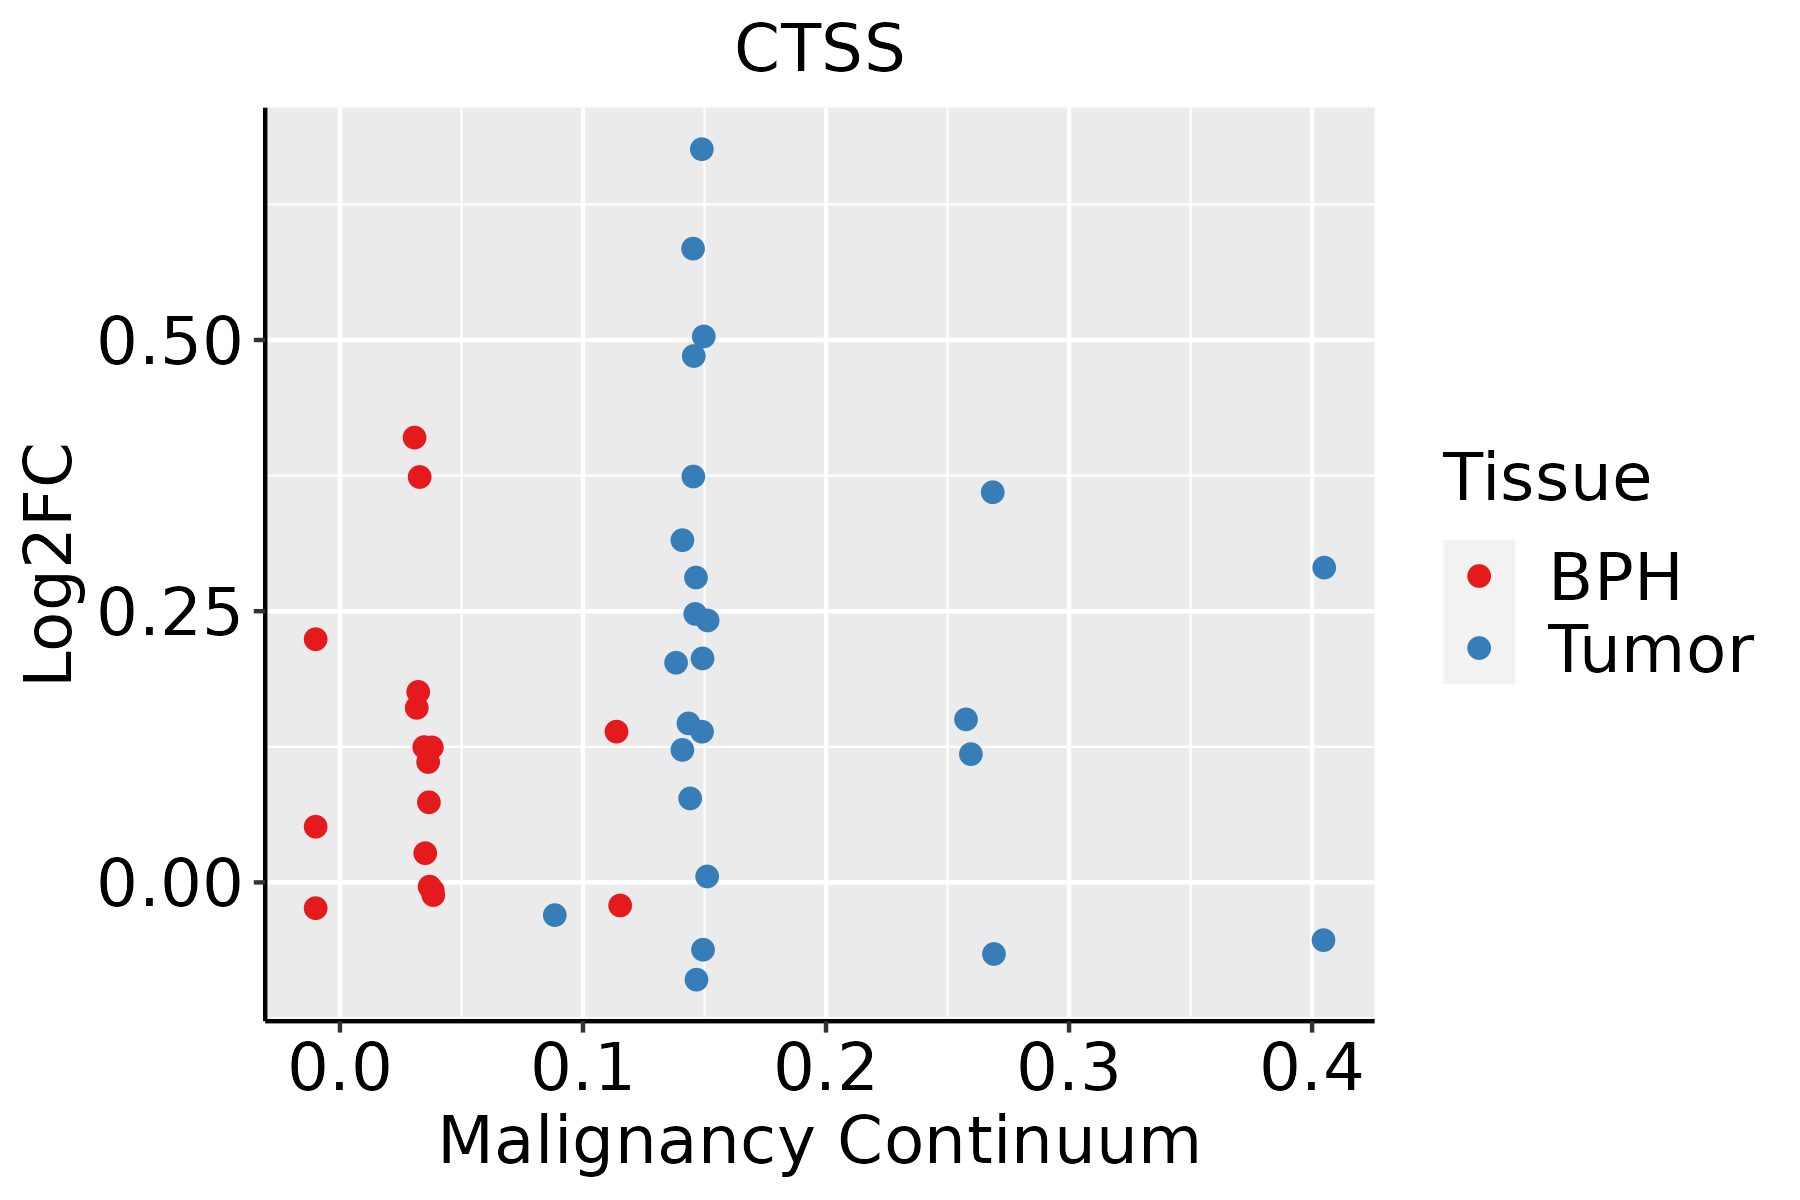 | BPH: Benign Prostatic Hyperplasia |
| Thyroid | 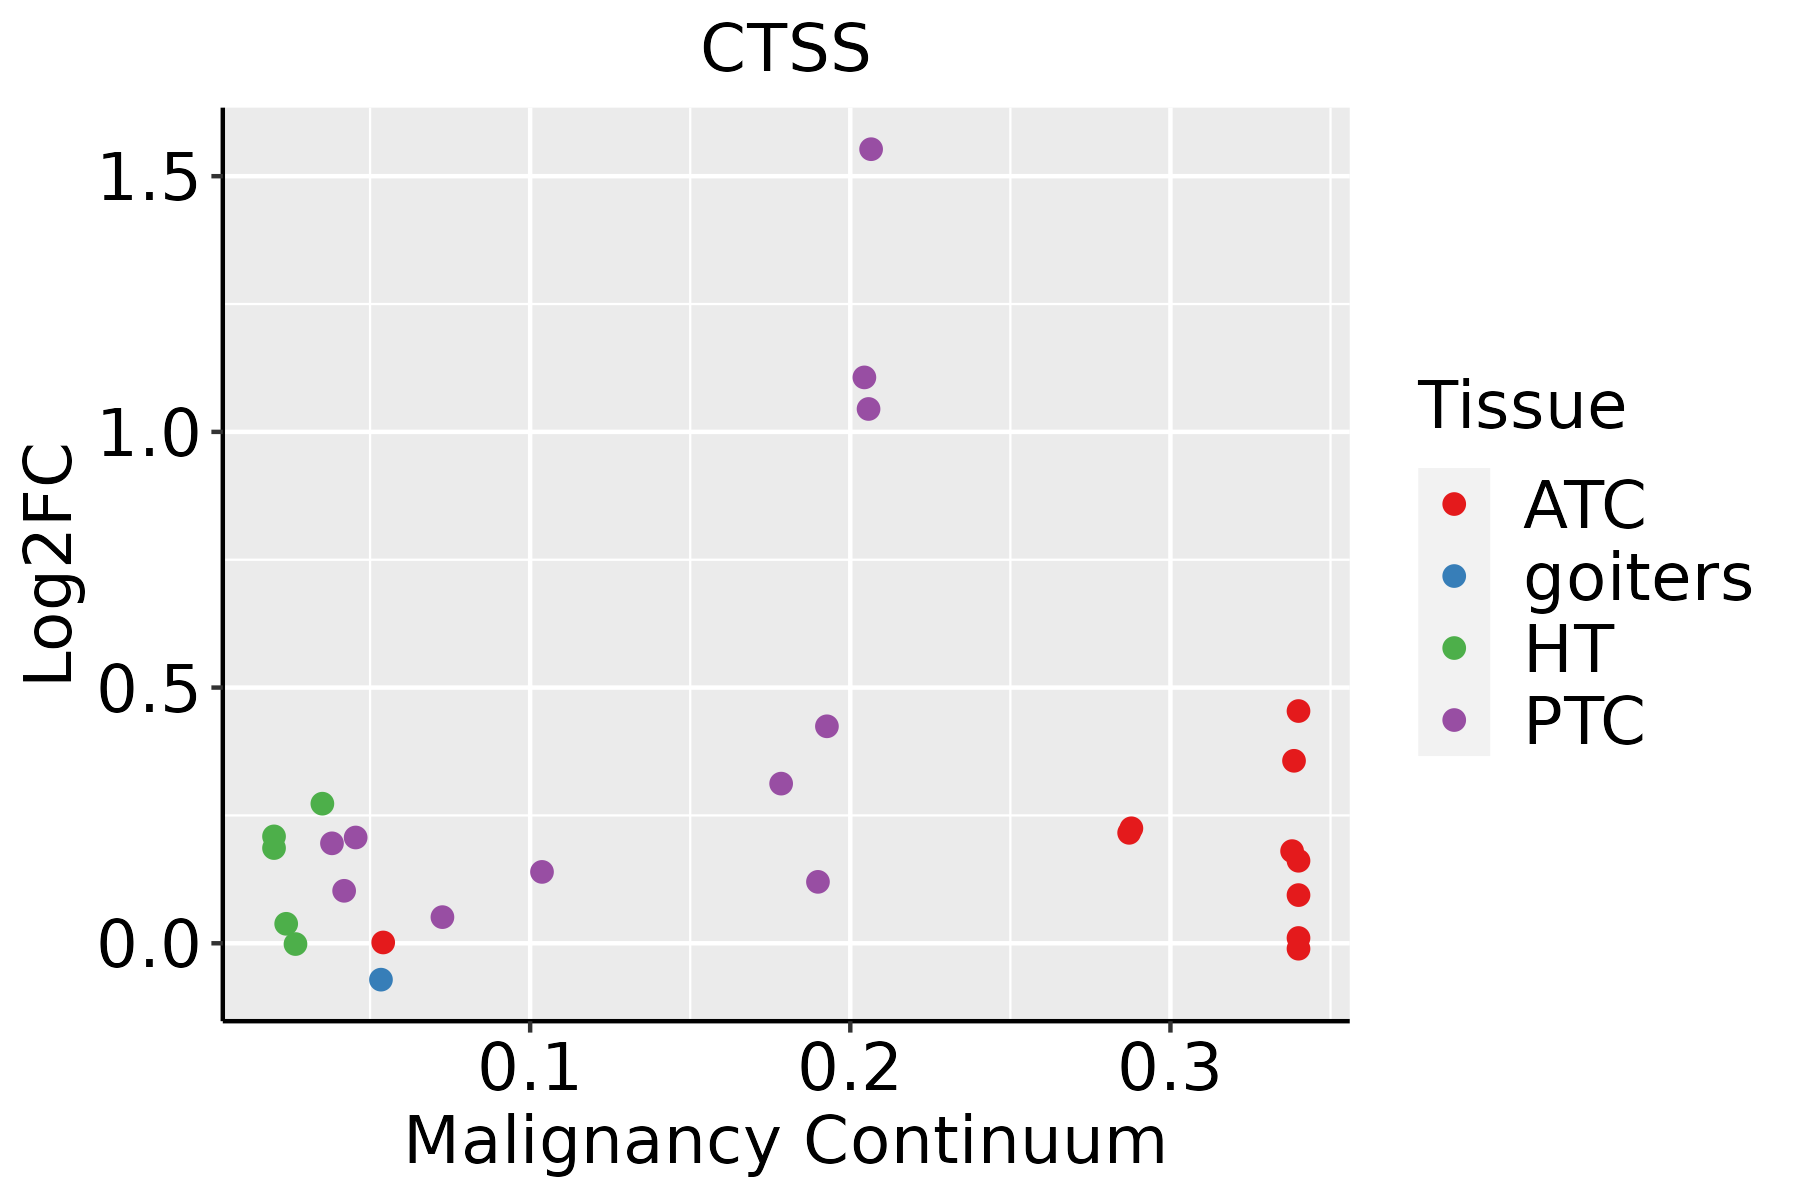 | ATC: Anaplastic thyroid cancer |
| HT: Hashimoto's thyroiditis | ||
| PTC: Papillary thyroid cancer |
| ∗log2FC in expression of this searched gene in stem-like cells from each diseased tissue sample relative to stem-like cells in normal samples in each tissue plotted against the malignancy continuum. Samples are colored based on if they are from different disease stage. |
Top |
Malignant transformation related pathway analysis |
| Find out the enriched GO biological processes and KEGG pathways involved in transition from healthy to precancer to cancer |
| Tissue | Disease Stage | Enriched GO biological Processes |
| Colorectum | AD |  |
| Colorectum | SER |  |
| Colorectum | MSS |  |
| Colorectum | MSI-H |  |
| Colorectum | FAP |  |
| ∗Top 15 enriched GO BP terms are showed in the bar plot of each disease state in each tissue. Each row represents a significant GO biological process which is colored according to the -log10(p.adjust). |
| Page: 1 2 3 4 5 6 7 8 9 |
| GO ID | Tissue | Disease Stage | Description | Gene Ratio | Bg Ratio | pvalue | p.adjust | Count |
| GO:000247810 | Cervix | CC | antigen processing and presentation of exogenous peptide antigen | 18/2311 | 38/18723 | 1.20e-07 | 6.06e-06 | 18 |
| GO:004800210 | Cervix | CC | antigen processing and presentation of peptide antigen | 24/2311 | 62/18723 | 1.21e-07 | 6.07e-06 | 24 |
| GO:00027644 | Cervix | CC | immune response-regulating signaling pathway | 97/2311 | 468/18723 | 1.49e-07 | 7.07e-06 | 97 |
| GO:001988410 | Cervix | CC | antigen processing and presentation of exogenous antigen | 20/2311 | 47/18723 | 2.18e-07 | 9.57e-06 | 20 |
| GO:001988210 | Cervix | CC | antigen processing and presentation | 32/2311 | 106/18723 | 8.61e-07 | 3.08e-05 | 32 |
| GO:00025048 | Cervix | CC | antigen processing and presentation of peptide or polysaccharide antigen via MHC class II | 16/2311 | 36/18723 | 1.76e-06 | 5.76e-05 | 16 |
| GO:00198869 | Cervix | CC | antigen processing and presentation of exogenous peptide antigen via MHC class II | 14/2311 | 30/18723 | 3.85e-06 | 1.01e-04 | 14 |
| GO:00024958 | Cervix | CC | antigen processing and presentation of peptide antigen via MHC class II | 15/2311 | 34/18723 | 4.16e-06 | 1.08e-04 | 15 |
| GO:002241110 | Cervix | CC | cellular component disassembly | 83/2311 | 443/18723 | 6.04e-05 | 8.68e-04 | 83 |
| GO:00022212 | Cervix | CC | pattern recognition receptor signaling pathway | 39/2311 | 172/18723 | 1.08e-04 | 1.38e-03 | 39 |
| GO:00516048 | Cervix | CC | protein maturation | 56/2311 | 294/18723 | 5.90e-04 | 5.59e-03 | 56 |
| GO:00347645 | Cervix | CC | positive regulation of transmembrane transport | 40/2311 | 219/18723 | 6.97e-03 | 3.76e-02 | 40 |
| GO:0030198 | Cervix | CC | extracellular matrix organization | 52/2311 | 301/18723 | 7.43e-03 | 3.98e-02 | 52 |
| GO:0043062 | Cervix | CC | extracellular structure organization | 52/2311 | 302/18723 | 7.92e-03 | 4.17e-02 | 52 |
| GO:0022617 | Cervix | CC | extracellular matrix disassembly | 15/2311 | 63/18723 | 8.52e-03 | 4.40e-02 | 15 |
| GO:0045229 | Cervix | CC | external encapsulating structure organization | 52/2311 | 304/18723 | 9.00e-03 | 4.57e-02 | 52 |
| GO:00717112 | Cervix | CC | basement membrane organization | 9/2311 | 31/18723 | 1.04e-02 | 4.97e-02 | 9 |
| GO:000249514 | Cervix | HSIL_HPV | antigen processing and presentation of peptide antigen via MHC class II | 14/737 | 34/18723 | 1.27e-11 | 6.81e-09 | 14 |
| GO:001988614 | Cervix | HSIL_HPV | antigen processing and presentation of exogenous peptide antigen via MHC class II | 13/737 | 30/18723 | 3.16e-11 | 1.41e-08 | 13 |
| GO:000250414 | Cervix | HSIL_HPV | antigen processing and presentation of peptide or polysaccharide antigen via MHC class II | 14/737 | 36/18723 | 3.22e-11 | 1.41e-08 | 14 |
| Page: 1 2 3 4 5 6 7 8 9 10 11 |
| Pathway ID | Tissue | Disease Stage | Description | Gene Ratio | Bg Ratio | pvalue | p.adjust | qvalue | Count |
| hsa0461220 | Cervix | CC | Antigen processing and presentation | 34/1267 | 78/8465 | 1.06e-09 | 2.14e-08 | 1.26e-08 | 34 |
| hsa0414520 | Cervix | CC | Phagosome | 47/1267 | 152/8465 | 3.95e-07 | 4.26e-06 | 2.52e-06 | 47 |
| hsa042109 | Cervix | CC | Apoptosis | 36/1267 | 136/8465 | 3.21e-04 | 1.68e-03 | 9.91e-04 | 36 |
| hsa05152 | Cervix | CC | Tuberculosis | 42/1267 | 180/8465 | 1.78e-03 | 7.21e-03 | 4.26e-03 | 42 |
| hsa04612110 | Cervix | CC | Antigen processing and presentation | 34/1267 | 78/8465 | 1.06e-09 | 2.14e-08 | 1.26e-08 | 34 |
| hsa04145110 | Cervix | CC | Phagosome | 47/1267 | 152/8465 | 3.95e-07 | 4.26e-06 | 2.52e-06 | 47 |
| hsa0421014 | Cervix | CC | Apoptosis | 36/1267 | 136/8465 | 3.21e-04 | 1.68e-03 | 9.91e-04 | 36 |
| hsa051521 | Cervix | CC | Tuberculosis | 42/1267 | 180/8465 | 1.78e-03 | 7.21e-03 | 4.26e-03 | 42 |
| hsa0461224 | Cervix | HSIL_HPV | Antigen processing and presentation | 21/459 | 78/8465 | 5.10e-10 | 3.74e-08 | 3.02e-08 | 21 |
| hsa0414523 | Cervix | HSIL_HPV | Phagosome | 27/459 | 152/8465 | 3.58e-08 | 1.50e-06 | 1.21e-06 | 27 |
| hsa0421023 | Cervix | HSIL_HPV | Apoptosis | 16/459 | 136/8465 | 2.74e-03 | 1.78e-02 | 1.44e-02 | 16 |
| hsa051522 | Cervix | HSIL_HPV | Tuberculosis | 19/459 | 180/8465 | 3.99e-03 | 2.39e-02 | 1.93e-02 | 19 |
| hsa0461234 | Cervix | HSIL_HPV | Antigen processing and presentation | 21/459 | 78/8465 | 5.10e-10 | 3.74e-08 | 3.02e-08 | 21 |
| hsa0414533 | Cervix | HSIL_HPV | Phagosome | 27/459 | 152/8465 | 3.58e-08 | 1.50e-06 | 1.21e-06 | 27 |
| hsa0421033 | Cervix | HSIL_HPV | Apoptosis | 16/459 | 136/8465 | 2.74e-03 | 1.78e-02 | 1.44e-02 | 16 |
| hsa051523 | Cervix | HSIL_HPV | Tuberculosis | 19/459 | 180/8465 | 3.99e-03 | 2.39e-02 | 1.93e-02 | 19 |
| hsa0461243 | Cervix | N_HPV | Antigen processing and presentation | 20/349 | 78/8465 | 2.61e-11 | 1.42e-09 | 1.11e-09 | 20 |
| hsa0414542 | Cervix | N_HPV | Phagosome | 24/349 | 152/8465 | 1.17e-08 | 2.88e-07 | 2.25e-07 | 24 |
| hsa0421042 | Cervix | N_HPV | Apoptosis | 14/349 | 136/8465 | 1.40e-03 | 9.06e-03 | 7.08e-03 | 14 |
| hsa051524 | Cervix | N_HPV | Tuberculosis | 16/349 | 180/8465 | 3.05e-03 | 1.73e-02 | 1.35e-02 | 16 |
| Page: 1 2 3 4 5 |
Top |
Cell-cell communication analysis |
| Identification of potential cell-cell interactions between two cell types and their ligand-receptor pairs for different disease states |
| Ligand | Receptor | LRpair | Pathway | Tissue | Disease Stage |
| Page: 1 |
Top |
Single-cell gene regulatory network inference analysis |
| Find out the significant the regulons (TFs) and the target genes of each regulon across cell types for different disease states |
| TF | Cell Type | Tissue | Disease Stage | Target Gene | RSS | Regulon Activity |
| ∗The dot plots of a searched regulon are shown for all cell subpopulations in each disease state of each tissue based on the regulon specific score inferred using pySCENIC and by calculating the average expression. |
| Page: 1 |
Top |
Somatic mutation of malignant transformation related genes |
| Annotation of somatic variants for genes involved in malignant transformation |
| Hugo Symbol | Variant Class | Variant Classification | dbSNP RS | HGVSc | HGVSp | HGVSp Short | SWISSPROT | BIOTYPE | SIFT | PolyPhen | Tumor Sample Barcode | Tissue | Histology | Sex | Age | Stage | Therapy Types | Drugs | Outcome |
| CTSS | SNV | Missense_Mutation | c.857G>A | p.Gly286Asp | p.G286D | P25774 | protein_coding | deleterious(0.01) | probably_damaging(0.999) | TCGA-A2-A0D2-01 | Breast | breast invasive carcinoma | Female | <65 | I/II | Chemotherapy | adriamycin | SD | |
| CTSS | SNV | Missense_Mutation | c.580N>A | p.Asp194Asn | p.D194N | P25774 | protein_coding | tolerated(0.06) | possibly_damaging(0.796) | TCGA-A2-A0EY-01 | Breast | breast invasive carcinoma | Female | <65 | I/II | Chemotherapy | adriamycin | SD | |
| CTSS | SNV | Missense_Mutation | novel | c.276N>T | p.Met92Ile | p.M92I | P25774 | protein_coding | deleterious(0.02) | benign(0.018) | TCGA-A2-A0YK-01 | Breast | breast invasive carcinoma | Female | <65 | I/II | Chemotherapy | cytoxan | SD |
| CTSS | SNV | Missense_Mutation | novel | c.785N>G | p.Tyr262Cys | p.Y262C | P25774 | protein_coding | deleterious(0) | probably_damaging(0.999) | TCGA-B6-A400-01 | Breast | breast invasive carcinoma | Female | <65 | III/IV | Unknown | Unknown | SD |
| CTSS | SNV | Missense_Mutation | c.706G>C | p.Asp236His | p.D236H | P25774 | protein_coding | tolerated(0.21) | benign(0.041) | TCGA-D8-A1J8-01 | Breast | breast invasive carcinoma | Female | >=65 | I/II | Hormone Therapy | nolvadex | SD | |
| CTSS | SNV | Missense_Mutation | rs775378248 | c.678N>T | p.Lys226Asn | p.K226N | P25774 | protein_coding | deleterious(0.02) | benign(0.371) | TCGA-E2-A14N-01 | Breast | breast invasive carcinoma | Female | <65 | I/II | Chemotherapy | cyclophosphamide | SD |
| CTSS | insertion | Nonsense_Mutation | novel | c.314_315insGGAGTGTAAGGGAATTGAATAGAATGAATCCGAATG | p.Ile105delinsMetGluCysLysGlyIleGluTerAsnGluSerGluCys | p.I105delinsMECKGIE*NESEC | P25774 | protein_coding | TCGA-BH-A0EE-01 | Breast | breast invasive carcinoma | Female | >=65 | I/II | Chemotherapy | docetaxel | SD | ||
| CTSS | SNV | Missense_Mutation | c.631N>G | p.Gln211Glu | p.Q211E | P25774 | protein_coding | tolerated(0.8) | benign(0.001) | TCGA-DR-A0ZM-01 | Cervix | cervical & endocervical cancer | Female | <65 | III/IV | Unspecific | Cisplatin | SD | |
| CTSS | SNV | Missense_Mutation | c.360N>A | p.Asp120Glu | p.D120E | P25774 | protein_coding | deleterious(0) | probably_damaging(0.951) | TCGA-EK-A2RN-01 | Cervix | cervical & endocervical cancer | Female | <65 | I/II | Unknown | Unknown | SD | |
| CTSS | SNV | Missense_Mutation | c.919N>C | p.Glu307Gln | p.E307Q | P25774 | protein_coding | tolerated(0.78) | benign(0.001) | TCGA-EK-A3GK-01 | Cervix | cervical & endocervical cancer | Female | <65 | I/II | Unknown | Unknown | SD |
| Page: 1 2 3 4 5 |
Top |
Related drugs of malignant transformation related genes |
| Identification of chemicals and drugs interact with genes involved in malignant transfromation |
| (DGIdb 4.0) |
| Entrez ID | Symbol | Category | Interaction Types | Drug Claim Name | Drug Name | PMIDs |
| 1520 | CTSS | DRUGGABLE GENOME, PROTEASE, ENZYME | PMID27998201-Compound-7 | |||
| 1520 | CTSS | DRUGGABLE GENOME, PROTEASE, ENZYME | RG7625 | PETESICATIB | ||
| 1520 | CTSS | DRUGGABLE GENOME, PROTEASE, ENZYME | VBY- 036 | |||
| 1520 | CTSS | DRUGGABLE GENOME, PROTEASE, ENZYME | PMID27998201-Compound-12 | |||
| 1520 | CTSS | DRUGGABLE GENOME, PROTEASE, ENZYME | inhibitor | 318164817 | ||
| 1520 | CTSS | DRUGGABLE GENOME, PROTEASE, ENZYME | inhibitor | 405067337 | ||
| 1520 | CTSS | DRUGGABLE GENOME, PROTEASE, ENZYME | SAR-114137 | |||
| 1520 | CTSS | DRUGGABLE GENOME, PROTEASE, ENZYME | PMID27998201-Compound-6 | |||
| 1520 | CTSS | DRUGGABLE GENOME, PROTEASE, ENZYME | VBY- 891 | |||
| 1520 | CTSS | DRUGGABLE GENOME, PROTEASE, ENZYME | inhibitor | 363894149 | PETESICATIB |
| Page: 1 2 |

Copyright 2023-Present -The University of Texas Health Science Center at Houston |