
|
|||||
|
 | |
| |
| |
| |
| |
| |
|
Gene: CTSK |
Gene summary for CTSK |
| Gene information | Species | Human | Gene symbol | CTSK | Gene ID | 1513 |
| Gene name | cathepsin K | |
| Gene Alias | CTS02 | |
| Cytomap | 1q21.3 | |
| Gene Type | protein-coding | GO ID | GO:0000422 | UniProtAcc | P43235 |
Top |
Malignant transformation analysis |
| Identification of the aberrant gene expression in precancerous and cancerous lesions by comparing the gene expression of stem-like cells in diseased tissues with normal stem cells |
| Entrez ID | Symbol | Replicates | Species | Organ | Tissue | Adj P-value | Log2FC | Malignancy |
| 1513 | CTSK | AEH-subject1 | Human | Endometrium | AEH | 1.53e-26 | -5.77e-01 | -0.3059 |
| 1513 | CTSK | AEH-subject2 | Human | Endometrium | AEH | 2.35e-29 | -5.67e-01 | -0.2525 |
| 1513 | CTSK | AEH-subject3 | Human | Endometrium | AEH | 2.15e-19 | -5.64e-01 | -0.2576 |
| 1513 | CTSK | AEH-subject4 | Human | Endometrium | AEH | 5.39e-18 | -4.34e-01 | -0.2657 |
| 1513 | CTSK | AEH-subject5 | Human | Endometrium | AEH | 5.15e-28 | -6.29e-01 | -0.2953 |
| 1513 | CTSK | EEC-subject1 | Human | Endometrium | EEC | 5.49e-38 | -6.34e-01 | -0.2682 |
| 1513 | CTSK | EEC-subject2 | Human | Endometrium | EEC | 3.05e-34 | -6.32e-01 | -0.2607 |
| 1513 | CTSK | EEC-subject3 | Human | Endometrium | EEC | 6.59e-43 | -5.94e-01 | -0.2525 |
| 1513 | CTSK | EEC-subject4 | Human | Endometrium | EEC | 8.68e-31 | -5.78e-01 | -0.2571 |
| 1513 | CTSK | EEC-subject5 | Human | Endometrium | EEC | 2.35e-26 | -6.19e-01 | -0.249 |
| 1513 | CTSK | GSM5276934 | Human | Endometrium | EEC | 6.39e-13 | -4.76e-01 | -0.0913 |
| 1513 | CTSK | GSM5276935 | Human | Endometrium | EEC | 4.05e-26 | -6.11e-01 | -0.123 |
| 1513 | CTSK | GSM5276937 | Human | Endometrium | EEC | 8.90e-12 | -4.29e-01 | -0.0897 |
| 1513 | CTSK | GSM6177620_NYU_UCEC1_lib1_lib1 | Human | Endometrium | EEC | 7.26e-35 | -6.32e-01 | -0.1869 |
| 1513 | CTSK | GSM6177620_NYU_UCEC1_lib2_lib2 | Human | Endometrium | EEC | 2.53e-28 | -5.98e-01 | -0.1875 |
| 1513 | CTSK | GSM6177620_NYU_UCEC1_lib3_lib3 | Human | Endometrium | EEC | 6.46e-36 | -6.33e-01 | -0.1883 |
| 1513 | CTSK | GSM6177621_NYU_UCEC2_lib1_lib1 | Human | Endometrium | EEC | 2.75e-35 | -6.16e-01 | -0.1934 |
| 1513 | CTSK | GSM6177622_NYU_UCEC3_lib1_lib1 | Human | Endometrium | EEC | 1.45e-37 | -6.52e-01 | -0.1917 |
| 1513 | CTSK | GSM6177622_NYU_UCEC3_lib2_lib2 | Human | Endometrium | EEC | 4.27e-44 | -6.29e-01 | -0.1916 |
| 1513 | CTSK | GSM6177623_NYU_UCEC3_Vis | Human | Endometrium | EEC | 2.14e-04 | -3.43e-01 | -0.1269 |
| Page: 1 2 3 |
| Tissue | Expression Dynamics | Abbreviation |
| Endometrium | 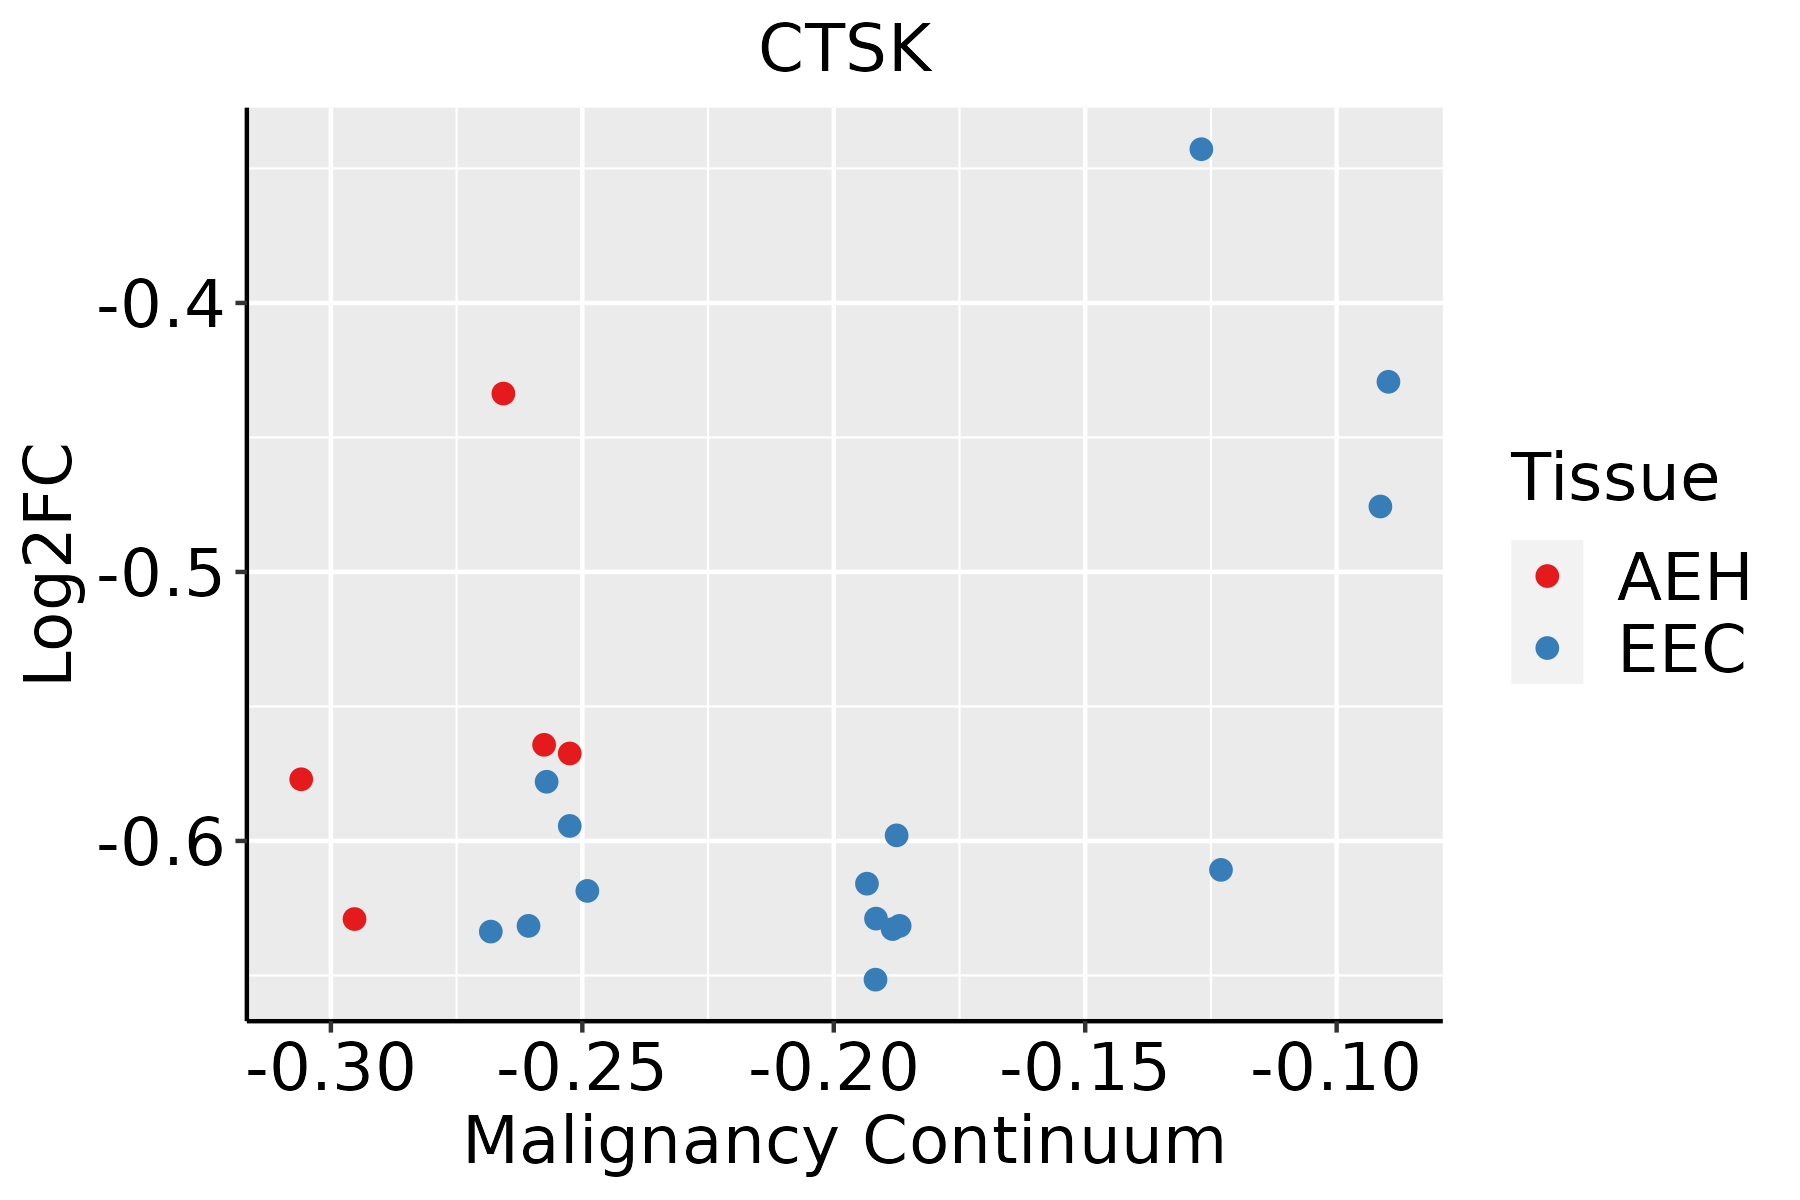 | AEH: Atypical endometrial hyperplasia |
| EEC: Endometrioid Cancer | ||
| Esophagus |  | ESCC: Esophageal squamous cell carcinoma |
| HGIN: High-grade intraepithelial neoplasias | ||
| LGIN: Low-grade intraepithelial neoplasias | ||
| Oral Cavity |  | EOLP: Erosive Oral lichen planus |
| LP: leukoplakia | ||
| NEOLP: Non-erosive oral lichen planus | ||
| OSCC: Oral squamous cell carcinoma | ||
| Skin | 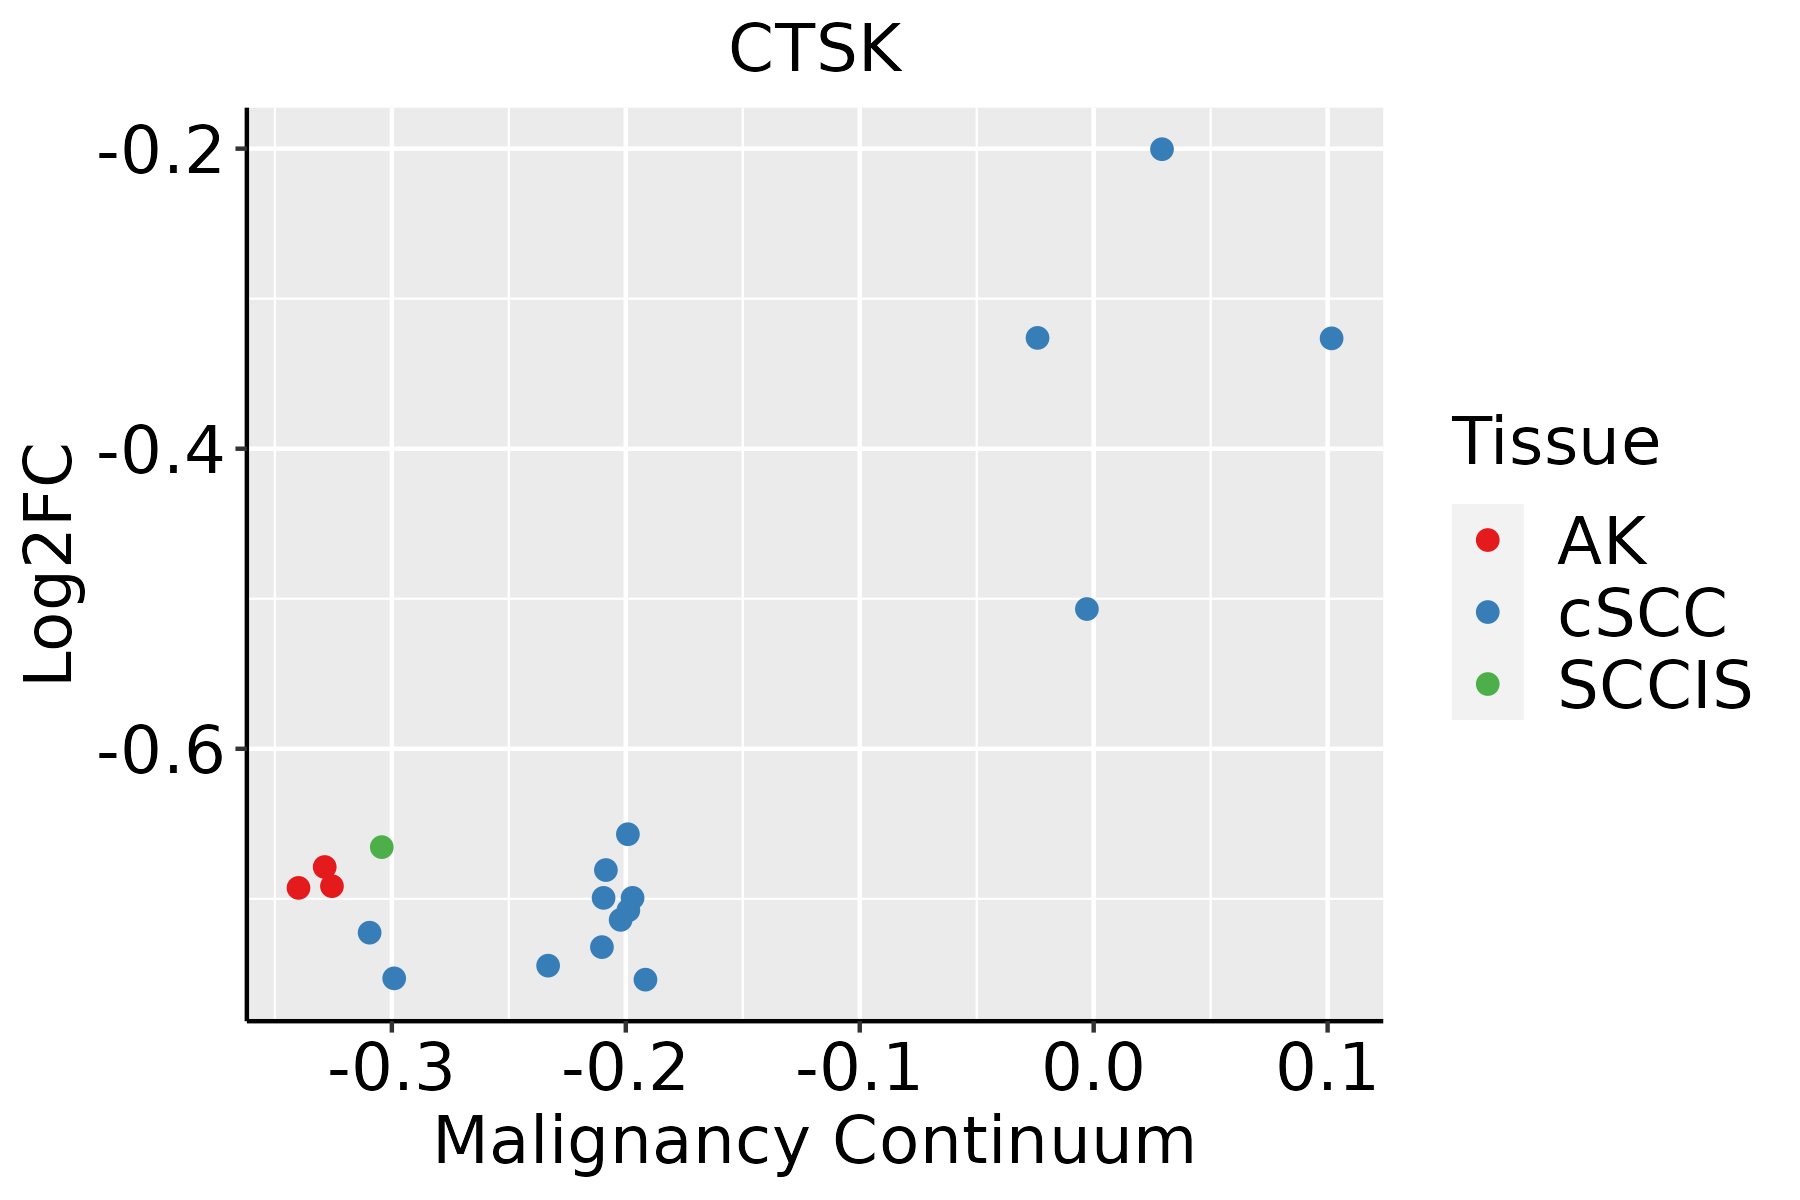 | AK: Actinic keratosis |
| cSCC: Cutaneous squamous cell carcinoma | ||
| SCCIS:squamous cell carcinoma in situ | ||
| Thyroid |  | ATC: Anaplastic thyroid cancer |
| HT: Hashimoto's thyroiditis | ||
| PTC: Papillary thyroid cancer |
| ∗log2FC in expression of this searched gene in stem-like cells from each diseased tissue sample relative to stem-like cells in normal samples in each tissue plotted against the malignancy continuum. Samples are colored based on if they are from different disease stage. |
Top |
Malignant transformation related pathway analysis |
| Find out the enriched GO biological processes and KEGG pathways involved in transition from healthy to precancer to cancer |
| Tissue | Disease Stage | Enriched GO biological Processes |
| Colorectum | AD |  |
| Colorectum | SER |  |
| Colorectum | MSS |  |
| Colorectum | MSI-H |  |
| Colorectum | FAP |  |
| ∗Top 15 enriched GO BP terms are showed in the bar plot of each disease state in each tissue. Each row represents a significant GO biological process which is colored according to the -log10(p.adjust). |
| Page: 1 2 3 4 5 6 7 8 9 |
| GO ID | Tissue | Disease Stage | Description | Gene Ratio | Bg Ratio | pvalue | p.adjust | Count |
| GO:00015038 | Endometrium | AEH | ossification | 78/2100 | 408/18723 | 1.54e-06 | 4.85e-05 | 78 |
| GO:00004228 | Endometrium | AEH | autophagy of mitochondrion | 24/2100 | 81/18723 | 5.41e-06 | 1.36e-04 | 24 |
| GO:00617268 | Endometrium | AEH | mitochondrion disassembly | 24/2100 | 81/18723 | 5.41e-06 | 1.36e-04 | 24 |
| GO:002241115 | Endometrium | AEH | cellular component disassembly | 80/2100 | 443/18723 | 1.07e-05 | 2.45e-04 | 80 |
| GO:19030086 | Endometrium | AEH | organelle disassembly | 29/2100 | 114/18723 | 1.66e-05 | 3.43e-04 | 29 |
| GO:000189410 | Endometrium | AEH | tissue homeostasis | 50/2100 | 268/18723 | 2.04e-04 | 2.54e-03 | 50 |
| GO:00602499 | Endometrium | AEH | anatomical structure homeostasis | 55/2100 | 314/18723 | 5.27e-04 | 5.32e-03 | 55 |
| GO:0061448 | Endometrium | AEH | connective tissue development | 44/2100 | 252/18723 | 1.92e-03 | 1.51e-02 | 44 |
| GO:000042213 | Endometrium | EEC | autophagy of mitochondrion | 25/2168 | 81/18723 | 2.71e-06 | 7.67e-05 | 25 |
| GO:006172613 | Endometrium | EEC | mitochondrion disassembly | 25/2168 | 81/18723 | 2.71e-06 | 7.67e-05 | 25 |
| GO:000150313 | Endometrium | EEC | ossification | 79/2168 | 408/18723 | 2.72e-06 | 7.67e-05 | 79 |
| GO:002241116 | Endometrium | EEC | cellular component disassembly | 82/2168 | 443/18723 | 1.06e-05 | 2.26e-04 | 82 |
| GO:190300813 | Endometrium | EEC | organelle disassembly | 30/2168 | 114/18723 | 1.09e-05 | 2.30e-04 | 30 |
| GO:000189415 | Endometrium | EEC | tissue homeostasis | 51/2168 | 268/18723 | 2.34e-04 | 2.75e-03 | 51 |
| GO:006024914 | Endometrium | EEC | anatomical structure homeostasis | 56/2168 | 314/18723 | 6.52e-04 | 6.35e-03 | 56 |
| GO:00614481 | Endometrium | EEC | connective tissue development | 44/2168 | 252/18723 | 3.51e-03 | 2.36e-02 | 44 |
| GO:0022411111 | Esophagus | ESCC | cellular component disassembly | 305/8552 | 443/18723 | 1.94e-23 | 4.57e-21 | 305 |
| GO:190300816 | Esophagus | ESCC | organelle disassembly | 89/8552 | 114/18723 | 1.36e-12 | 5.80e-11 | 89 |
| GO:000042217 | Esophagus | ESCC | autophagy of mitochondrion | 63/8552 | 81/18723 | 3.41e-09 | 7.24e-08 | 63 |
| GO:006172617 | Esophagus | ESCC | mitochondrion disassembly | 63/8552 | 81/18723 | 3.41e-09 | 7.24e-08 | 63 |
| Page: 1 2 3 4 5 |
| Pathway ID | Tissue | Disease Stage | Description | Gene Ratio | Bg Ratio | pvalue | p.adjust | qvalue | Count |
| hsa0532316 | Endometrium | AEH | Rheumatoid arthritis | 23/1197 | 93/8465 | 4.43e-03 | 2.46e-02 | 1.80e-02 | 23 |
| hsa0421010 | Endometrium | AEH | Apoptosis | 30/1197 | 136/8465 | 7.72e-03 | 4.05e-02 | 2.96e-02 | 30 |
| hsa0532317 | Endometrium | AEH | Rheumatoid arthritis | 23/1197 | 93/8465 | 4.43e-03 | 2.46e-02 | 1.80e-02 | 23 |
| hsa0421015 | Endometrium | AEH | Apoptosis | 30/1197 | 136/8465 | 7.72e-03 | 4.05e-02 | 2.96e-02 | 30 |
| hsa0532323 | Endometrium | EEC | Rheumatoid arthritis | 24/1237 | 93/8465 | 3.14e-03 | 1.78e-02 | 1.33e-02 | 24 |
| hsa0421024 | Endometrium | EEC | Apoptosis | 31/1237 | 136/8465 | 6.72e-03 | 3.25e-02 | 2.42e-02 | 31 |
| hsa0532333 | Endometrium | EEC | Rheumatoid arthritis | 24/1237 | 93/8465 | 3.14e-03 | 1.78e-02 | 1.33e-02 | 24 |
| hsa0421034 | Endometrium | EEC | Apoptosis | 31/1237 | 136/8465 | 6.72e-03 | 3.25e-02 | 2.42e-02 | 31 |
| hsa0414222 | Esophagus | ESCC | Lysosome | 102/4205 | 132/8465 | 5.11e-11 | 7.13e-10 | 3.65e-10 | 102 |
| hsa0421027 | Esophagus | ESCC | Apoptosis | 102/4205 | 136/8465 | 1.05e-09 | 1.21e-08 | 6.21e-09 | 102 |
| hsa0532320 | Esophagus | ESCC | Rheumatoid arthritis | 59/4205 | 93/8465 | 4.98e-03 | 1.27e-02 | 6.52e-03 | 59 |
| hsa0414232 | Esophagus | ESCC | Lysosome | 102/4205 | 132/8465 | 5.11e-11 | 7.13e-10 | 3.65e-10 | 102 |
| hsa0421037 | Esophagus | ESCC | Apoptosis | 102/4205 | 136/8465 | 1.05e-09 | 1.21e-08 | 6.21e-09 | 102 |
| hsa05323110 | Esophagus | ESCC | Rheumatoid arthritis | 59/4205 | 93/8465 | 4.98e-03 | 1.27e-02 | 6.52e-03 | 59 |
| hsa0421018 | Oral cavity | OSCC | Apoptosis | 101/3704 | 136/8465 | 3.34e-13 | 7.00e-12 | 3.56e-12 | 101 |
| hsa041425 | Oral cavity | OSCC | Lysosome | 87/3704 | 132/8465 | 1.97e-07 | 1.35e-06 | 6.86e-07 | 87 |
| hsa0532318 | Oral cavity | OSCC | Rheumatoid arthritis | 56/3704 | 93/8465 | 9.72e-04 | 2.76e-03 | 1.40e-03 | 56 |
| hsa043806 | Oral cavity | OSCC | Osteoclast differentiation | 73/3704 | 128/8465 | 1.60e-03 | 4.44e-03 | 2.26e-03 | 73 |
| hsa04620 | Oral cavity | OSCC | Toll-like receptor signaling pathway | 58/3704 | 104/8465 | 8.77e-03 | 1.98e-02 | 1.01e-02 | 58 |
| hsa0421019 | Oral cavity | OSCC | Apoptosis | 101/3704 | 136/8465 | 3.34e-13 | 7.00e-12 | 3.56e-12 | 101 |
| Page: 1 2 |
Top |
Cell-cell communication analysis |
| Identification of potential cell-cell interactions between two cell types and their ligand-receptor pairs for different disease states |
| Ligand | Receptor | LRpair | Pathway | Tissue | Disease Stage |
| Page: 1 |
Top |
Single-cell gene regulatory network inference analysis |
| Find out the significant the regulons (TFs) and the target genes of each regulon across cell types for different disease states |
| TF | Cell Type | Tissue | Disease Stage | Target Gene | RSS | Regulon Activity |
| ∗The dot plots of a searched regulon are shown for all cell subpopulations in each disease state of each tissue based on the regulon specific score inferred using pySCENIC and by calculating the average expression. |
| Page: 1 |
Top |
Somatic mutation of malignant transformation related genes |
| Annotation of somatic variants for genes involved in malignant transformation |
| Hugo Symbol | Variant Class | Variant Classification | dbSNP RS | HGVSc | HGVSp | HGVSp Short | SWISSPROT | BIOTYPE | SIFT | PolyPhen | Tumor Sample Barcode | Tissue | Histology | Sex | Age | Stage | Therapy Types | Drugs | Outcome |
| CTSK | deletion | Frame_Shift_Del | novel | c.981delC | p.Lys328ArgfsTer39 | p.K328Rfs*39 | P43235 | protein_coding | TCGA-EW-A2FV-01 | Breast | breast invasive carcinoma | Female | <65 | III/IV | Chemotherapy | docetaxel | SD | ||
| CTSK | SNV | Missense_Mutation | c.676N>C | p.Glu226Gln | p.E226Q | P43235 | protein_coding | tolerated(0.12) | possibly_damaging(0.468) | TCGA-DS-A0VM-01 | Cervix | cervical & endocervical cancer | Female | <65 | I/II | Chemotherapy | cisplatin | PD | |
| CTSK | SNV | Missense_Mutation | novel | c.152N>G | p.Glu51Gly | p.E51G | P43235 | protein_coding | deleterious(0.01) | benign(0.317) | TCGA-5M-AAT4-01 | Colorectum | colon adenocarcinoma | Male | >=65 | III/IV | Unknown | Unknown | PD |
| CTSK | SNV | Missense_Mutation | novel | c.696G>T | p.Glu232Asp | p.E232D | P43235 | protein_coding | deleterious(0) | possibly_damaging(0.861) | TCGA-F5-6814-01 | Colorectum | rectum adenocarcinoma | Male | <65 | I/II | Unknown | Unknown | SD |
| CTSK | SNV | Missense_Mutation | novel | c.484N>A | p.Leu162Met | p.L162M | P43235 | protein_coding | deleterious(0.01) | probably_damaging(0.99) | TCGA-A5-A0G1-01 | Endometrium | uterine corpus endometrioid carcinoma | Female | >=65 | I/II | Unknown | Unknown | SD |
| CTSK | SNV | Missense_Mutation | novel | c.320A>G | p.Tyr107Cys | p.Y107C | P43235 | protein_coding | deleterious(0.01) | possibly_damaging(0.656) | TCGA-AJ-A3EK-01 | Endometrium | uterine corpus endometrioid carcinoma | Female | <65 | I/II | Chemotherapy | carboplatin | CR |
| CTSK | SNV | Missense_Mutation | c.380N>C | p.Val127Ala | p.V127A | P43235 | protein_coding | deleterious(0) | probably_damaging(0.918) | TCGA-AP-A0LM-01 | Endometrium | uterine corpus endometrioid carcinoma | Female | <65 | III/IV | Chemotherapy | cisplatin | SD | |
| CTSK | SNV | Missense_Mutation | novel | c.742N>A | p.Ala248Thr | p.A248T | P43235 | protein_coding | deleterious(0) | benign(0.052) | TCGA-AX-A1C5-01 | Endometrium | uterine corpus endometrioid carcinoma | Female | <65 | III/IV | Unspecific | Carboplatin | SD |
| CTSK | SNV | Missense_Mutation | c.369G>T | p.Lys123Asn | p.K123N | P43235 | protein_coding | deleterious(0.03) | probably_damaging(0.923) | TCGA-B5-A0JY-01 | Endometrium | uterine corpus endometrioid carcinoma | Female | <65 | III/IV | Chemotherapy | doxorubicin | SD | |
| CTSK | SNV | Missense_Mutation | novel | c.847N>A | p.Tyr283Asn | p.Y283N | P43235 | protein_coding | deleterious(0) | probably_damaging(1) | TCGA-DI-A1BU-01 | Endometrium | uterine corpus endometrioid carcinoma | Female | <65 | I/II | Chemotherapy | paclitaxel | SD |
| Page: 1 2 3 |
Top |
Related drugs of malignant transformation related genes |
| Identification of chemicals and drugs interact with genes involved in malignant transfromation |
| (DGIdb 4.0) |
| Entrez ID | Symbol | Category | Interaction Types | Drug Claim Name | Drug Name | PMIDs |
| 1513 | CTSK | DRUGGABLE GENOME, EXTERNAL SIDE OF PLASMA MEMBRANE, PROTEASE, ENZYME | PMID25399719-Compound-17 | |||
| 1513 | CTSK | DRUGGABLE GENOME, EXTERNAL SIDE OF PLASMA MEMBRANE, PROTEASE, ENZYME | inhibitor | ODANACATIB | ODANACATIB | |
| 1513 | CTSK | DRUGGABLE GENOME, EXTERNAL SIDE OF PLASMA MEMBRANE, PROTEASE, ENZYME | ODANACATIB | ODANACATIB | ||
| 1513 | CTSK | DRUGGABLE GENOME, EXTERNAL SIDE OF PLASMA MEMBRANE, PROTEASE, ENZYME | PMID27998201-Compound-10 | |||
| 1513 | CTSK | DRUGGABLE GENOME, EXTERNAL SIDE OF PLASMA MEMBRANE, PROTEASE, ENZYME | MIV-701 | |||
| 1513 | CTSK | DRUGGABLE GENOME, EXTERNAL SIDE OF PLASMA MEMBRANE, PROTEASE, ENZYME | inhibitor | 223366192 | RELACATIB | |
| 1513 | CTSK | DRUGGABLE GENOME, EXTERNAL SIDE OF PLASMA MEMBRANE, PROTEASE, ENZYME | 2-(1-CYCLODODECYLETHYLIDENE)HYDRAZINECARBOTHIOAMIDE | CHEMBL2316602 | 23350811 | |
| 1513 | CTSK | DRUGGABLE GENOME, EXTERNAL SIDE OF PLASMA MEMBRANE, PROTEASE, ENZYME | inhibitor | BALICATIB | BALICATIB | |
| 1513 | CTSK | DRUGGABLE GENOME, EXTERNAL SIDE OF PLASMA MEMBRANE, PROTEASE, ENZYME | VEL-0230 | CHEMBL1085282 | ||
| 1513 | CTSK | DRUGGABLE GENOME, EXTERNAL SIDE OF PLASMA MEMBRANE, PROTEASE, ENZYME | inhibitor | 252166814 |
| Page: 1 2 3 |

Copyright 2023-Present -The University of Texas Health Science Center at Houston |