
|
|||||
|
 | |
| |
| |
| |
| |
| |
|
Gene: CTSF |
Gene summary for CTSF |
| Gene information | Species | Human | Gene symbol | CTSF | Gene ID | 8722 |
| Gene name | cathepsin F | |
| Gene Alias | CATSF | |
| Cytomap | 11q13.2 | |
| Gene Type | protein-coding | GO ID | GO:0002376 | UniProtAcc | Q9UBX1 |
Top |
Malignant transformation analysis |
| Identification of the aberrant gene expression in precancerous and cancerous lesions by comparing the gene expression of stem-like cells in diseased tissues with normal stem cells |
| Entrez ID | Symbol | Replicates | Species | Organ | Tissue | Adj P-value | Log2FC | Malignancy |
| 8722 | CTSF | LZE4T | Human | Esophagus | ESCC | 2.92e-04 | -7.06e-02 | 0.0811 |
| 8722 | CTSF | LZE24T | Human | Esophagus | ESCC | 3.67e-19 | 8.74e-01 | 0.0596 |
| 8722 | CTSF | P1T-E | Human | Esophagus | ESCC | 9.89e-04 | 5.46e-01 | 0.0875 |
| 8722 | CTSF | P2T-E | Human | Esophagus | ESCC | 1.16e-21 | 1.63e-01 | 0.1177 |
| 8722 | CTSF | P4T-E | Human | Esophagus | ESCC | 5.48e-11 | 1.72e-01 | 0.1323 |
| 8722 | CTSF | P8T-E | Human | Esophagus | ESCC | 2.15e-48 | 1.12e+00 | 0.0889 |
| 8722 | CTSF | P9T-E | Human | Esophagus | ESCC | 1.04e-06 | 1.65e-01 | 0.1131 |
| 8722 | CTSF | P10T-E | Human | Esophagus | ESCC | 3.84e-16 | 2.96e-01 | 0.116 |
| 8722 | CTSF | P11T-E | Human | Esophagus | ESCC | 1.97e-13 | 9.63e-01 | 0.1426 |
| 8722 | CTSF | P12T-E | Human | Esophagus | ESCC | 9.31e-22 | 4.44e-01 | 0.1122 |
| 8722 | CTSF | P15T-E | Human | Esophagus | ESCC | 2.12e-10 | 3.39e-01 | 0.1149 |
| 8722 | CTSF | P16T-E | Human | Esophagus | ESCC | 5.69e-52 | 1.25e+00 | 0.1153 |
| 8722 | CTSF | P20T-E | Human | Esophagus | ESCC | 4.88e-03 | 1.28e-01 | 0.1124 |
| 8722 | CTSF | P21T-E | Human | Esophagus | ESCC | 3.25e-17 | 1.17e-01 | 0.1617 |
| 8722 | CTSF | P22T-E | Human | Esophagus | ESCC | 4.90e-25 | 5.05e-01 | 0.1236 |
| 8722 | CTSF | P23T-E | Human | Esophagus | ESCC | 5.60e-18 | 6.61e-01 | 0.108 |
| 8722 | CTSF | P24T-E | Human | Esophagus | ESCC | 9.72e-14 | 5.39e-02 | 0.1287 |
| 8722 | CTSF | P26T-E | Human | Esophagus | ESCC | 1.45e-35 | 7.65e-01 | 0.1276 |
| 8722 | CTSF | P27T-E | Human | Esophagus | ESCC | 3.45e-13 | 3.23e-01 | 0.1055 |
| 8722 | CTSF | P28T-E | Human | Esophagus | ESCC | 6.50e-09 | 5.07e-02 | 0.1149 |
| Page: 1 2 3 4 5 6 |
| Tissue | Expression Dynamics | Abbreviation |
| Esophagus |  | ESCC: Esophageal squamous cell carcinoma |
| HGIN: High-grade intraepithelial neoplasias | ||
| LGIN: Low-grade intraepithelial neoplasias | ||
| Liver | 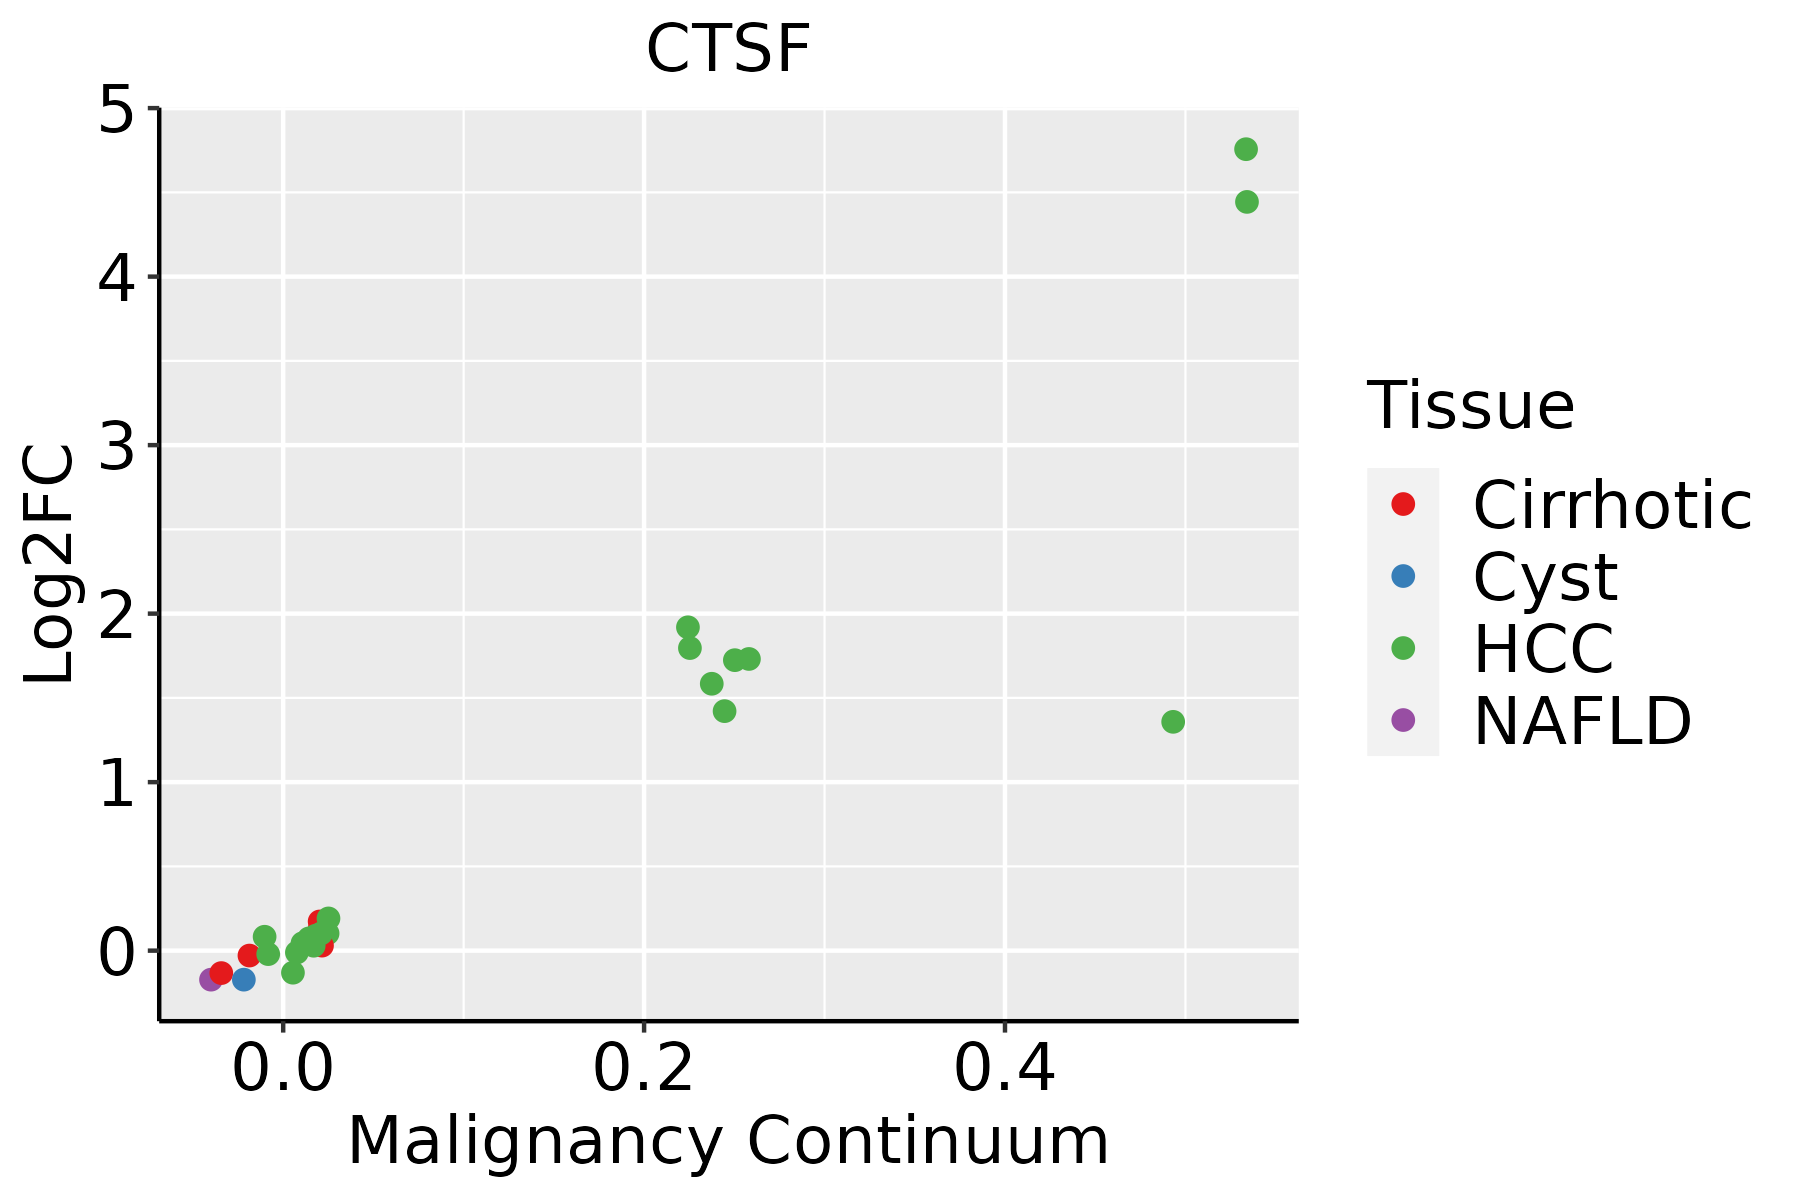 | HCC: Hepatocellular carcinoma |
| NAFLD: Non-alcoholic fatty liver disease | ||
| Oral Cavity | 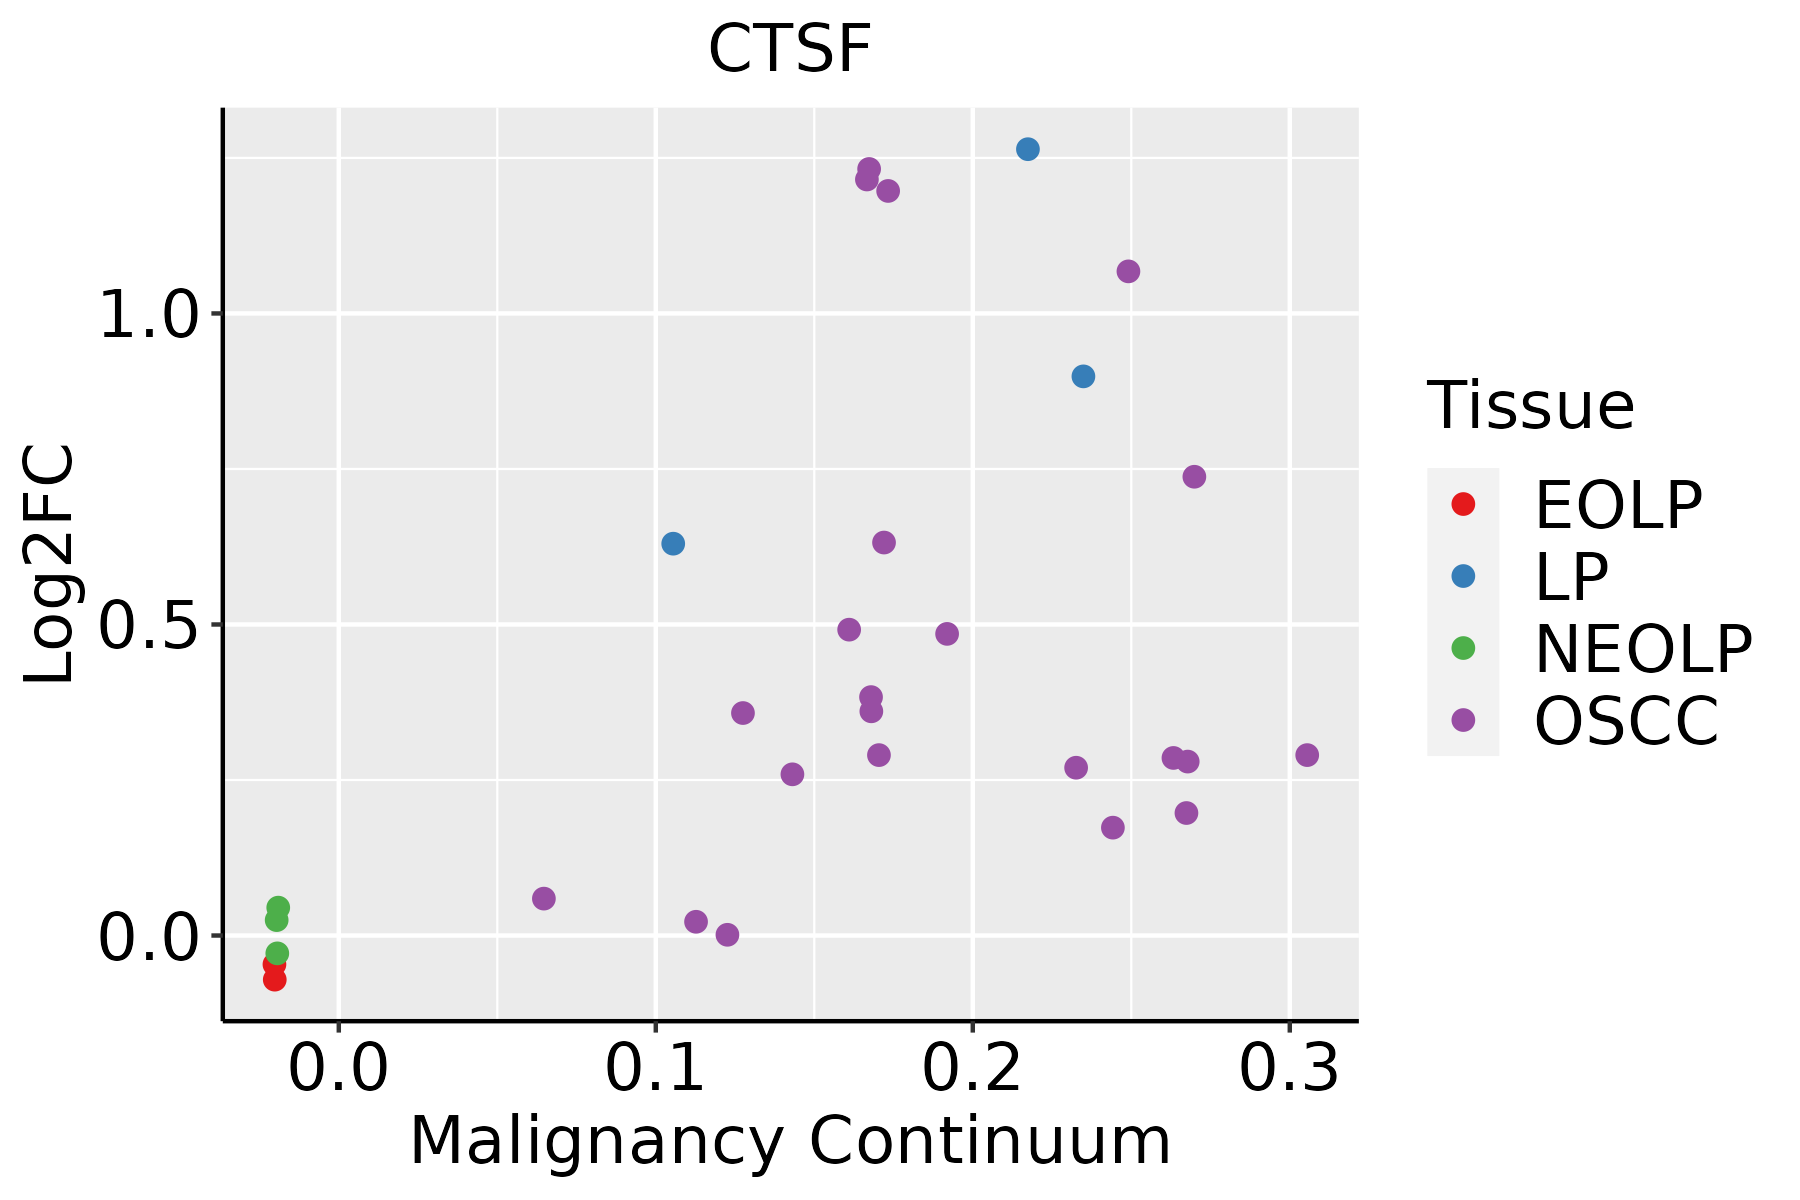 | EOLP: Erosive Oral lichen planus |
| LP: leukoplakia | ||
| NEOLP: Non-erosive oral lichen planus | ||
| OSCC: Oral squamous cell carcinoma | ||
| Prostate | 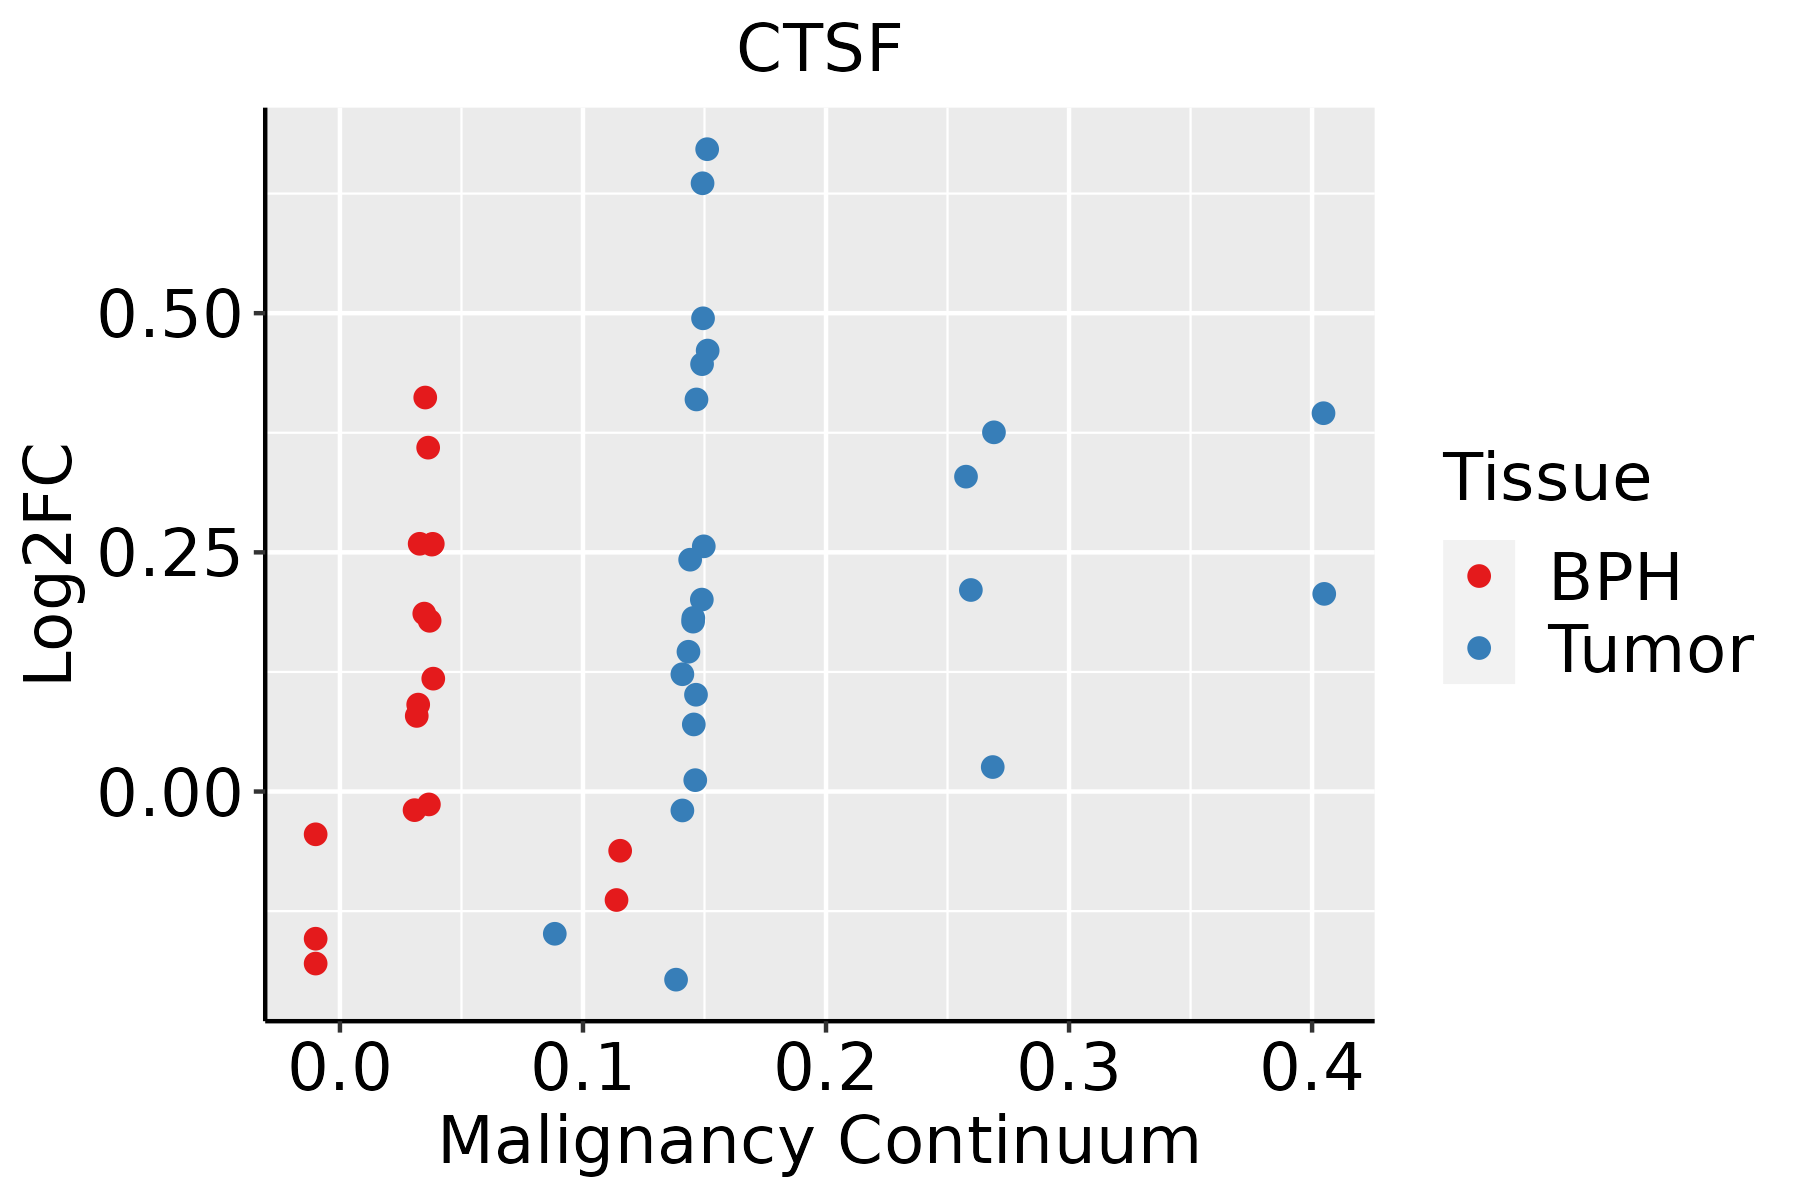 | BPH: Benign Prostatic Hyperplasia |
| Thyroid | 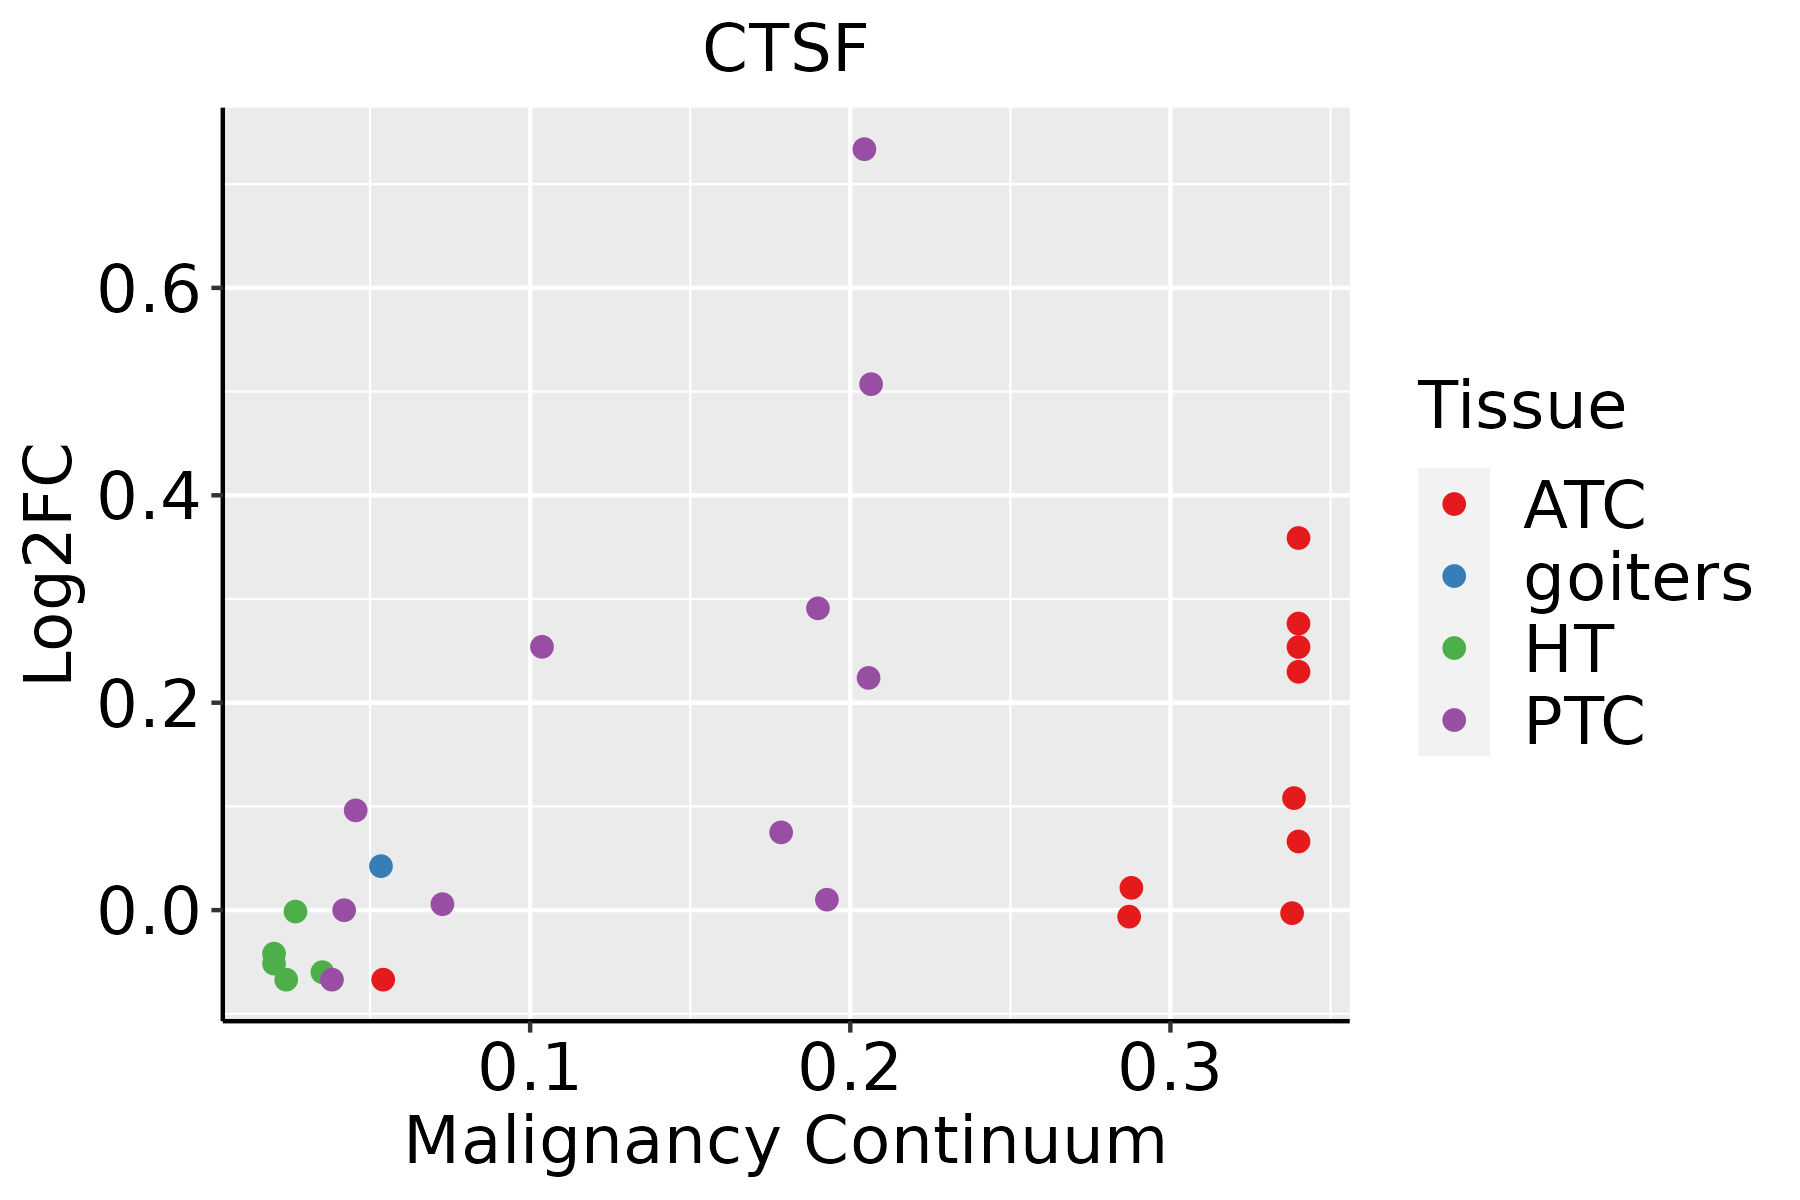 | ATC: Anaplastic thyroid cancer |
| HT: Hashimoto's thyroiditis | ||
| PTC: Papillary thyroid cancer |
| ∗log2FC in expression of this searched gene in stem-like cells from each diseased tissue sample relative to stem-like cells in normal samples in each tissue plotted against the malignancy continuum. Samples are colored based on if they are from different disease stage. |
Top |
Malignant transformation related pathway analysis |
| Find out the enriched GO biological processes and KEGG pathways involved in transition from healthy to precancer to cancer |
| Tissue | Disease Stage | Enriched GO biological Processes |
| Colorectum | AD |  |
| Colorectum | SER |  |
| Colorectum | MSS |  |
| Colorectum | MSI-H |  |
| Colorectum | FAP |  |
| ∗Top 15 enriched GO BP terms are showed in the bar plot of each disease state in each tissue. Each row represents a significant GO biological process which is colored according to the -log10(p.adjust). |
| Page: 1 2 3 4 5 6 7 8 9 |
| GO ID | Tissue | Disease Stage | Description | Gene Ratio | Bg Ratio | pvalue | p.adjust | Count |
| GO:004800220 | Esophagus | ESCC | antigen processing and presentation of peptide antigen | 44/8552 | 62/18723 | 4.81e-05 | 3.78e-04 | 44 |
| GO:000247820 | Esophagus | ESCC | antigen processing and presentation of exogenous peptide antigen | 29/8552 | 38/18723 | 1.18e-04 | 8.13e-04 | 29 |
| GO:001988225 | Esophagus | ESCC | antigen processing and presentation | 67/8552 | 106/18723 | 2.03e-04 | 1.28e-03 | 67 |
| GO:001988420 | Esophagus | ESCC | antigen processing and presentation of exogenous antigen | 33/8552 | 47/18723 | 5.77e-04 | 3.14e-03 | 33 |
| GO:000250417 | Esophagus | ESCC | antigen processing and presentation of peptide or polysaccharide antigen via MHC class II | 26/8552 | 36/18723 | 1.14e-03 | 5.66e-03 | 26 |
| GO:001988618 | Esophagus | ESCC | antigen processing and presentation of exogenous peptide antigen via MHC class II | 22/8552 | 30/18723 | 1.98e-03 | 8.90e-03 | 22 |
| GO:000249517 | Esophagus | ESCC | antigen processing and presentation of peptide antigen via MHC class II | 24/8552 | 34/18723 | 2.90e-03 | 1.22e-02 | 24 |
| GO:00024787 | Liver | Cirrhotic | antigen processing and presentation of exogenous peptide antigen | 21/4634 | 38/18723 | 5.49e-05 | 6.31e-04 | 21 |
| GO:00198827 | Liver | Cirrhotic | antigen processing and presentation | 44/4634 | 106/18723 | 1.07e-04 | 1.10e-03 | 44 |
| GO:00480027 | Liver | Cirrhotic | antigen processing and presentation of peptide antigen | 29/4634 | 62/18723 | 1.34e-04 | 1.31e-03 | 29 |
| GO:00198847 | Liver | Cirrhotic | antigen processing and presentation of exogenous antigen | 23/4634 | 47/18723 | 2.84e-04 | 2.51e-03 | 23 |
| GO:00198866 | Liver | Cirrhotic | antigen processing and presentation of exogenous peptide antigen via MHC class II | 16/4634 | 30/18723 | 7.20e-04 | 5.36e-03 | 16 |
| GO:00025045 | Liver | Cirrhotic | antigen processing and presentation of peptide or polysaccharide antigen via MHC class II | 17/4634 | 36/18723 | 2.82e-03 | 1.63e-02 | 17 |
| GO:00024955 | Liver | Cirrhotic | antigen processing and presentation of peptide antigen via MHC class II | 16/4634 | 34/18723 | 3.88e-03 | 2.10e-02 | 16 |
| GO:001988212 | Liver | HCC | antigen processing and presentation | 65/7958 | 106/18723 | 7.06e-05 | 6.37e-04 | 65 |
| GO:000247811 | Liver | HCC | antigen processing and presentation of exogenous peptide antigen | 27/7958 | 38/18723 | 3.47e-04 | 2.42e-03 | 27 |
| GO:004800212 | Liver | HCC | antigen processing and presentation of peptide antigen | 40/7958 | 62/18723 | 3.84e-04 | 2.62e-03 | 40 |
| GO:001988611 | Liver | HCC | antigen processing and presentation of exogenous peptide antigen via MHC class II | 22/7958 | 30/18723 | 6.14e-04 | 3.82e-03 | 22 |
| GO:001988411 | Liver | HCC | antigen processing and presentation of exogenous antigen | 31/7958 | 47/18723 | 9.90e-04 | 5.71e-03 | 31 |
| GO:000250411 | Liver | HCC | antigen processing and presentation of peptide or polysaccharide antigen via MHC class II | 24/7958 | 36/18723 | 2.95e-03 | 1.38e-02 | 24 |
| Page: 1 2 3 |
| Pathway ID | Tissue | Disease Stage | Description | Gene Ratio | Bg Ratio | pvalue | p.adjust | qvalue | Count |
| hsa0414222 | Esophagus | ESCC | Lysosome | 102/4205 | 132/8465 | 5.11e-11 | 7.13e-10 | 3.65e-10 | 102 |
| hsa0421027 | Esophagus | ESCC | Apoptosis | 102/4205 | 136/8465 | 1.05e-09 | 1.21e-08 | 6.21e-09 | 102 |
| hsa0414232 | Esophagus | ESCC | Lysosome | 102/4205 | 132/8465 | 5.11e-11 | 7.13e-10 | 3.65e-10 | 102 |
| hsa0421037 | Esophagus | ESCC | Apoptosis | 102/4205 | 136/8465 | 1.05e-09 | 1.21e-08 | 6.21e-09 | 102 |
| hsa041424 | Liver | Cirrhotic | Lysosome | 68/2530 | 132/8465 | 1.34e-07 | 1.97e-06 | 1.21e-06 | 68 |
| hsa042106 | Liver | Cirrhotic | Apoptosis | 58/2530 | 136/8465 | 9.84e-04 | 5.55e-03 | 3.42e-03 | 58 |
| hsa0414211 | Liver | Cirrhotic | Lysosome | 68/2530 | 132/8465 | 1.34e-07 | 1.97e-06 | 1.21e-06 | 68 |
| hsa0421011 | Liver | Cirrhotic | Apoptosis | 58/2530 | 136/8465 | 9.84e-04 | 5.55e-03 | 3.42e-03 | 58 |
| hsa041422 | Liver | HCC | Lysosome | 100/4020 | 132/8465 | 2.32e-11 | 4.31e-10 | 2.40e-10 | 100 |
| hsa042102 | Liver | HCC | Apoptosis | 83/4020 | 136/8465 | 9.51e-04 | 3.58e-03 | 1.99e-03 | 83 |
| hsa041423 | Liver | HCC | Lysosome | 100/4020 | 132/8465 | 2.32e-11 | 4.31e-10 | 2.40e-10 | 100 |
| hsa042103 | Liver | HCC | Apoptosis | 83/4020 | 136/8465 | 9.51e-04 | 3.58e-03 | 1.99e-03 | 83 |
| hsa0421018 | Oral cavity | OSCC | Apoptosis | 101/3704 | 136/8465 | 3.34e-13 | 7.00e-12 | 3.56e-12 | 101 |
| hsa041425 | Oral cavity | OSCC | Lysosome | 87/3704 | 132/8465 | 1.97e-07 | 1.35e-06 | 6.86e-07 | 87 |
| hsa0421019 | Oral cavity | OSCC | Apoptosis | 101/3704 | 136/8465 | 3.34e-13 | 7.00e-12 | 3.56e-12 | 101 |
| hsa0414212 | Oral cavity | OSCC | Lysosome | 87/3704 | 132/8465 | 1.97e-07 | 1.35e-06 | 6.86e-07 | 87 |
| hsa0414221 | Oral cavity | LP | Lysosome | 67/2418 | 132/8465 | 5.13e-08 | 7.77e-07 | 5.01e-07 | 67 |
| hsa0421026 | Oral cavity | LP | Apoptosis | 65/2418 | 136/8465 | 1.33e-06 | 1.48e-05 | 9.53e-06 | 65 |
| hsa0414231 | Oral cavity | LP | Lysosome | 67/2418 | 132/8465 | 5.13e-08 | 7.77e-07 | 5.01e-07 | 67 |
| hsa0421036 | Oral cavity | LP | Apoptosis | 65/2418 | 136/8465 | 1.33e-06 | 1.48e-05 | 9.53e-06 | 65 |
| Page: 1 2 |
Top |
Cell-cell communication analysis |
| Identification of potential cell-cell interactions between two cell types and their ligand-receptor pairs for different disease states |
| Ligand | Receptor | LRpair | Pathway | Tissue | Disease Stage |
| Page: 1 |
Top |
Single-cell gene regulatory network inference analysis |
| Find out the significant the regulons (TFs) and the target genes of each regulon across cell types for different disease states |
| TF | Cell Type | Tissue | Disease Stage | Target Gene | RSS | Regulon Activity |
| ∗The dot plots of a searched regulon are shown for all cell subpopulations in each disease state of each tissue based on the regulon specific score inferred using pySCENIC and by calculating the average expression. |
| Page: 1 |
Top |
Somatic mutation of malignant transformation related genes |
| Annotation of somatic variants for genes involved in malignant transformation |
| Hugo Symbol | Variant Class | Variant Classification | dbSNP RS | HGVSc | HGVSp | HGVSp Short | SWISSPROT | BIOTYPE | SIFT | PolyPhen | Tumor Sample Barcode | Tissue | Histology | Sex | Age | Stage | Therapy Types | Drugs | Outcome |
| CTSF | SNV | Missense_Mutation | c.1360G>A | p.Gly454Ser | p.G454S | Q9UBX1 | protein_coding | deleterious(0) | probably_damaging(0.997) | TCGA-A7-A26H-01 | Breast | breast invasive carcinoma | Female | >=65 | I/II | Hormone Therapy | anastrozole | PD | |
| CTSF | SNV | Missense_Mutation | c.344G>A | p.Gly115Glu | p.G115E | Q9UBX1 | protein_coding | deleterious(0.01) | benign(0.212) | TCGA-AC-A23H-01 | Breast | breast invasive carcinoma | Female | >=65 | I/II | Unknown | Unknown | PD | |
| CTSF | SNV | Missense_Mutation | c.295N>A | p.Val99Met | p.V99M | Q9UBX1 | protein_coding | tolerated(0.21) | benign(0.24) | TCGA-C8-A135-01 | Breast | breast invasive carcinoma | Female | <65 | I/II | Chemotherapy | 5-fluorouracil | CR | |
| CTSF | insertion | Frame_Shift_Ins | novel | c.1008_1009insCCAGTAACAAGGGAGTTCCCTTCCTCCAGAGACCT | p.Leu337ProfsTer21 | p.L337Pfs*21 | Q9UBX1 | protein_coding | TCGA-A7-A0CJ-01 | Breast | breast invasive carcinoma | Female | <65 | I/II | Chemotherapy | cytoxan | SD | ||
| CTSF | SNV | Missense_Mutation | novel | c.1146N>C | p.Glu382Asp | p.E382D | Q9UBX1 | protein_coding | tolerated(0.13) | benign(0.01) | TCGA-VS-A9UY-01 | Cervix | cervical & endocervical cancer | Female | <65 | I/II | Chemotherapy | cisplatin | PD |
| CTSF | SNV | Missense_Mutation | c.511A>G | p.Asn171Asp | p.N171D | Q9UBX1 | protein_coding | tolerated(0.19) | benign(0) | TCGA-A6-6781-01 | Colorectum | colon adenocarcinoma | Male | <65 | III/IV | Chemotherapy | oxaliplatin | SD | |
| CTSF | SNV | Missense_Mutation | rs142782021 | c.614N>A | p.Arg205Gln | p.R205Q | Q9UBX1 | protein_coding | tolerated(1) | benign(0.001) | TCGA-AD-6895-01 | Colorectum | colon adenocarcinoma | Male | >=65 | III/IV | Unknown | Unknown | SD |
| CTSF | SNV | Missense_Mutation | novel | c.1038G>T | p.Lys346Asn | p.K346N | Q9UBX1 | protein_coding | deleterious(0.05) | benign(0.424) | TCGA-AZ-4315-01 | Colorectum | colon adenocarcinoma | Male | <65 | I/II | Unknown | Unknown | SD |
| CTSF | SNV | Missense_Mutation | rs768809245 | c.1442C>T | p.Ala481Val | p.A481V | Q9UBX1 | protein_coding | deleterious(0) | probably_damaging(0.98) | TCGA-CM-5861-01 | Colorectum | colon adenocarcinoma | Female | <65 | I/II | Unknown | Unknown | PD |
| CTSF | SNV | Missense_Mutation | c.1009T>A | p.Leu337Met | p.L337M | Q9UBX1 | protein_coding | deleterious(0.04) | benign(0.341) | TCGA-F4-6569-01 | Colorectum | colon adenocarcinoma | Male | <65 | I/II | Ancillary | leucovorin | CR |
| Page: 1 2 3 4 5 6 |
Top |
Related drugs of malignant transformation related genes |
| Identification of chemicals and drugs interact with genes involved in malignant transfromation |
| (DGIdb 4.0) |
| Entrez ID | Symbol | Category | Interaction Types | Drug Claim Name | Drug Name | PMIDs |
| 8722 | CTSF | DRUGGABLE GENOME, PROTEASE, ENZYME | PMID27998201-Compound-12 | |||
| 8722 | CTSF | DRUGGABLE GENOME, PROTEASE, ENZYME | PMID27998201-Compound-5 | |||
| 8722 | CTSF | DRUGGABLE GENOME, PROTEASE, ENZYME | inhibitor | 178103149 | ||
| 8722 | CTSF | DRUGGABLE GENOME, PROTEASE, ENZYME | inhibitor | 405067337 |
| Page: 1 |

Copyright 2023-Present -The University of Texas Health Science Center at Houston |