Schematic overview of the cellular and molecular mechanisms involved in the cancer progression, including the proposed cellular and molecular mechanisms in cancer cells trajectory. AT1: alveolar type 1 cells; AT2: alveolar type 2 cells; AAH: atypical adenomatous hyperplasia; AIS: adenocarcinoma in situ; MIA: minimally invasive adenocarcinoma; IA: invasive adenocarcinoma; EMT: epithelial-mesenchymal transition

Home

Download

Statistics

Help

Contact

Center for Computational Systems Medicine
leaf

Gene summary

leaf

Malignant transformation analysis

leaf

Malignant transformation related pathway analysis

leaf

Cell-cell communication analysis

leaf

Single-cell gene regulatory network inference analysis

leaf

Somatic mutation of malignant transformation related genes

leaf

Related drugs of malignant transformation related genes

Gene: CTSE

Gene summary for CTSE

check button Gene summary.

Gene informationSpeciesHuman
Gene symbol

CTSE

Gene ID

1510

Gene namecathepsin E
Gene AliasCATE
Cytomap1q32.1
Gene Typeprotein-coding
GO ID

GO:0002376

UniProtAcc

B4DNU8


Top

Malignant transformation analysis

check button Identification of the aberrant gene expression in precancerous and cancerous lesions by comparing the gene expression of stem-like cells in diseased tissues with normal stem cells
check button Malignant transformation involving gene list.
Entrez IDSymbolReplicatesSpeciesOrganTissueAdj P-valueLog2FCMalignancy
1510CTSEHTA11_2487_2000001011HumanColorectumSER1.24e-159.96e-01-0.1808
1510CTSEHTA11_1938_2000001011HumanColorectumAD1.02e-176.41e-01-0.0811
1510CTSEHTA11_78_2000001011HumanColorectumAD9.30e-137.57e-01-0.1088
1510CTSEHTA11_411_2000001011HumanColorectumSER7.17e-131.87e+00-0.2602
1510CTSEHTA11_696_2000001011HumanColorectumAD3.06e-093.11e-01-0.1464
1510CTSEHCC2_MengHumanLiverHCC1.30e-1051.31e+000.0107
1510CTSES027HumanLiverHCC9.18e-073.76e-010.2446
1510CTSES028HumanLiverHCC2.23e-239.30e-010.2503
1510CTSES029HumanLiverHCC7.07e-217.21e-010.2581
1510CTSERNA-P25T1-P25T1-1HumanLungAIS2.24e-073.19e-01-0.2116
1510CTSERNA-P6T2-P6T2-2HumanLungIAC2.39e-03-2.58e-01-0.0132
1510CTSERNA-P6T2-P6T2-3HumanLungIAC9.44e-05-2.16e-01-0.013
1510CTSERNA-P7T1-P7T1-1HumanLungAIS7.75e-076.94e-01-0.0961
1510CTSERNA-P7T1-P7T1-2HumanLungAIS1.42e-066.05e-01-0.0876
1510CTSERNA-P7T1-P7T1-3HumanLungAIS2.18e-024.70e-01-0.0822
1510CTSERNA-P7T1-P7T1-4HumanLungAIS2.95e-033.06e-01-0.0809
1510CTSEPat01-BHumanStomachGC2.81e-31-3.89e-010.5754
1510CTSEPat02-BHumanStomachGC6.70e-45-6.13e-020.0368
1510CTSEPat03-BHumanStomachGC3.51e-24-2.04e-010.3693
1510CTSEPat04-BHumanStomachGC3.65e-331.27e-01-0.1483
Page: 1 2 3 

check button Transcriptomic changes along malignancy continuum.
TissueExpression DynamicsAbbreviation
Colorectum (GSE201348)The image shows the transcriptomic changes along malignancy continuum.log2FC in expression of this searched gene in stem-like cells from each diseased tissue sample relative to stem-like cells in normal samples in each tissue plotted against the malignancy continuum. Samples are colored based on if they are from different disease stage.FAP: Familial adenomatous polyposis
CRC: Colorectal cancer
Colorectum (HTA11)The image shows the transcriptomic changes along malignancy continuum.log2FC in expression of this searched gene in stem-like cells from each diseased tissue sample relative to stem-like cells in normal samples in each tissue plotted against the malignancy continuum. Samples are colored based on if they are from different disease stage.AD: Adenomas
SER: Sessile serrated lesions
MSI-H: Microsatellite-high colorectal cancer
MSS: Microsatellite stable colorectal cancer
GCThe image shows the transcriptomic changes along malignancy continuum.log2FC in expression of this searched gene in stem-like cells from each diseased tissue sample relative to stem-like cells in normal samples in each tissue plotted against the malignancy continuum. Samples are colored based on if they are from different disease stage.
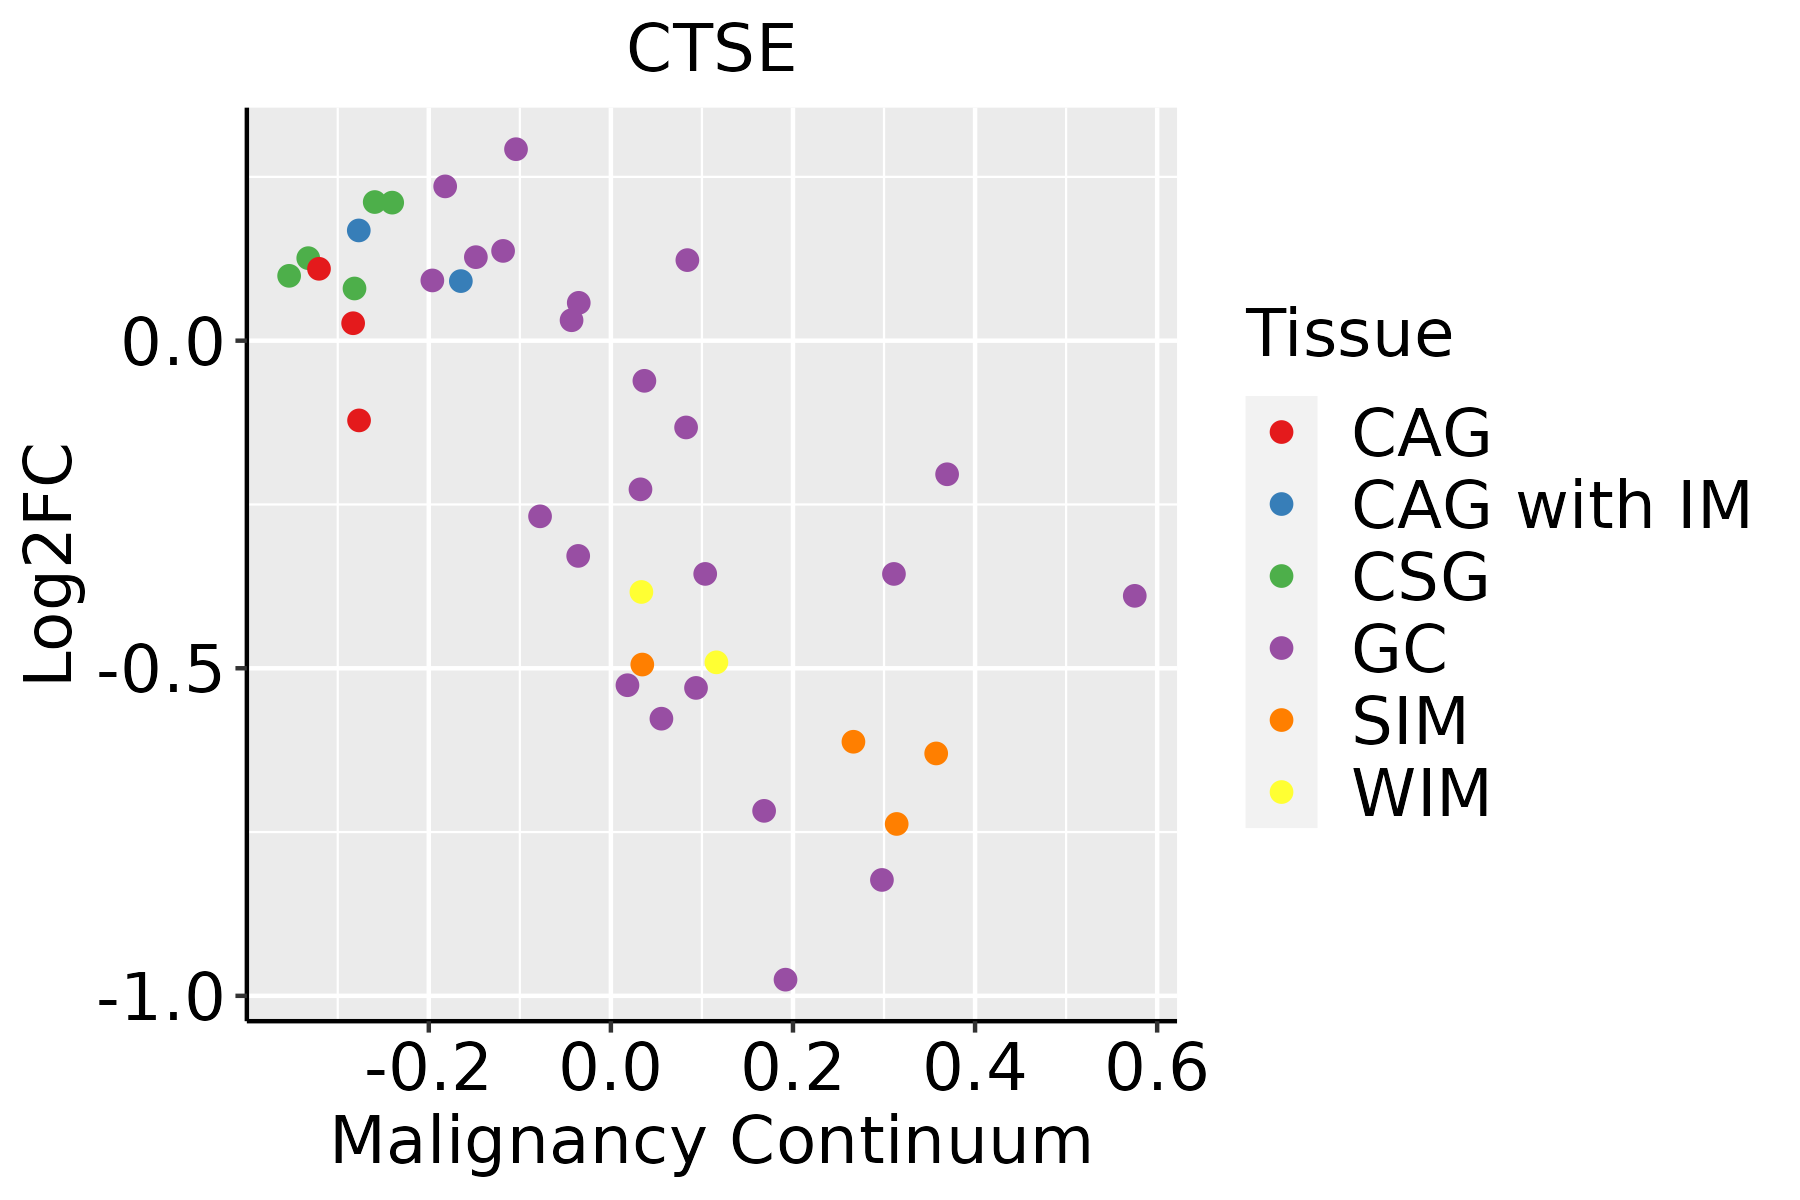
CAG: Chronic atrophic gastritis
CAG with IM: Chronic atrophic gastritis with intestinal metaplasia
CSG: Chronic superficial gastritis
GC: Gastric cancer
SIM: Severe intestinal metaplasia
WIM: Wild intestinal metaplasia
LiverThe image shows the transcriptomic changes along malignancy continuum.log2FC in expression of this searched gene in stem-like cells from each diseased tissue sample relative to stem-like cells in normal samples in each tissue plotted against the malignancy continuum. Samples are colored based on if they are from different disease stage.
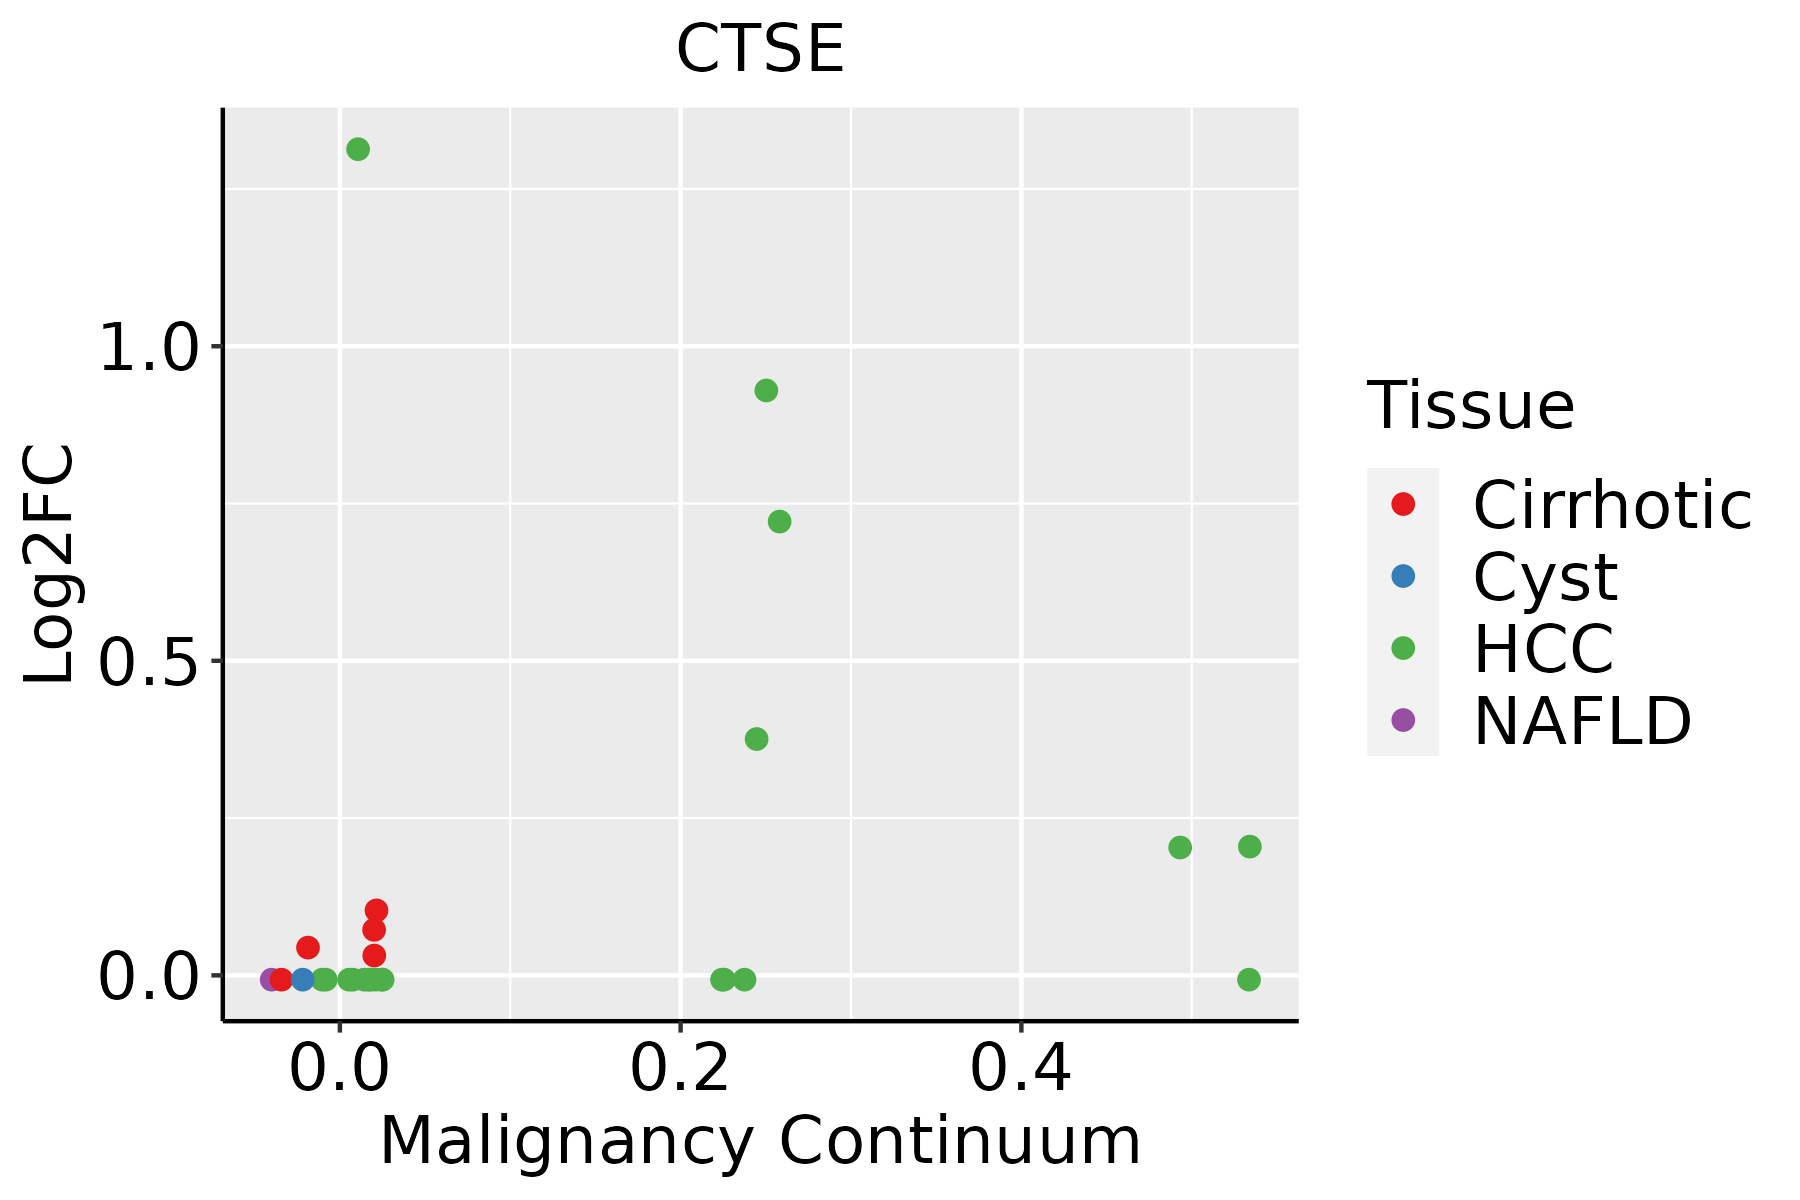
HCC: Hepatocellular carcinoma
NAFLD: Non-alcoholic fatty liver disease
LungThe image shows the transcriptomic changes along malignancy continuum.log2FC in expression of this searched gene in stem-like cells from each diseased tissue sample relative to stem-like cells in normal samples in each tissue plotted against the malignancy continuum. Samples are colored based on if they are from different disease stage.
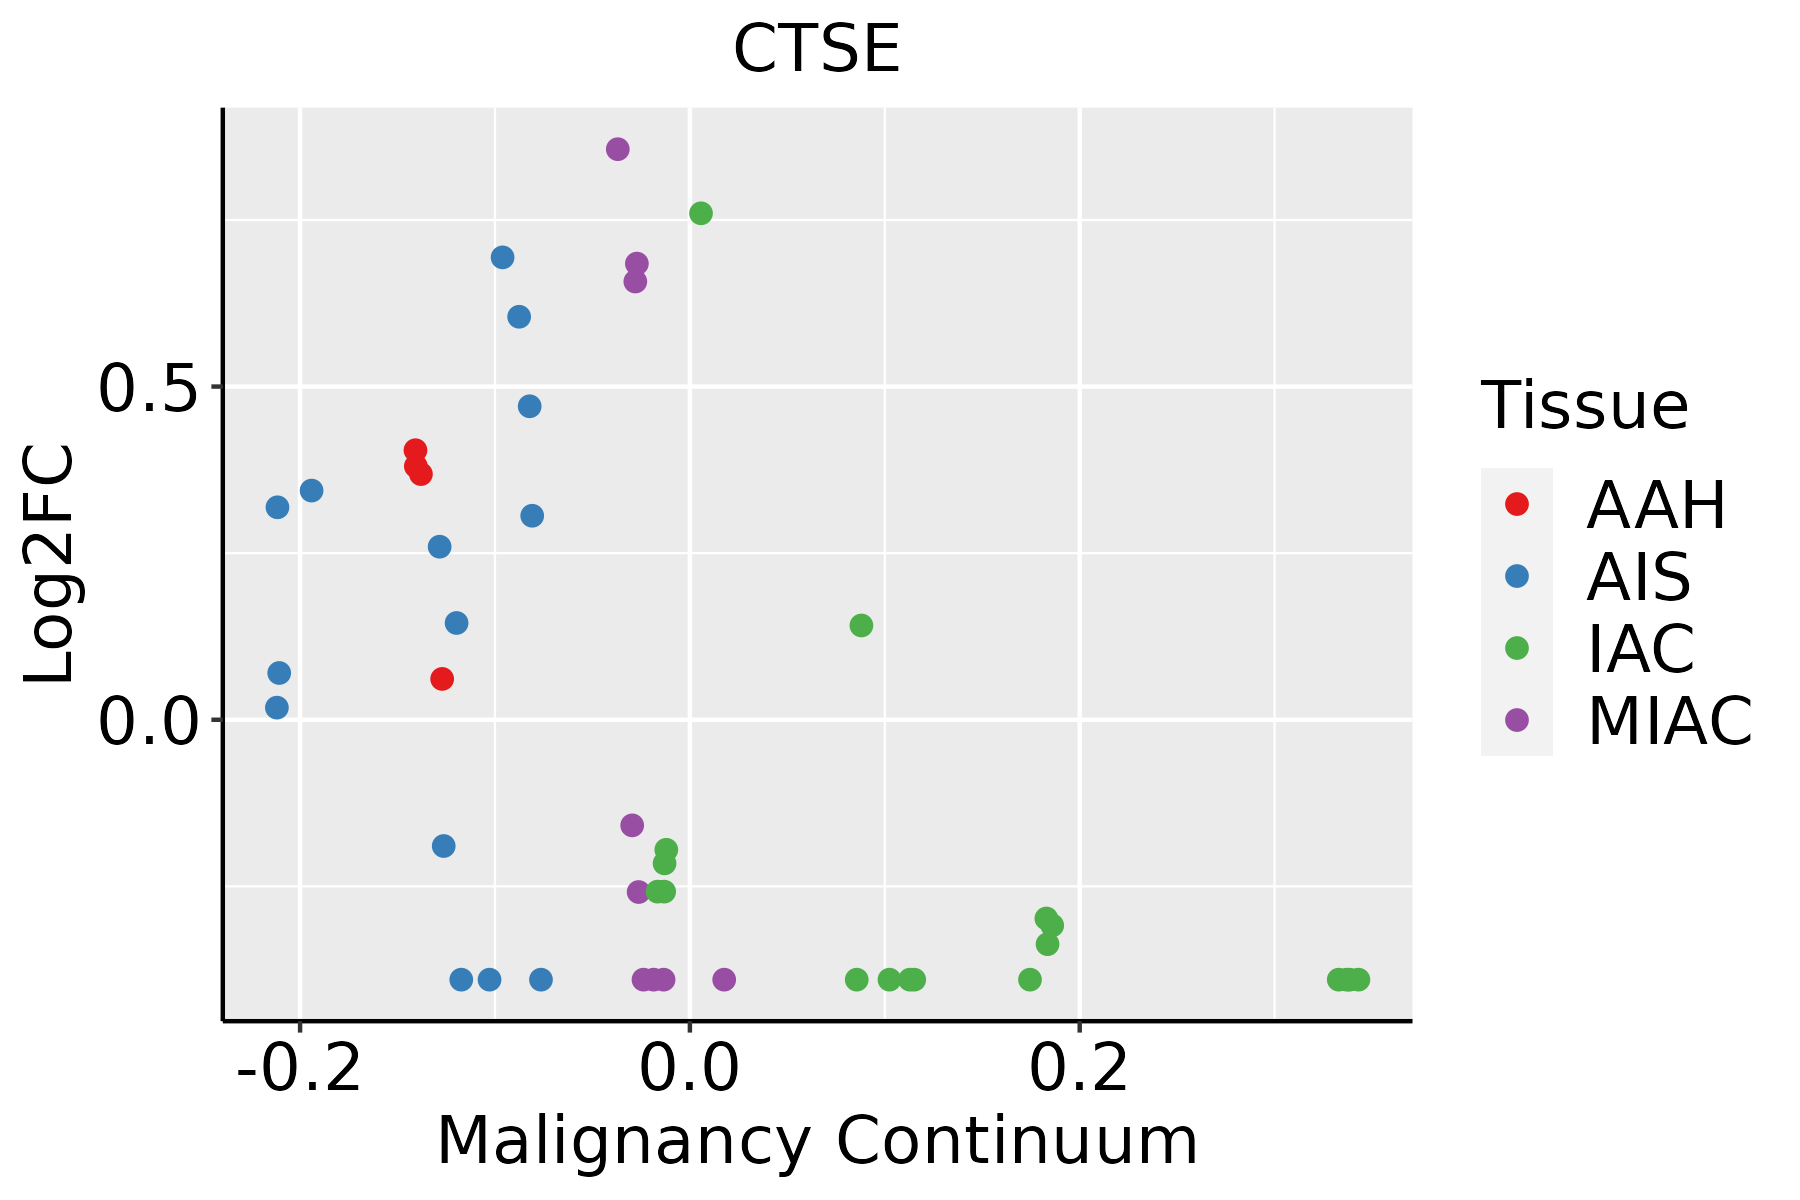
AAH: Atypical adenomatous hyperplasia
AIS: Adenocarcinoma in situ
IAC: Invasive lung adenocarcinoma
MIA: Minimally invasive adenocarcinoma
∗log2FC in expression of this searched gene in stem-like cells from each diseased tissue sample relative to stem-like cells in normal samples in each tissue plotted against the malignancy continuum. Samples are colored based on if they are from different disease stage.

Top

Malignant transformation related pathway analysis

check buttonFind out the enriched GO biological processes and KEGG pathways involved in transition from healthy to precancer to cancer
check button Figure of enriched GO biological processes.
TissueDisease StageEnriched GO biological Processes
ColorectumADGO analysis - Figure of enriched GO biological processes: Top 15 enriched GO BP terms are showed in the bar plot of each disease state in each tissue. Each row represents a significant GO biological process which is colored according to the -log10(p.adjust).
ColorectumSERGO analysis - Figure of enriched GO biological processes: Top 15 enriched GO BP terms are showed in the bar plot of each disease state in each tissue. Each row represents a significant GO biological process which is colored according to the -log10(p.adjust).
ColorectumMSSGO analysis - Figure of enriched GO biological processes: Top 15 enriched GO BP terms are showed in the bar plot of each disease state in each tissue. Each row represents a significant GO biological process which is colored according to the -log10(p.adjust).
ColorectumMSI-HGO analysis - Figure of enriched GO biological processes: Top 15 enriched GO BP terms are showed in the bar plot of each disease state in each tissue. Each row represents a significant GO biological process which is colored according to the -log10(p.adjust).
ColorectumFAPGO analysis - Figure of enriched GO biological processes: Top 15 enriched GO BP terms are showed in the bar plot of each disease state in each tissue. Each row represents a significant GO biological process which is colored according to the -log10(p.adjust).
∗Top 15 enriched GO BP terms are showed in the bar plot of each disease state in each tissue. Each row represents a significant GO biological process which is colored according to the -log10(p.adjust).
Page: 1 2 3 4 5 6 7 8 9 

check button Enriched GO biological processes.
GO IDTissueDisease StageDescriptionGene RatioBg Ratiopvaluep.adjustCount
GO:0051604ColorectumADprotein maturation85/3918294/187236.73e-046.91e-0385
GO:0016485ColorectumADprotein processing63/3918225/187236.77e-034.19e-0263
GO:00516041ColorectumSERprotein maturation73/2897294/187231.82e-055.38e-0473
GO:00164851ColorectumSERprotein processing55/2897225/187232.84e-044.67e-0355
GO:0048002ColorectumSERantigen processing and presentation of peptide antigen19/289762/187231.96e-031.97e-0219
GO:0019882ColorectumSERantigen processing and presentation28/2897106/187232.52e-032.34e-0228
GO:005160412LiverHCCprotein maturation171/7958294/187233.80e-088.30e-07171
GO:001988212LiverHCCantigen processing and presentation65/7958106/187237.06e-056.37e-0465
GO:000247811LiverHCCantigen processing and presentation of exogenous peptide antigen27/795838/187233.47e-042.42e-0327
GO:004800212LiverHCCantigen processing and presentation of peptide antigen40/795862/187233.84e-042.62e-0340
GO:001648511LiverHCCprotein processing121/7958225/187234.01e-042.71e-03121
GO:001988611LiverHCCantigen processing and presentation of exogenous peptide antigen via MHC class II22/795830/187236.14e-043.82e-0322
GO:001988411LiverHCCantigen processing and presentation of exogenous antigen31/795847/187239.90e-045.71e-0331
GO:000250411LiverHCCantigen processing and presentation of peptide or polysaccharide antigen via MHC class II24/795836/187232.95e-031.38e-0224
GO:000249511LiverHCCantigen processing and presentation of peptide antigen via MHC class II22/795834/187237.46e-032.96e-0222
GO:00198867LungIACantigen processing and presentation of exogenous peptide antigen via MHC class II10/206130/187239.63e-041.16e-0210
GO:00025046LungIACantigen processing and presentation of peptide or polysaccharide antigen via MHC class II11/206136/187231.23e-031.42e-0211
GO:00024788LungIACantigen processing and presentation of exogenous peptide antigen11/206138/187232.00e-032.01e-0211
GO:00024956LungIACantigen processing and presentation of peptide antigen via MHC class II10/206134/187232.79e-032.52e-0210
GO:00198848LungIACantigen processing and presentation of exogenous antigen12/206147/187234.05e-033.31e-0212
Page: 1 2 3 4 

check button Enriched KEGG pathways.
Pathway IDTissueDisease StageDescriptionGene RatioBg Ratiopvaluep.adjustqvalueCount
hsa04142ColorectumSERLysosome38/1580132/84652.87e-032.03e-021.47e-0238
hsa041421ColorectumSERLysosome38/1580132/84652.87e-032.03e-021.47e-0238
hsa041422LiverHCCLysosome100/4020132/84652.32e-114.31e-102.40e-10100
hsa041423LiverHCCLysosome100/4020132/84652.32e-114.31e-102.40e-10100
Page: 1 

Top

Cell-cell communication analysis

check buttonIdentification of potential cell-cell interactions between two cell types and their ligand-receptor pairs for different disease states
LigandReceptorLRpairPathwayTissueDisease Stage
Page: 1 

Top

Single-cell gene regulatory network inference analysis

check buttonFind out the significant the regulons (TFs) and the target genes of each regulon across cell types for different disease states
TFCell TypeTissueDisease StageTarget GeneRSSRegulon Activity
∗The dot plots of a searched regulon are shown for all cell subpopulations in each disease state of each tissue based on the regulon specific score inferred using pySCENIC and by calculating the average expression.
Page: 1 

Top

Somatic mutation of malignant transformation related genes

check buttonAnnotation of somatic variants for genes involved in malignant transformation
Hugo SymbolVariant ClassVariant ClassificationdbSNP RSHGVScHGVSpHGVSp ShortSWISSPROTBIOTYPESIFTPolyPhenTumor Sample BarcodeTissueHistologySexAgeStageTherapy TypesDrugsOutcome
CTSESNVMissense_Mutationrs782358758c.628G>Cp.Val210Leup.V210LP14091protein_codingtolerated(0.15)probably_damaging(0.968)TCGA-A8-A09M-01Breastbreast invasive carcinomaFemale>=65III/IVChemotherapypaclitaxelCR
CTSESNVMissense_Mutationnovelc.813C>Ap.Phe271Leup.F271LP14091protein_codingtolerated(0.54)possibly_damaging(0.859)TCGA-AN-A046-01Breastbreast invasive carcinomaFemale>=65I/IIUnknownUnknownSD
CTSEinsertionFrame_Shift_Insnovelc.360_361insATTAATATATGTTATATAATATATAATATATTp.Gln121IlefsTer49p.Q121Ifs*49P14091protein_codingTCGA-A8-A06O-01Breastbreast invasive carcinomaFemale<65I/IIHormone TherapyletrozoleSD
CTSEinsertionNonsense_Mutationnovelc.814_815insCAGCCCTACCCCTAAGCCTCTATTAACTCCTTCCCAAAp.Cys272SerfsTer9p.C272Sfs*9P14091protein_codingTCGA-BH-A0HU-01Breastbreast invasive carcinomaFemale<65I/IIChemotherapydocetaxelSD
CTSESNVMissense_Mutationc.646T>Cp.Ser216Prop.S216PP14091protein_codingdeleterious(0)probably_damaging(0.942)TCGA-EA-A3HT-01Cervixcervical & endocervical cancerFemale>=65I/IIUnknownUnknownSD
CTSESNVMissense_Mutationnovelc.934N>Cp.Val312Leup.V312LP14091protein_codingtolerated(0.07)benign(0.085)TCGA-AA-3950-01Colorectumcolon adenocarcinomaFemale>=65I/IIUnknownUnknownSD
CTSESNVMissense_Mutationc.55G>Ap.Gly19Argp.G19RP14091protein_codingtolerated(0.48)benign(0.031)TCGA-AA-A00N-01Colorectumcolon adenocarcinomaMale>=65I/IIUnknownUnknownPD
CTSESNVMissense_Mutationnovelc.451N>Ap.Asp151Asnp.D151NP14091protein_codingdeleterious(0)probably_damaging(0.999)TCGA-EI-6917-01Colorectumrectum adenocarcinomaMale<65III/IVChemotherapy5fluorouracil+oxaciplatina+l-folinianSD
CTSEdeletionFrame_Shift_Delnovelc.1021delNp.Leu341TyrfsTer71p.L341Yfs*71P14091protein_codingTCGA-F4-6570-01Colorectumcolon adenocarcinomaFemale>=65I/IIUnknownUnknownSD
CTSESNVMissense_Mutationnovelc.638N>Tp.Pro213Leup.P213LP14091protein_codingdeleterious(0)probably_damaging(0.999)TCGA-A5-A0G2-01Endometriumuterine corpus endometrioid carcinomaFemale<65III/IVUnknownUnknownSD
Page: 1 2 3 4 

Top

Related drugs of malignant transformation related genes

check buttonIdentification of chemicals and drugs interact with genes involved in malignant transfromation
(DGIdb 4.0)
Entrez IDSymbolCategoryInteraction TypesDrug Claim NameDrug NamePMIDs
1510CTSEDRUGGABLE GENOME, PROTEASE, ENZYMEinhibitor178103180
1510CTSEDRUGGABLE GENOME, PROTEASE, ENZYMEinhibitor252166834
1510CTSEDRUGGABLE GENOME, PROTEASE, ENZYMEinhibitor252166874
Page: 1