
|
|||||
|
 | |
| |
| |
| |
| |
| |
|
Gene: CTSD |
Gene summary for CTSD |
| Gene information | Species | Human | Gene symbol | CTSD | Gene ID | 1509 |
| Gene name | cathepsin D | |
| Gene Alias | CLN10 | |
| Cytomap | 11p15.5 | |
| Gene Type | protein-coding | GO ID | GO:0002376 | UniProtAcc | P07339 |
Top |
Malignant transformation analysis |
| Identification of the aberrant gene expression in precancerous and cancerous lesions by comparing the gene expression of stem-like cells in diseased tissues with normal stem cells |
| Entrez ID | Symbol | Replicates | Species | Organ | Tissue | Adj P-value | Log2FC | Malignancy |
| 1509 | CTSD | GSM4909281 | Human | Breast | IDC | 2.51e-13 | 5.43e-01 | 0.21 |
| 1509 | CTSD | GSM4909286 | Human | Breast | IDC | 1.14e-08 | -2.46e-01 | 0.1081 |
| 1509 | CTSD | GSM4909292 | Human | Breast | IDC | 1.17e-07 | 6.50e-01 | 0.1236 |
| 1509 | CTSD | GSM4909295 | Human | Breast | IDC | 1.02e-05 | 4.37e-01 | 0.0898 |
| 1509 | CTSD | GSM4909296 | Human | Breast | IDC | 4.77e-12 | 4.17e-01 | 0.1524 |
| 1509 | CTSD | GSM4909297 | Human | Breast | IDC | 1.58e-10 | -1.36e-01 | 0.1517 |
| 1509 | CTSD | GSM4909299 | Human | Breast | IDC | 5.21e-03 | 3.56e-01 | 0.035 |
| 1509 | CTSD | GSM4909305 | Human | Breast | IDC | 3.85e-05 | 3.28e-01 | 0.0436 |
| 1509 | CTSD | GSM4909307 | Human | Breast | IDC | 8.80e-10 | 4.71e-01 | 0.1569 |
| 1509 | CTSD | GSM4909308 | Human | Breast | IDC | 3.78e-21 | 5.82e-01 | 0.158 |
| 1509 | CTSD | GSM4909311 | Human | Breast | IDC | 7.67e-30 | 1.20e-01 | 0.1534 |
| 1509 | CTSD | GSM4909312 | Human | Breast | IDC | 4.91e-09 | 1.61e-01 | 0.1552 |
| 1509 | CTSD | GSM4909313 | Human | Breast | IDC | 3.77e-09 | 4.04e-01 | 0.0391 |
| 1509 | CTSD | GSM4909317 | Human | Breast | IDC | 7.67e-40 | 8.48e-01 | 0.1355 |
| 1509 | CTSD | GSM4909318 | Human | Breast | IDC | 2.17e-04 | 3.07e-01 | 0.2031 |
| 1509 | CTSD | GSM4909319 | Human | Breast | IDC | 2.55e-28 | -1.98e-01 | 0.1563 |
| 1509 | CTSD | GSM4909321 | Human | Breast | IDC | 4.92e-14 | 1.96e-01 | 0.1559 |
| 1509 | CTSD | brca2 | Human | Breast | Precancer | 7.09e-12 | 3.90e-01 | -0.024 |
| 1509 | CTSD | brca3 | Human | Breast | Precancer | 3.72e-05 | 2.97e-01 | -0.0263 |
| 1509 | CTSD | M2 | Human | Breast | IDC | 4.95e-02 | 2.28e-01 | 0.21 |
| Page: 1 2 3 4 5 6 7 8 9 10 11 12 13 14 |
| Tissue | Expression Dynamics | Abbreviation |
| Breast |  | IDC: Invasive ductal carcinoma |
| DCIS: Ductal carcinoma in situ | ||
| Precancer(BRCA1-mut): Precancerous lesion from BRCA1 mutation carriers | ||
| Cervix | 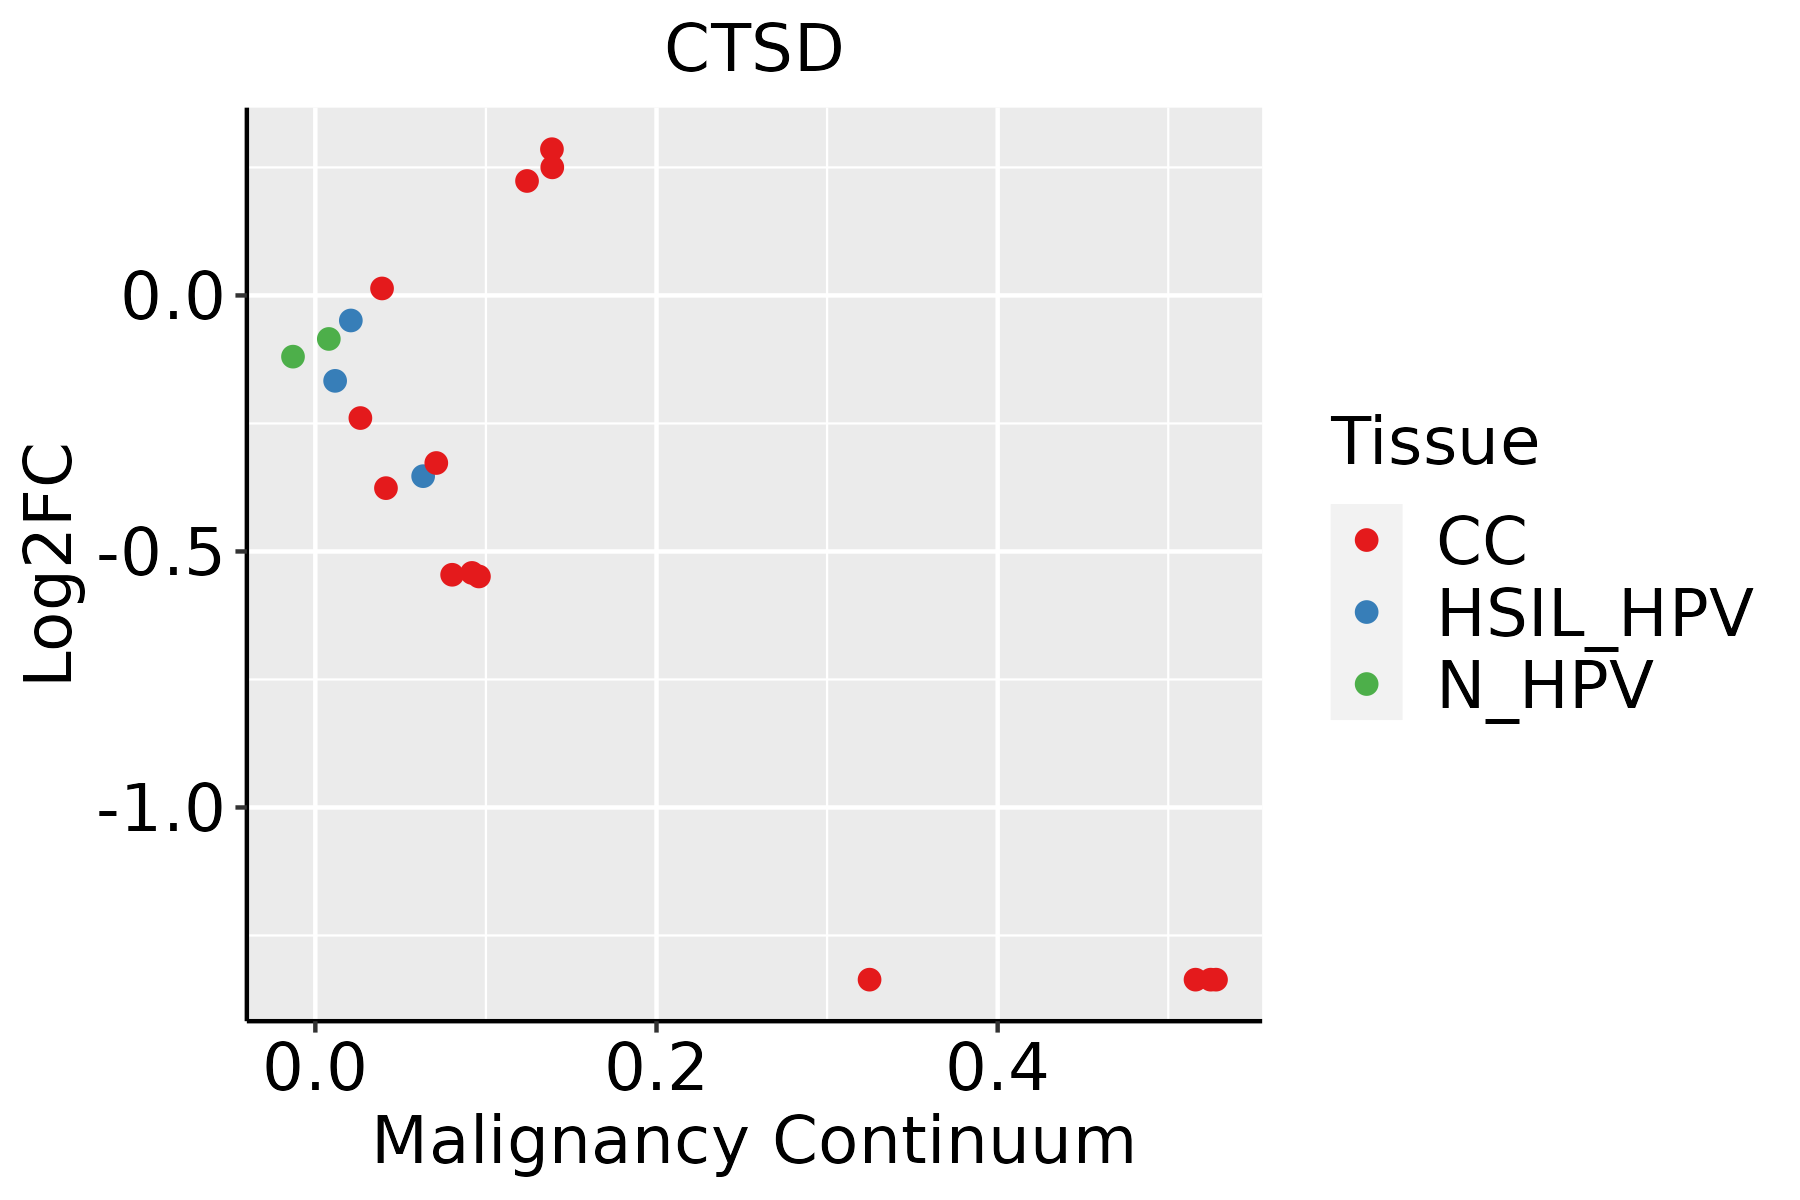 | CC: Cervix cancer |
| HSIL_HPV: HPV-infected high-grade squamous intraepithelial lesions | ||
| N_HPV: HPV-infected normal cervix | ||
| Colorectum (GSE201348) |  | FAP: Familial adenomatous polyposis |
| CRC: Colorectal cancer | ||
| Colorectum (HTA11) |  | AD: Adenomas |
| SER: Sessile serrated lesions | ||
| MSI-H: Microsatellite-high colorectal cancer | ||
| MSS: Microsatellite stable colorectal cancer | ||
| Endometrium |  | AEH: Atypical endometrial hyperplasia |
| EEC: Endometrioid Cancer | ||
| Esophagus | 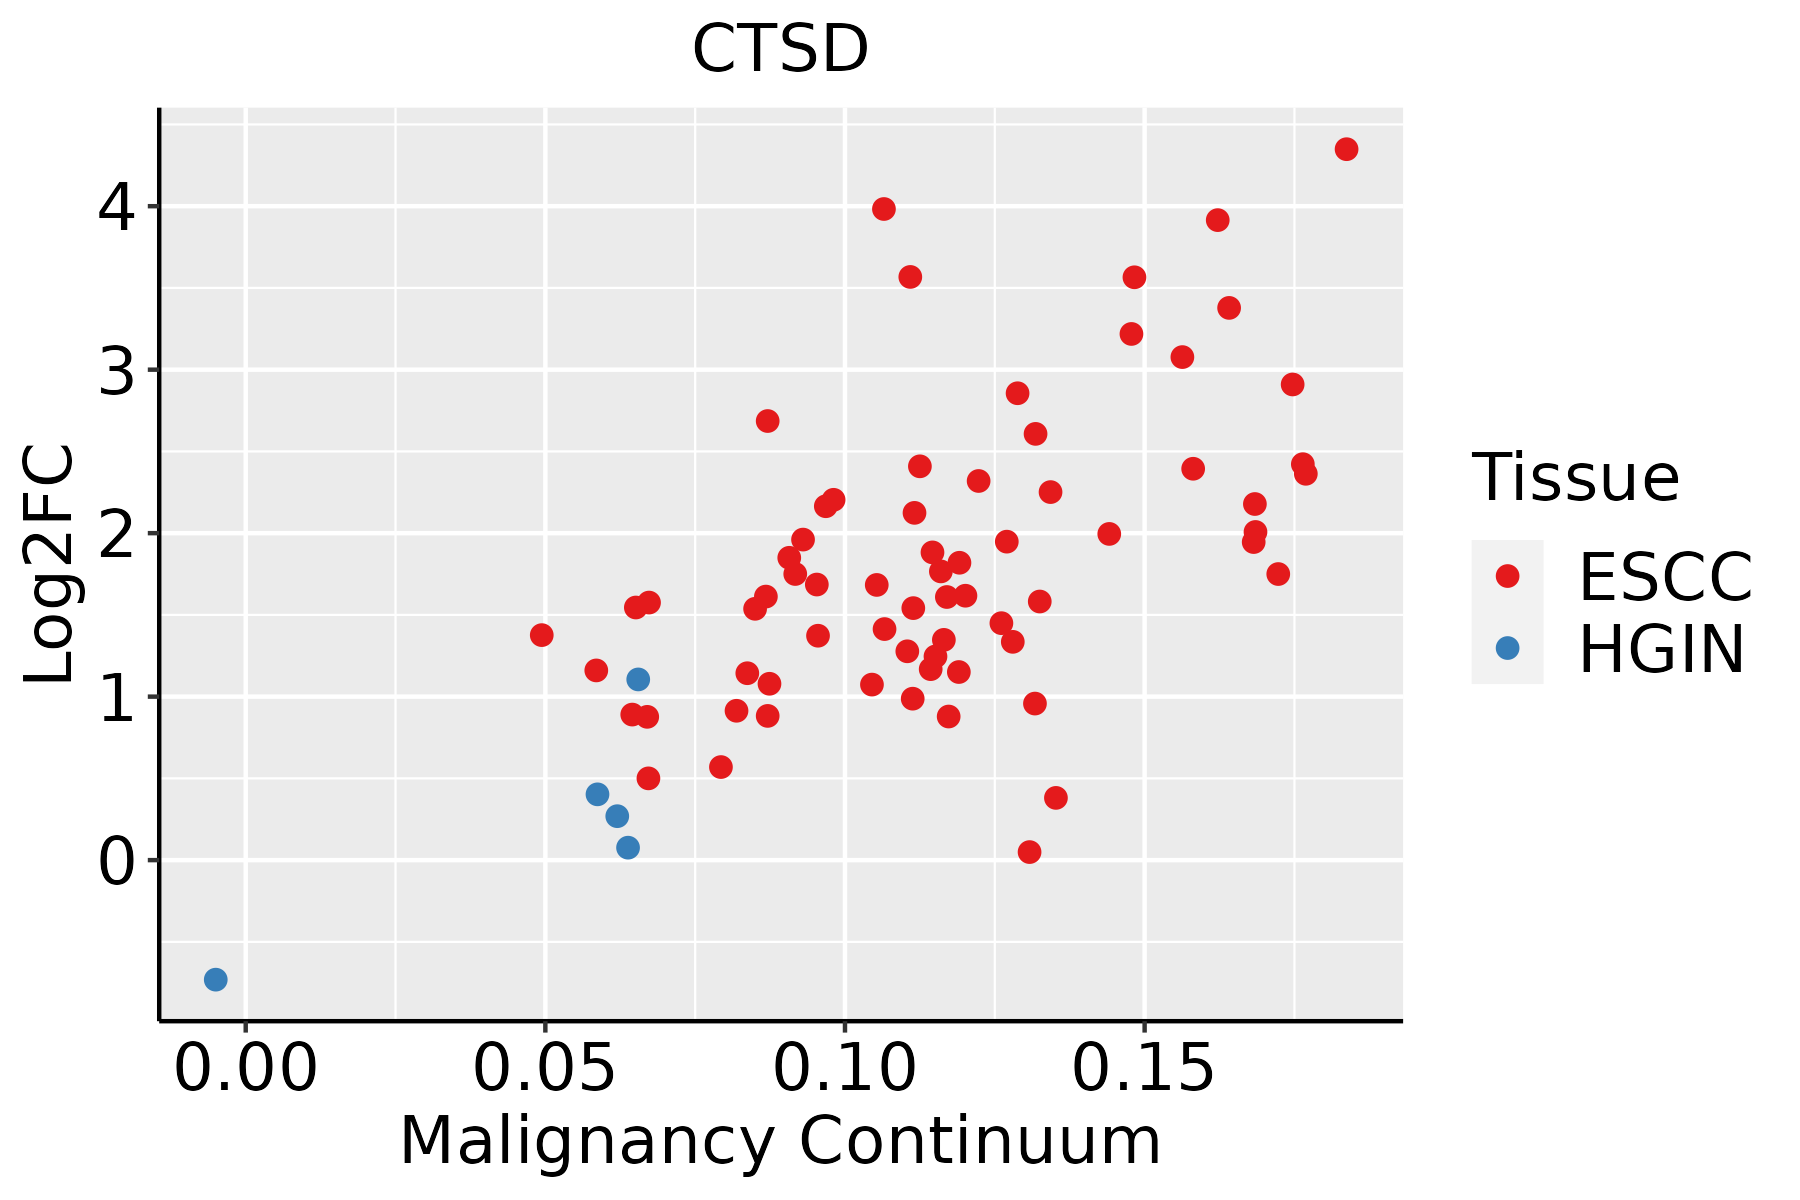 | ESCC: Esophageal squamous cell carcinoma |
| HGIN: High-grade intraepithelial neoplasias | ||
| LGIN: Low-grade intraepithelial neoplasias | ||
| GC | 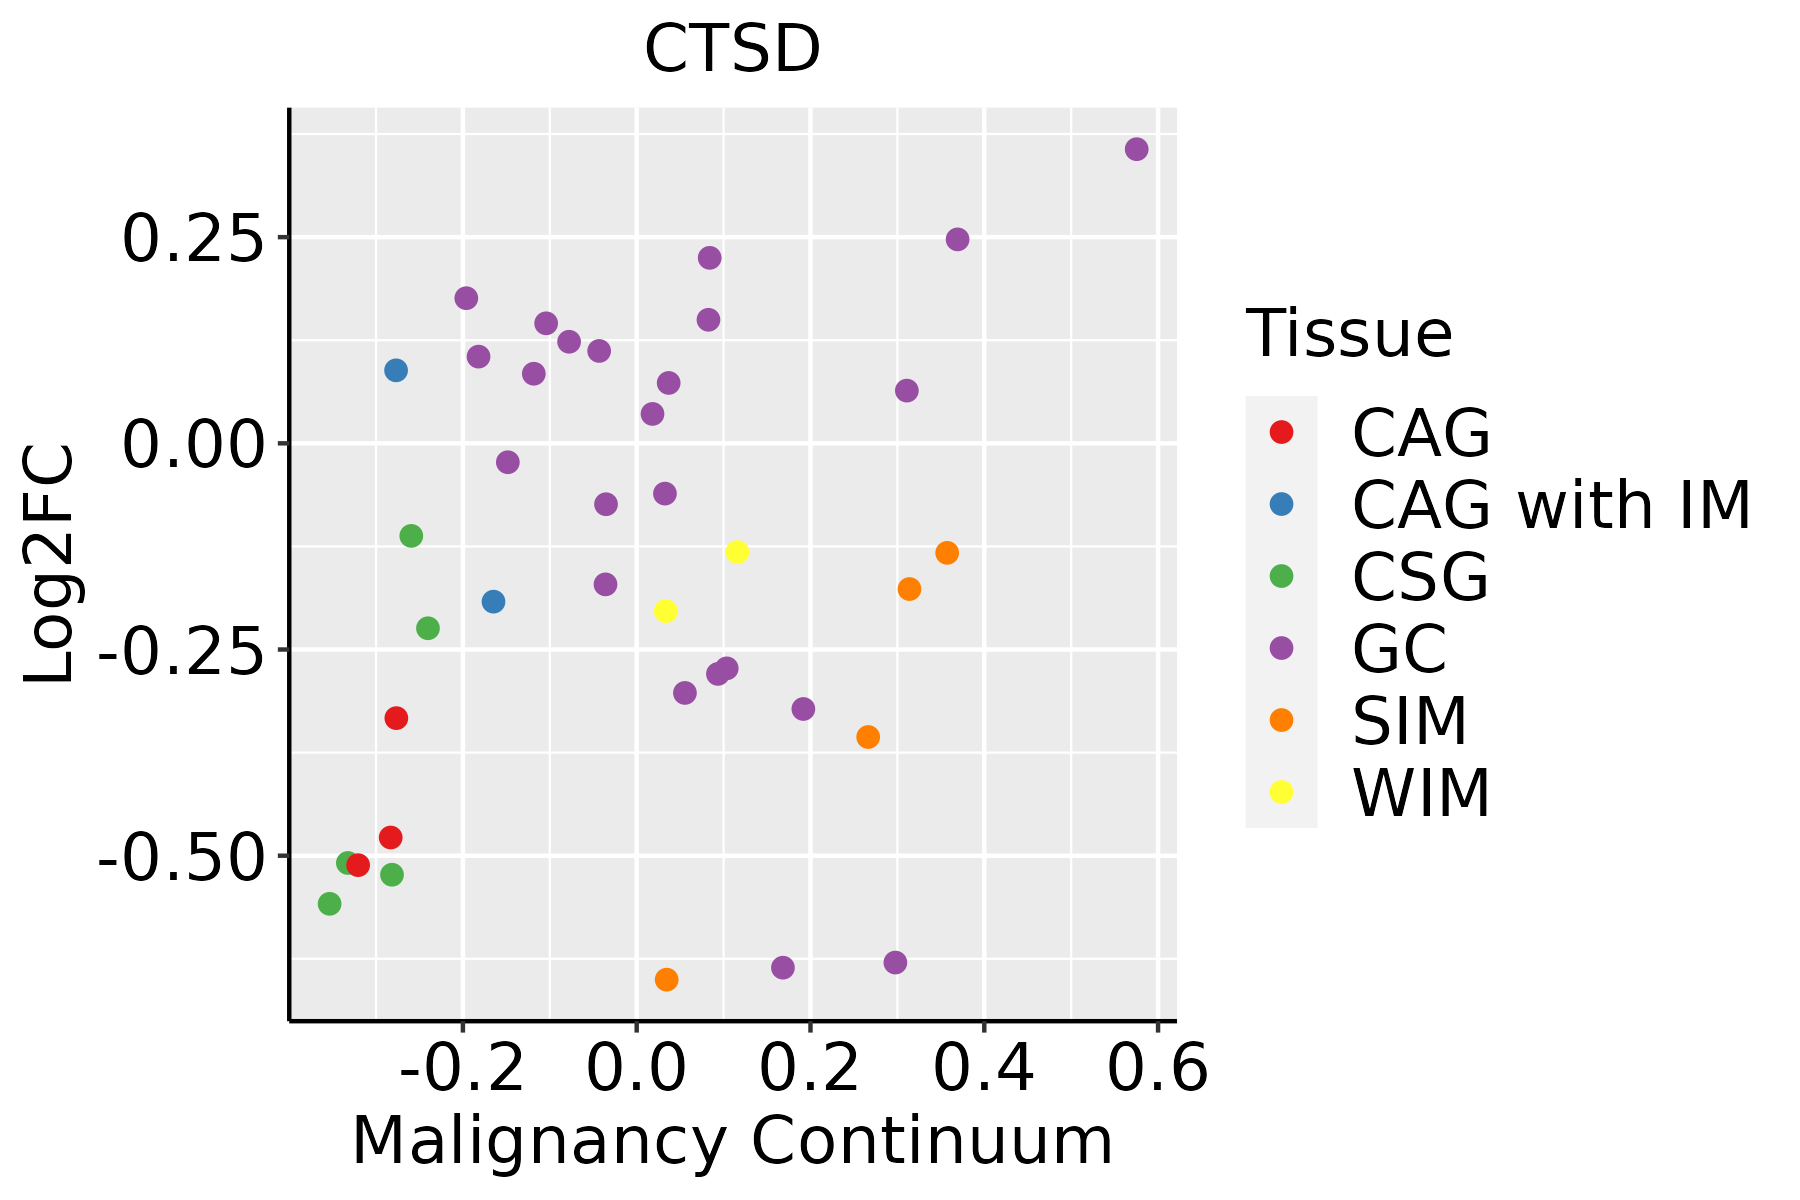 | CAG: Chronic atrophic gastritis |
| CAG with IM: Chronic atrophic gastritis with intestinal metaplasia | ||
| CSG: Chronic superficial gastritis | ||
| GC: Gastric cancer | ||
| SIM: Severe intestinal metaplasia | ||
| WIM: Wild intestinal metaplasia | ||
| Liver | 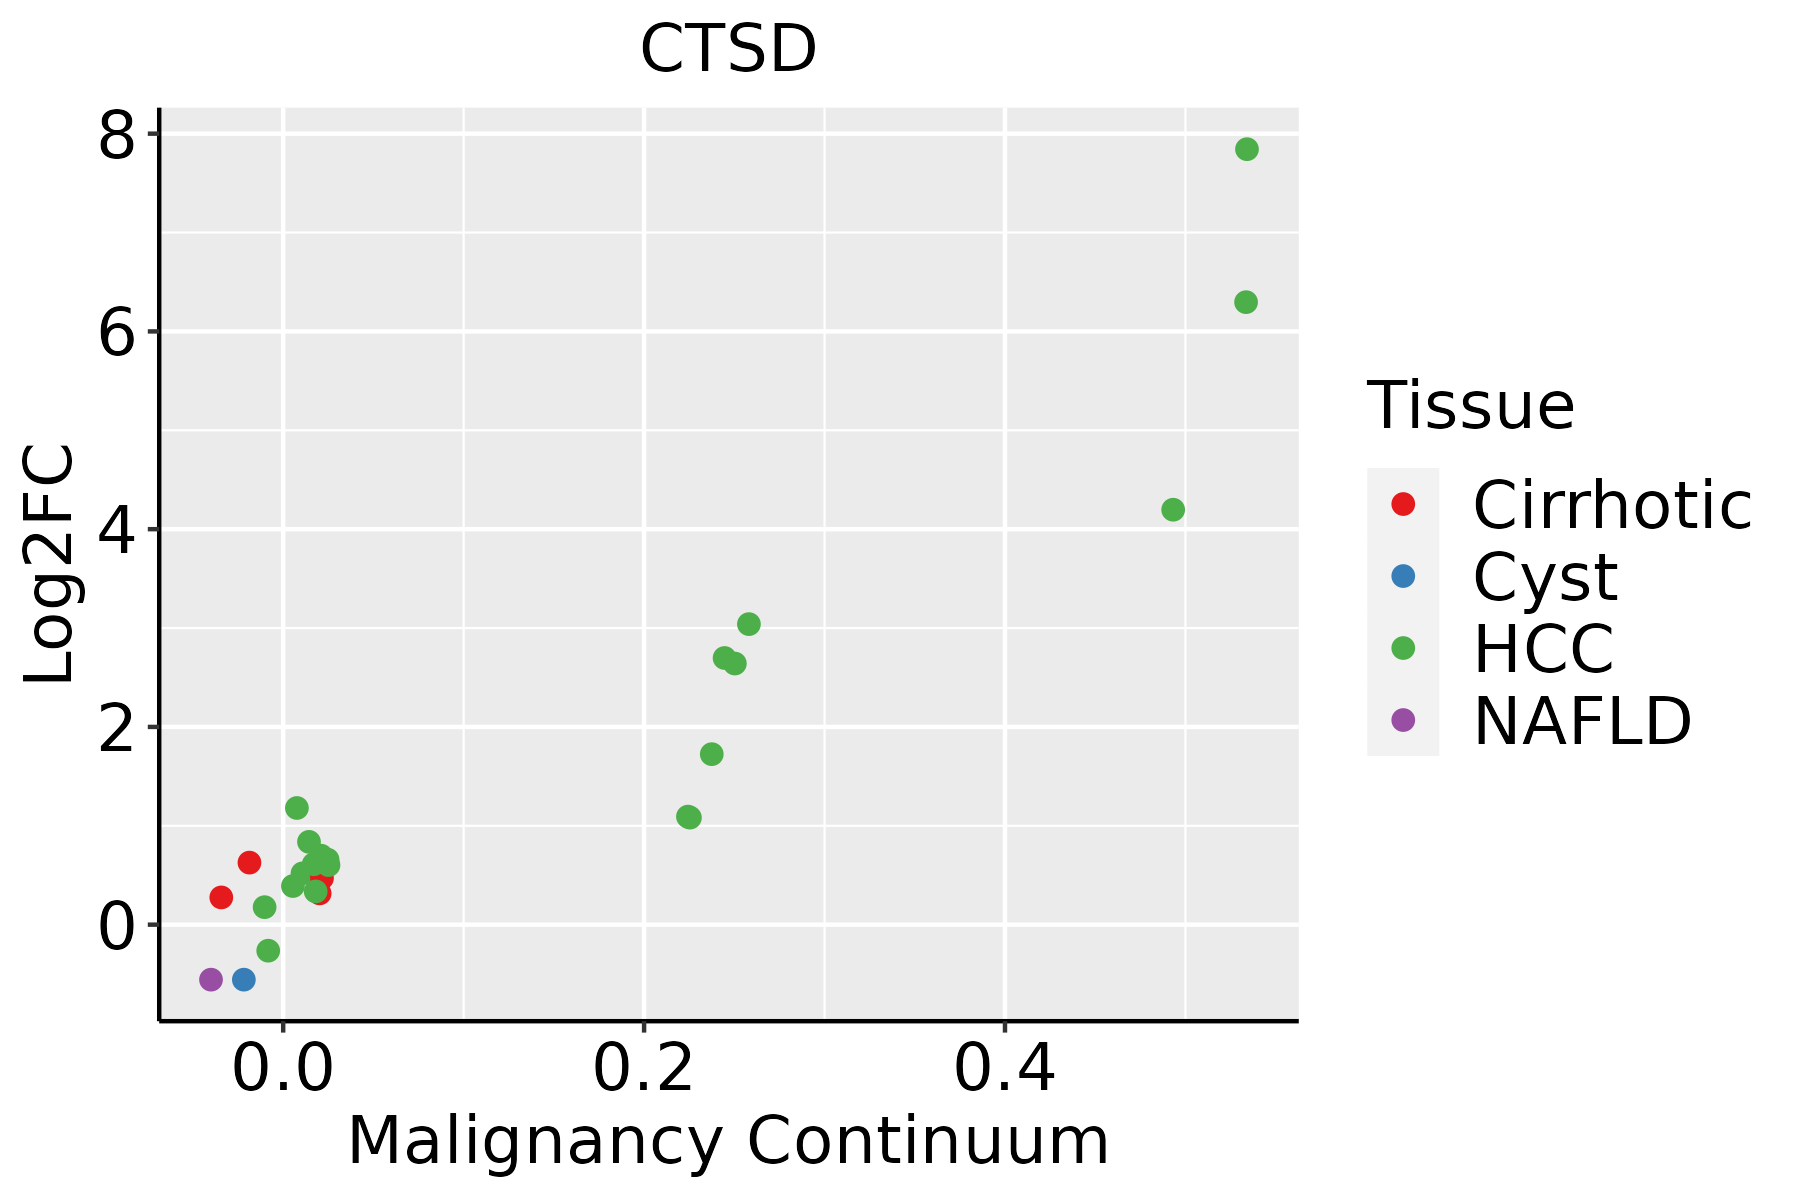 | HCC: Hepatocellular carcinoma |
| NAFLD: Non-alcoholic fatty liver disease | ||
| Oral Cavity | 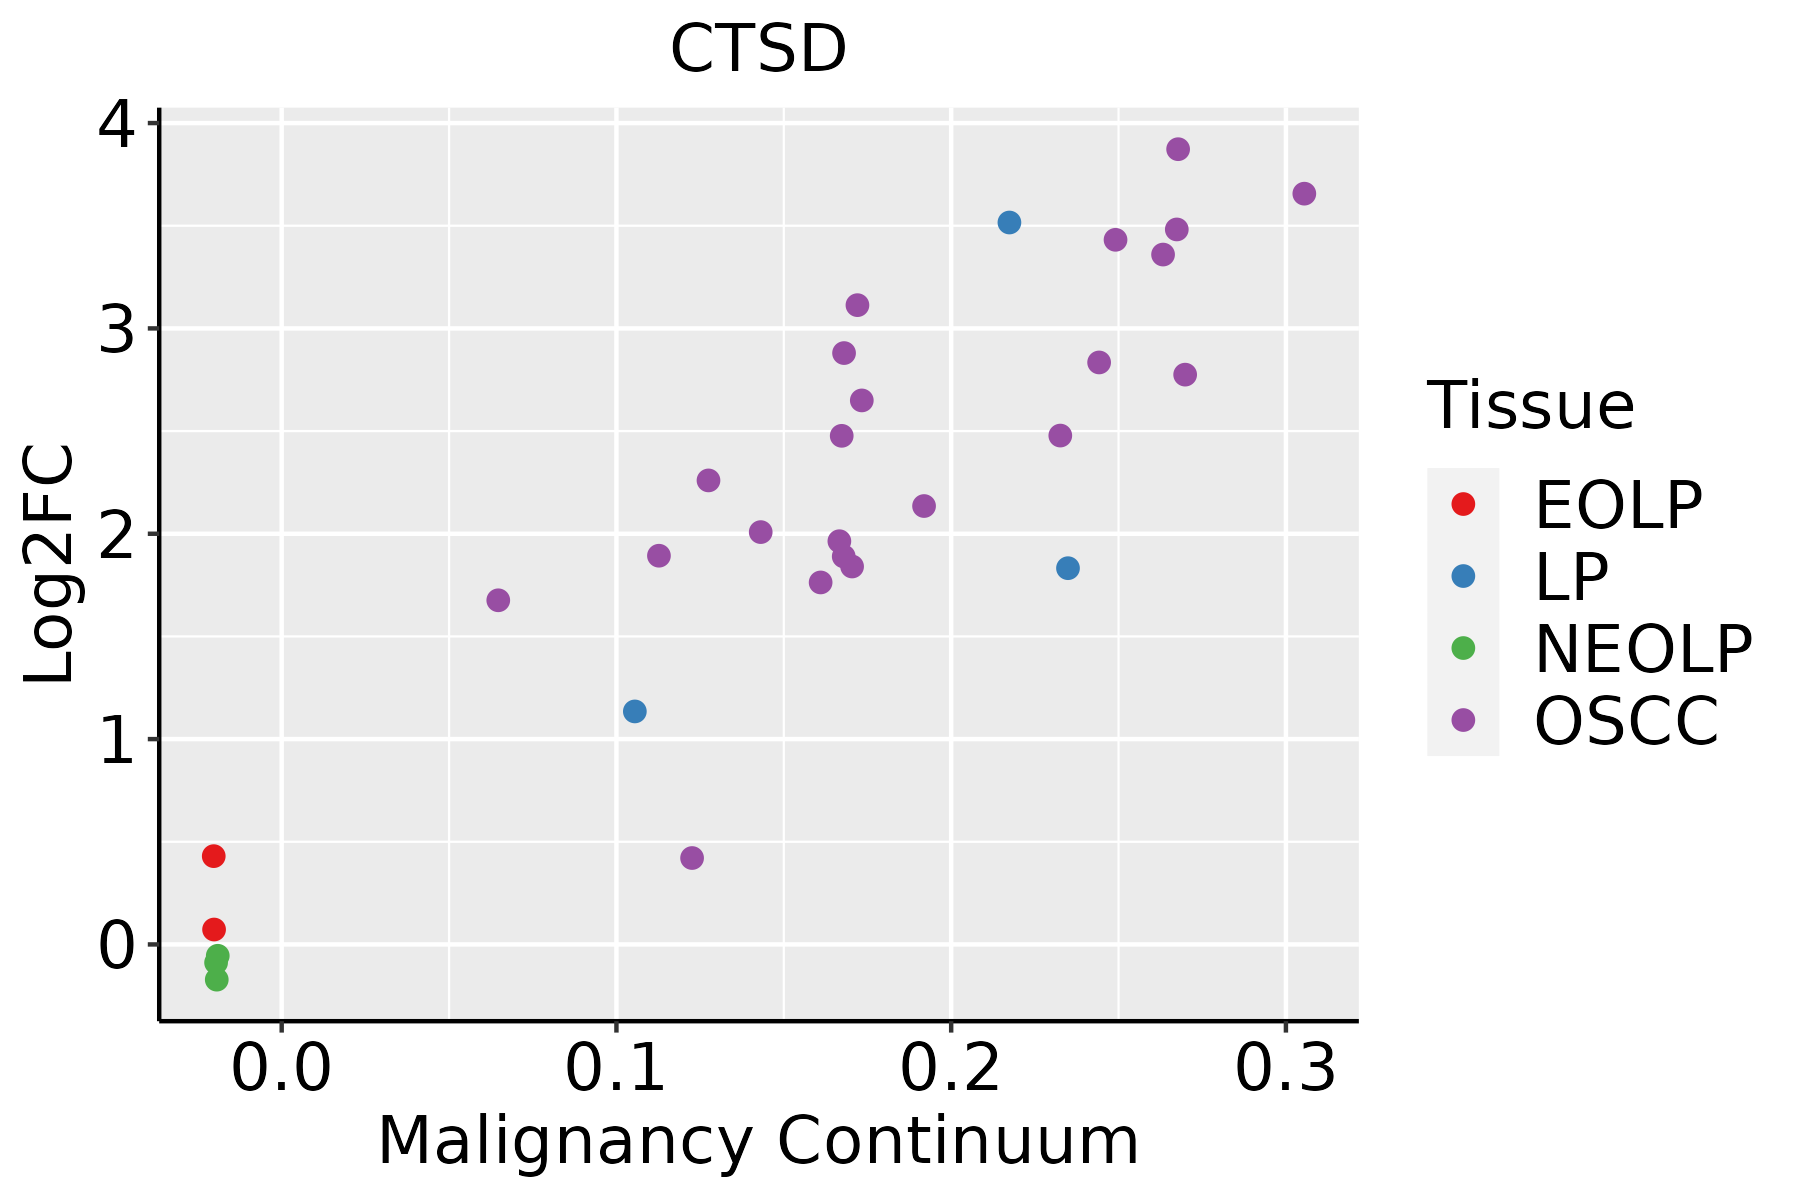 | EOLP: Erosive Oral lichen planus |
| LP: leukoplakia | ||
| NEOLP: Non-erosive oral lichen planus | ||
| OSCC: Oral squamous cell carcinoma | ||
| Prostate |  | BPH: Benign Prostatic Hyperplasia |
| Skin |  | AK: Actinic keratosis |
| cSCC: Cutaneous squamous cell carcinoma | ||
| SCCIS:squamous cell carcinoma in situ | ||
| Thyroid | 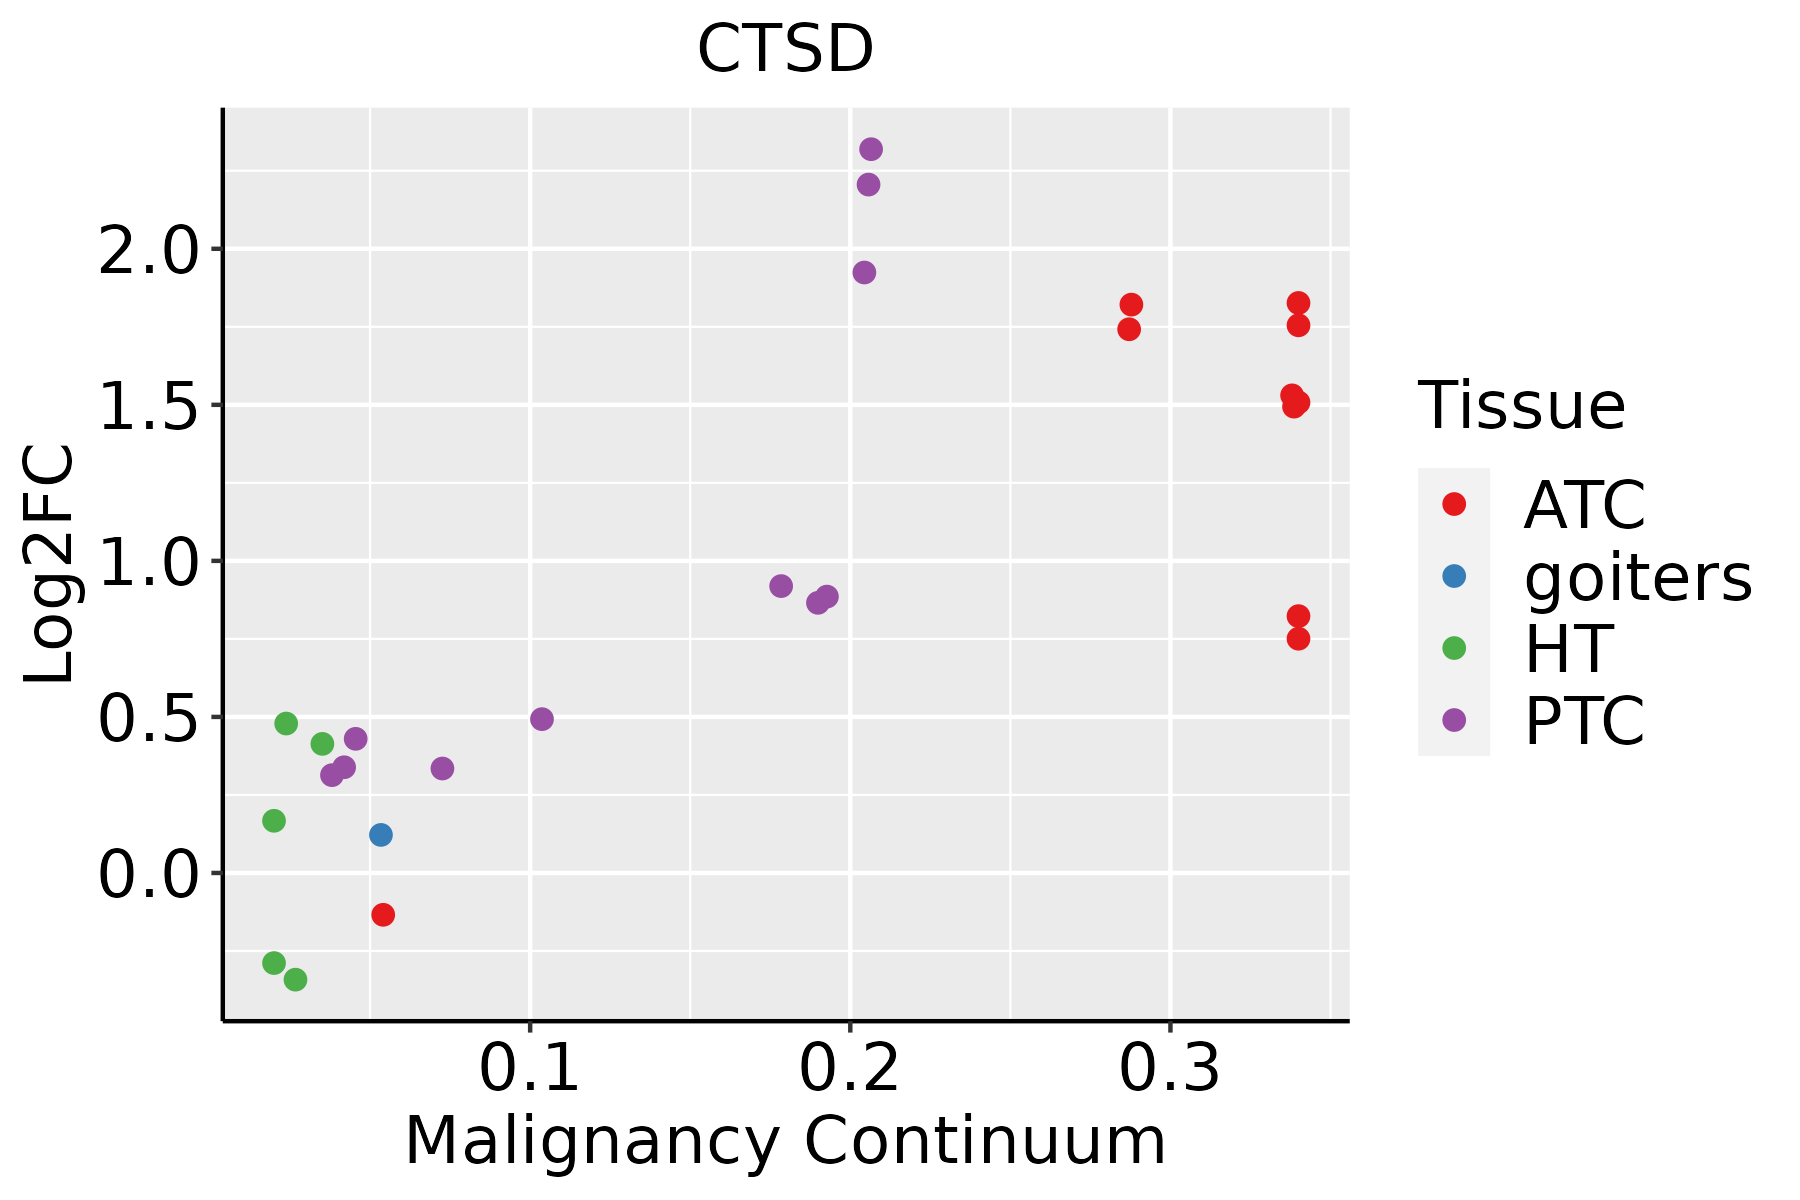 | ATC: Anaplastic thyroid cancer |
| HT: Hashimoto's thyroiditis | ||
| PTC: Papillary thyroid cancer |
| ∗log2FC in expression of this searched gene in stem-like cells from each diseased tissue sample relative to stem-like cells in normal samples in each tissue plotted against the malignancy continuum. Samples are colored based on if they are from different disease stage. |
Top |
Malignant transformation related pathway analysis |
| Find out the enriched GO biological processes and KEGG pathways involved in transition from healthy to precancer to cancer |
| Tissue | Disease Stage | Enriched GO biological Processes |
| Colorectum | AD |  |
| Colorectum | SER |  |
| Colorectum | MSS |  |
| Colorectum | MSI-H |  |
| Colorectum | FAP |  |
| ∗Top 15 enriched GO BP terms are showed in the bar plot of each disease state in each tissue. Each row represents a significant GO biological process which is colored according to the -log10(p.adjust). |
| Page: 1 2 3 4 5 6 7 8 9 |
| GO ID | Tissue | Disease Stage | Description | Gene Ratio | Bg Ratio | pvalue | p.adjust | Count |
| GO:00525479 | Breast | Precancer | regulation of peptidase activity | 71/1080 | 461/18723 | 2.72e-14 | 6.94e-12 | 71 |
| GO:00525489 | Breast | Precancer | regulation of endopeptidase activity | 67/1080 | 432/18723 | 1.06e-13 | 2.36e-11 | 67 |
| GO:20001169 | Breast | Precancer | regulation of cysteine-type endopeptidase activity | 43/1080 | 235/18723 | 1.30e-11 | 1.83e-09 | 43 |
| GO:00432819 | Breast | Precancer | regulation of cysteine-type endopeptidase activity involved in apoptotic process | 40/1080 | 209/18723 | 1.59e-11 | 2.07e-09 | 40 |
| GO:00458629 | Breast | Precancer | positive regulation of proteolysis | 51/1080 | 372/18723 | 7.77e-09 | 5.70e-07 | 51 |
| GO:00109529 | Breast | Precancer | positive regulation of peptidase activity | 33/1080 | 197/18723 | 3.01e-08 | 1.89e-06 | 33 |
| GO:00432808 | Breast | Precancer | positive regulation of cysteine-type endopeptidase activity involved in apoptotic process | 24/1080 | 129/18723 | 3.13e-07 | 1.50e-05 | 24 |
| GO:00109509 | Breast | Precancer | positive regulation of endopeptidase activity | 29/1080 | 179/18723 | 4.23e-07 | 1.90e-05 | 29 |
| GO:20010568 | Breast | Precancer | positive regulation of cysteine-type endopeptidase activity | 25/1080 | 148/18723 | 1.19e-06 | 4.60e-05 | 25 |
| GO:00480029 | Breast | Precancer | antigen processing and presentation of peptide antigen | 12/1080 | 62/18723 | 1.89e-04 | 3.04e-03 | 12 |
| GO:00024789 | Breast | Precancer | antigen processing and presentation of exogenous peptide antigen | 8/1080 | 38/18723 | 1.24e-03 | 1.32e-02 | 8 |
| GO:00198849 | Breast | Precancer | antigen processing and presentation of exogenous antigen | 8/1080 | 47/18723 | 5.04e-03 | 3.80e-02 | 8 |
| GO:00198868 | Breast | Precancer | antigen processing and presentation of exogenous peptide antigen via MHC class II | 6/1080 | 30/18723 | 6.54e-03 | 4.51e-02 | 6 |
| GO:005254714 | Breast | IDC | regulation of peptidase activity | 96/1434 | 461/18723 | 7.58e-20 | 6.15e-17 | 96 |
| GO:005254814 | Breast | IDC | regulation of endopeptidase activity | 88/1434 | 432/18723 | 1.20e-17 | 4.85e-15 | 88 |
| GO:200011614 | Breast | IDC | regulation of cysteine-type endopeptidase activity | 55/1434 | 235/18723 | 4.25e-14 | 1.21e-11 | 55 |
| GO:004328114 | Breast | IDC | regulation of cysteine-type endopeptidase activity involved in apoptotic process | 50/1434 | 209/18723 | 2.49e-13 | 6.14e-11 | 50 |
| GO:004586214 | Breast | IDC | positive regulation of proteolysis | 66/1434 | 372/18723 | 9.76e-11 | 1.29e-08 | 66 |
| GO:001095214 | Breast | IDC | positive regulation of peptidase activity | 40/1434 | 197/18723 | 1.04e-08 | 7.67e-07 | 40 |
| GO:004328013 | Breast | IDC | positive regulation of cysteine-type endopeptidase activity involved in apoptotic process | 29/1434 | 129/18723 | 1.10e-07 | 6.35e-06 | 29 |
| Page: 1 2 3 4 5 6 7 8 9 10 11 12 13 14 15 16 17 18 19 20 21 22 |
| Pathway ID | Tissue | Disease Stage | Description | Gene Ratio | Bg Ratio | pvalue | p.adjust | qvalue | Count |
| hsa0541518 | Breast | Precancer | Diabetic cardiomyopathy | 63/684 | 203/8465 | 5.63e-22 | 1.48e-20 | 1.14e-20 | 63 |
| hsa0491518 | Breast | Precancer | Estrogen signaling pathway | 28/684 | 138/8465 | 4.10e-06 | 5.39e-05 | 4.13e-05 | 28 |
| hsa042108 | Breast | Precancer | Apoptosis | 25/684 | 136/8465 | 7.61e-05 | 6.87e-04 | 5.26e-04 | 25 |
| hsa0541519 | Breast | Precancer | Diabetic cardiomyopathy | 63/684 | 203/8465 | 5.63e-22 | 1.48e-20 | 1.14e-20 | 63 |
| hsa0491519 | Breast | Precancer | Estrogen signaling pathway | 28/684 | 138/8465 | 4.10e-06 | 5.39e-05 | 4.13e-05 | 28 |
| hsa0421013 | Breast | Precancer | Apoptosis | 25/684 | 136/8465 | 7.61e-05 | 6.87e-04 | 5.26e-04 | 25 |
| hsa0541523 | Breast | IDC | Diabetic cardiomyopathy | 67/867 | 203/8465 | 3.17e-19 | 8.59e-18 | 6.43e-18 | 67 |
| hsa0491523 | Breast | IDC | Estrogen signaling pathway | 35/867 | 138/8465 | 2.55e-07 | 5.18e-06 | 3.88e-06 | 35 |
| hsa0421022 | Breast | IDC | Apoptosis | 31/867 | 136/8465 | 1.34e-05 | 1.61e-04 | 1.20e-04 | 31 |
| hsa0541533 | Breast | IDC | Diabetic cardiomyopathy | 67/867 | 203/8465 | 3.17e-19 | 8.59e-18 | 6.43e-18 | 67 |
| hsa0491533 | Breast | IDC | Estrogen signaling pathway | 35/867 | 138/8465 | 2.55e-07 | 5.18e-06 | 3.88e-06 | 35 |
| hsa0421032 | Breast | IDC | Apoptosis | 31/867 | 136/8465 | 1.34e-05 | 1.61e-04 | 1.20e-04 | 31 |
| hsa0541543 | Breast | DCIS | Diabetic cardiomyopathy | 65/846 | 203/8465 | 1.81e-18 | 4.87e-17 | 3.59e-17 | 65 |
| hsa0491542 | Breast | DCIS | Estrogen signaling pathway | 35/846 | 138/8465 | 1.40e-07 | 2.51e-06 | 1.85e-06 | 35 |
| hsa0421041 | Breast | DCIS | Apoptosis | 29/846 | 136/8465 | 5.92e-05 | 5.97e-04 | 4.40e-04 | 29 |
| hsa0541553 | Breast | DCIS | Diabetic cardiomyopathy | 65/846 | 203/8465 | 1.81e-18 | 4.87e-17 | 3.59e-17 | 65 |
| hsa0491552 | Breast | DCIS | Estrogen signaling pathway | 35/846 | 138/8465 | 1.40e-07 | 2.51e-06 | 1.85e-06 | 35 |
| hsa0421051 | Breast | DCIS | Apoptosis | 29/846 | 136/8465 | 5.92e-05 | 5.97e-04 | 4.40e-04 | 29 |
| hsa0541520 | Cervix | CC | Diabetic cardiomyopathy | 76/1267 | 203/8465 | 1.40e-15 | 6.46e-14 | 3.82e-14 | 76 |
| hsa0491520 | Cervix | CC | Estrogen signaling pathway | 44/1267 | 138/8465 | 3.55e-07 | 3.97e-06 | 2.35e-06 | 44 |
| Page: 1 2 3 4 5 6 7 8 9 10 |
Top |
Cell-cell communication analysis |
| Identification of potential cell-cell interactions between two cell types and their ligand-receptor pairs for different disease states |
| Ligand | Receptor | LRpair | Pathway | Tissue | Disease Stage |
| Page: 1 |
Top |
Single-cell gene regulatory network inference analysis |
| Find out the significant the regulons (TFs) and the target genes of each regulon across cell types for different disease states |
| TF | Cell Type | Tissue | Disease Stage | Target Gene | RSS | Regulon Activity |
| ∗The dot plots of a searched regulon are shown for all cell subpopulations in each disease state of each tissue based on the regulon specific score inferred using pySCENIC and by calculating the average expression. |
| Page: 1 |
Top |
Somatic mutation of malignant transformation related genes |
| Annotation of somatic variants for genes involved in malignant transformation |
| Hugo Symbol | Variant Class | Variant Classification | dbSNP RS | HGVSc | HGVSp | HGVSp Short | SWISSPROT | BIOTYPE | SIFT | PolyPhen | Tumor Sample Barcode | Tissue | Histology | Sex | Age | Stage | Therapy Types | Drugs | Outcome |
| CTSD | SNV | Missense_Mutation | c.1105N>A | p.Gly369Ser | p.G369S | P07339 | protein_coding | deleterious(0.03) | probably_damaging(0.986) | TCGA-AO-A128-01 | Breast | breast invasive carcinoma | Female | <65 | I/II | Chemotherapy | doxorubicin | SD | |
| CTSD | SNV | Missense_Mutation | rs777645484 | c.410N>T | p.Ser137Leu | p.S137L | P07339 | protein_coding | tolerated(0.07) | benign(0.166) | TCGA-AR-A2LK-01 | Breast | breast invasive carcinoma | Female | <65 | III/IV | Hormone Therapy | anastrozole | PD |
| CTSD | deletion | Frame_Shift_Del | novel | c.1115delG | p.Gly372AlafsTer119 | p.G372Afs*119 | P07339 | protein_coding | TCGA-EW-A2FV-01 | Breast | breast invasive carcinoma | Female | <65 | III/IV | Chemotherapy | docetaxel | SD | ||
| CTSD | SNV | Missense_Mutation | c.320N>G | p.Ser107Cys | p.S107C | P07339 | protein_coding | deleterious(0.01) | probably_damaging(1) | TCGA-IR-A3LK-01 | Cervix | cervical & endocervical cancer | Female | >=65 | I/II | Chemotherapy | cisplatin | PD | |
| CTSD | SNV | Missense_Mutation | rs779278368 | c.100C>T | p.Arg34Trp | p.R34W | P07339 | protein_coding | deleterious(0) | probably_damaging(0.989) | TCGA-AA-3864-01 | Colorectum | colon adenocarcinoma | Male | >=65 | I/II | Unknown | Unknown | SD |
| CTSD | SNV | Missense_Mutation | c.91N>C | p.Ser31Pro | p.S31P | P07339 | protein_coding | deleterious(0.01) | benign(0.25) | TCGA-EI-6882-01 | Colorectum | rectum adenocarcinoma | Male | <65 | I/II | Unknown | Unknown | SD | |
| CTSD | SNV | Missense_Mutation | rs200303993 | c.1232N>A | p.Arg411His | p.R411H | P07339 | protein_coding | tolerated(0.06) | benign(0.276) | TCGA-F5-6864-01 | Colorectum | rectum adenocarcinoma | Female | >=65 | III/IV | Chemotherapy | 5-fluorouracil | CR |
| CTSD | insertion | Frame_Shift_Ins | rs752612332 | c.268dupC | p.Gln90ProfsTer50 | p.Q90Pfs*50 | P07339 | protein_coding | TCGA-AA-A022-01 | Colorectum | colon adenocarcinoma | Female | >=65 | I/II | Unknown | Unknown | SD | ||
| CTSD | SNV | Missense_Mutation | novel | c.491N>T | p.Ser164Leu | p.S164L | P07339 | protein_coding | tolerated_low_confidence(0.33) | benign(0) | TCGA-A5-A0G2-01 | Endometrium | uterine corpus endometrioid carcinoma | Female | <65 | III/IV | Unknown | Unknown | SD |
| CTSD | SNV | Missense_Mutation | rs774222715 | c.503N>T | p.Ala168Val | p.A168V | P07339 | protein_coding | tolerated(0.2) | benign(0.062) | TCGA-A5-A0VQ-01 | Endometrium | uterine corpus endometrioid carcinoma | Female | <65 | I/II | Chemotherapy | carboplatin | SD |
| Page: 1 2 3 4 |
Top |
Related drugs of malignant transformation related genes |
| Identification of chemicals and drugs interact with genes involved in malignant transfromation |
| (DGIdb 4.0) |
| Entrez ID | Symbol | Category | Interaction Types | Drug Claim Name | Drug Name | PMIDs |
| 1509 | CTSD | PROTEASE, DRUGGABLE GENOME, ENZYME | STREPTOZOTOCIN | STREPTOZOCIN | 3282952 | |
| 1509 | CTSD | PROTEASE, DRUGGABLE GENOME, ENZYME | inhibitor | 252166874 | ||
| 1509 | CTSD | PROTEASE, DRUGGABLE GENOME, ENZYME | inhibitor | 252166834 | ||
| 1509 | CTSD | PROTEASE, DRUGGABLE GENOME, ENZYME | PMID10498202C1 | |||
| 1509 | CTSD | PROTEASE, DRUGGABLE GENOME, ENZYME | inhibitor | 404859127 | ||
| 1509 | CTSD | PROTEASE, DRUGGABLE GENOME, ENZYME | inhibitor | 178103155 |
| Page: 1 |

Copyright 2023-Present -The University of Texas Health Science Center at Houston |