
|
|||||
|
 | |
| |
| |
| |
| |
| |
|
Gene: CTSC |
Gene summary for CTSC |
| Gene information | Species | Human | Gene symbol | CTSC | Gene ID | 1075 |
| Gene name | cathepsin C | |
| Gene Alias | CPPI | |
| Cytomap | 11q14.2 | |
| Gene Type | protein-coding | GO ID | GO:0001774 | UniProtAcc | P53634 |
Top |
Malignant transformation analysis |
| Identification of the aberrant gene expression in precancerous and cancerous lesions by comparing the gene expression of stem-like cells in diseased tissues with normal stem cells |
| Entrez ID | Symbol | Replicates | Species | Organ | Tissue | Adj P-value | Log2FC | Malignancy |
| 1075 | CTSC | CA_HPV_1 | Human | Cervix | CC | 1.36e-26 | 7.13e-01 | 0.0264 |
| 1075 | CTSC | N_HPV_2 | Human | Cervix | N_HPV | 5.40e-07 | 3.76e-01 | -0.0131 |
| 1075 | CTSC | CCII_1 | Human | Cervix | CC | 2.04e-11 | -5.44e-01 | 0.3249 |
| 1075 | CTSC | Tumor | Human | Cervix | CC | 2.05e-40 | 8.50e-01 | 0.1241 |
| 1075 | CTSC | sample3 | Human | Cervix | CC | 1.21e-35 | 7.05e-01 | 0.1387 |
| 1075 | CTSC | L1 | Human | Cervix | CC | 2.30e-10 | 4.22e-01 | 0.0802 |
| 1075 | CTSC | T3 | Human | Cervix | CC | 2.76e-28 | 7.18e-01 | 0.1389 |
| 1075 | CTSC | HTA11_1938_2000001011 | Human | Colorectum | AD | 1.51e-04 | 4.89e-01 | -0.0811 |
| 1075 | CTSC | HTA11_78_2000001011 | Human | Colorectum | AD | 8.71e-03 | 3.79e-01 | -0.1088 |
| 1075 | CTSC | HTA11_347_2000001011 | Human | Colorectum | AD | 2.30e-10 | 4.51e-01 | -0.1954 |
| 1075 | CTSC | HTA11_83_2000001011 | Human | Colorectum | SER | 3.48e-03 | 4.28e-01 | -0.1526 |
| 1075 | CTSC | HTA11_1391_2000001011 | Human | Colorectum | AD | 3.88e-02 | 3.21e-01 | -0.059 |
| 1075 | CTSC | HTA11_7696_3000711011 | Human | Colorectum | AD | 2.70e-04 | 1.54e-01 | 0.0674 |
| 1075 | CTSC | HTA11_7469_2000001011 | Human | Colorectum | AD | 3.16e-02 | 4.25e-01 | -0.0124 |
| 1075 | CTSC | HTA11_99999970781_79442 | Human | Colorectum | MSS | 2.07e-05 | 3.09e-01 | 0.294 |
| 1075 | CTSC | HTA11_99999965104_69814 | Human | Colorectum | MSS | 1.38e-04 | 3.94e-01 | 0.281 |
| 1075 | CTSC | HTA11_99999971662_82457 | Human | Colorectum | MSS | 6.43e-09 | 4.49e-01 | 0.3859 |
| 1075 | CTSC | A015-C-203 | Human | Colorectum | FAP | 1.82e-03 | -1.57e-01 | -0.1294 |
| 1075 | CTSC | A002-C-114 | Human | Colorectum | FAP | 5.98e-04 | -1.78e-01 | -0.1561 |
| 1075 | CTSC | A018-E-020 | Human | Colorectum | FAP | 2.14e-02 | -1.63e-01 | -0.2034 |
| Page: 1 2 3 4 5 6 7 8 9 |
| Tissue | Expression Dynamics | Abbreviation |
| Cervix | 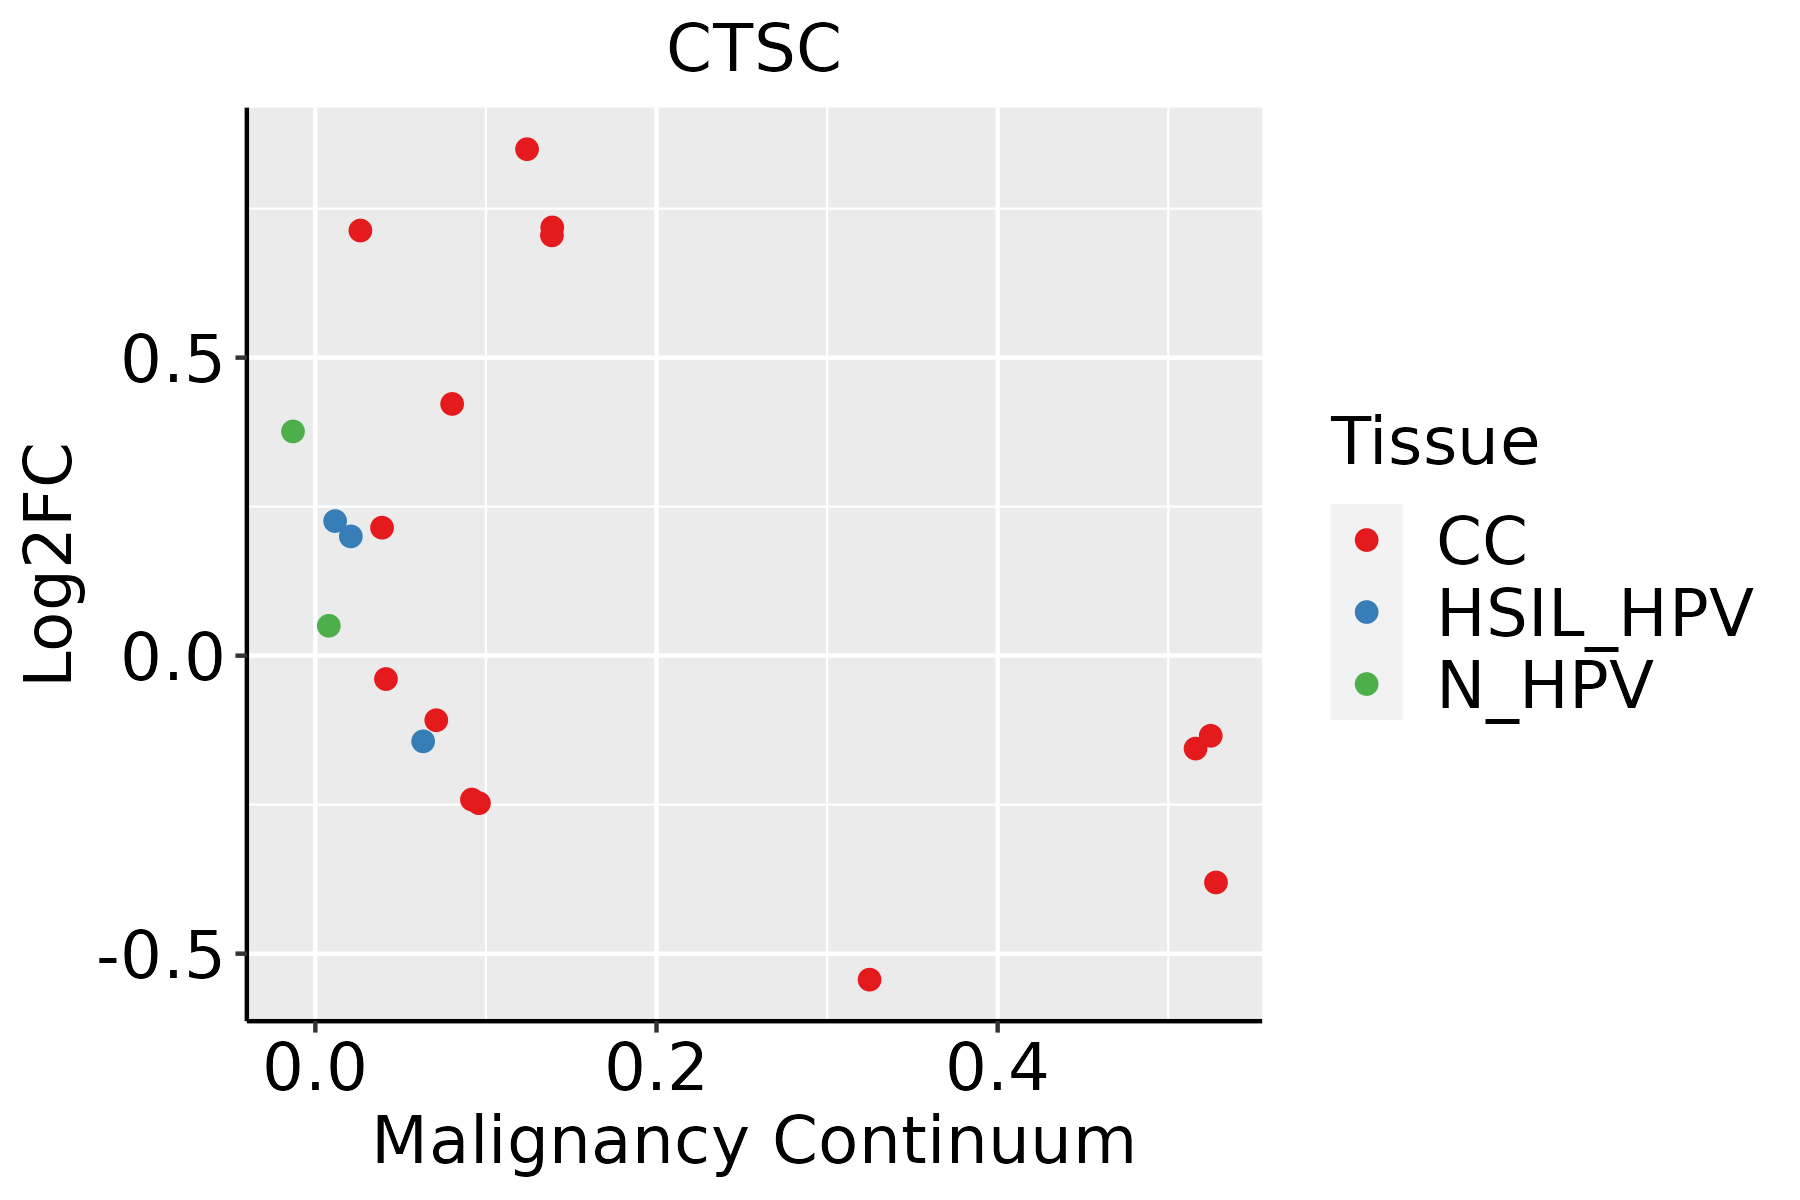 | CC: Cervix cancer |
| HSIL_HPV: HPV-infected high-grade squamous intraepithelial lesions | ||
| N_HPV: HPV-infected normal cervix | ||
| Colorectum (GSE201348) |  | FAP: Familial adenomatous polyposis |
| CRC: Colorectal cancer | ||
| Colorectum (HTA11) |  | AD: Adenomas |
| SER: Sessile serrated lesions | ||
| MSI-H: Microsatellite-high colorectal cancer | ||
| MSS: Microsatellite stable colorectal cancer | ||
| Endometrium | 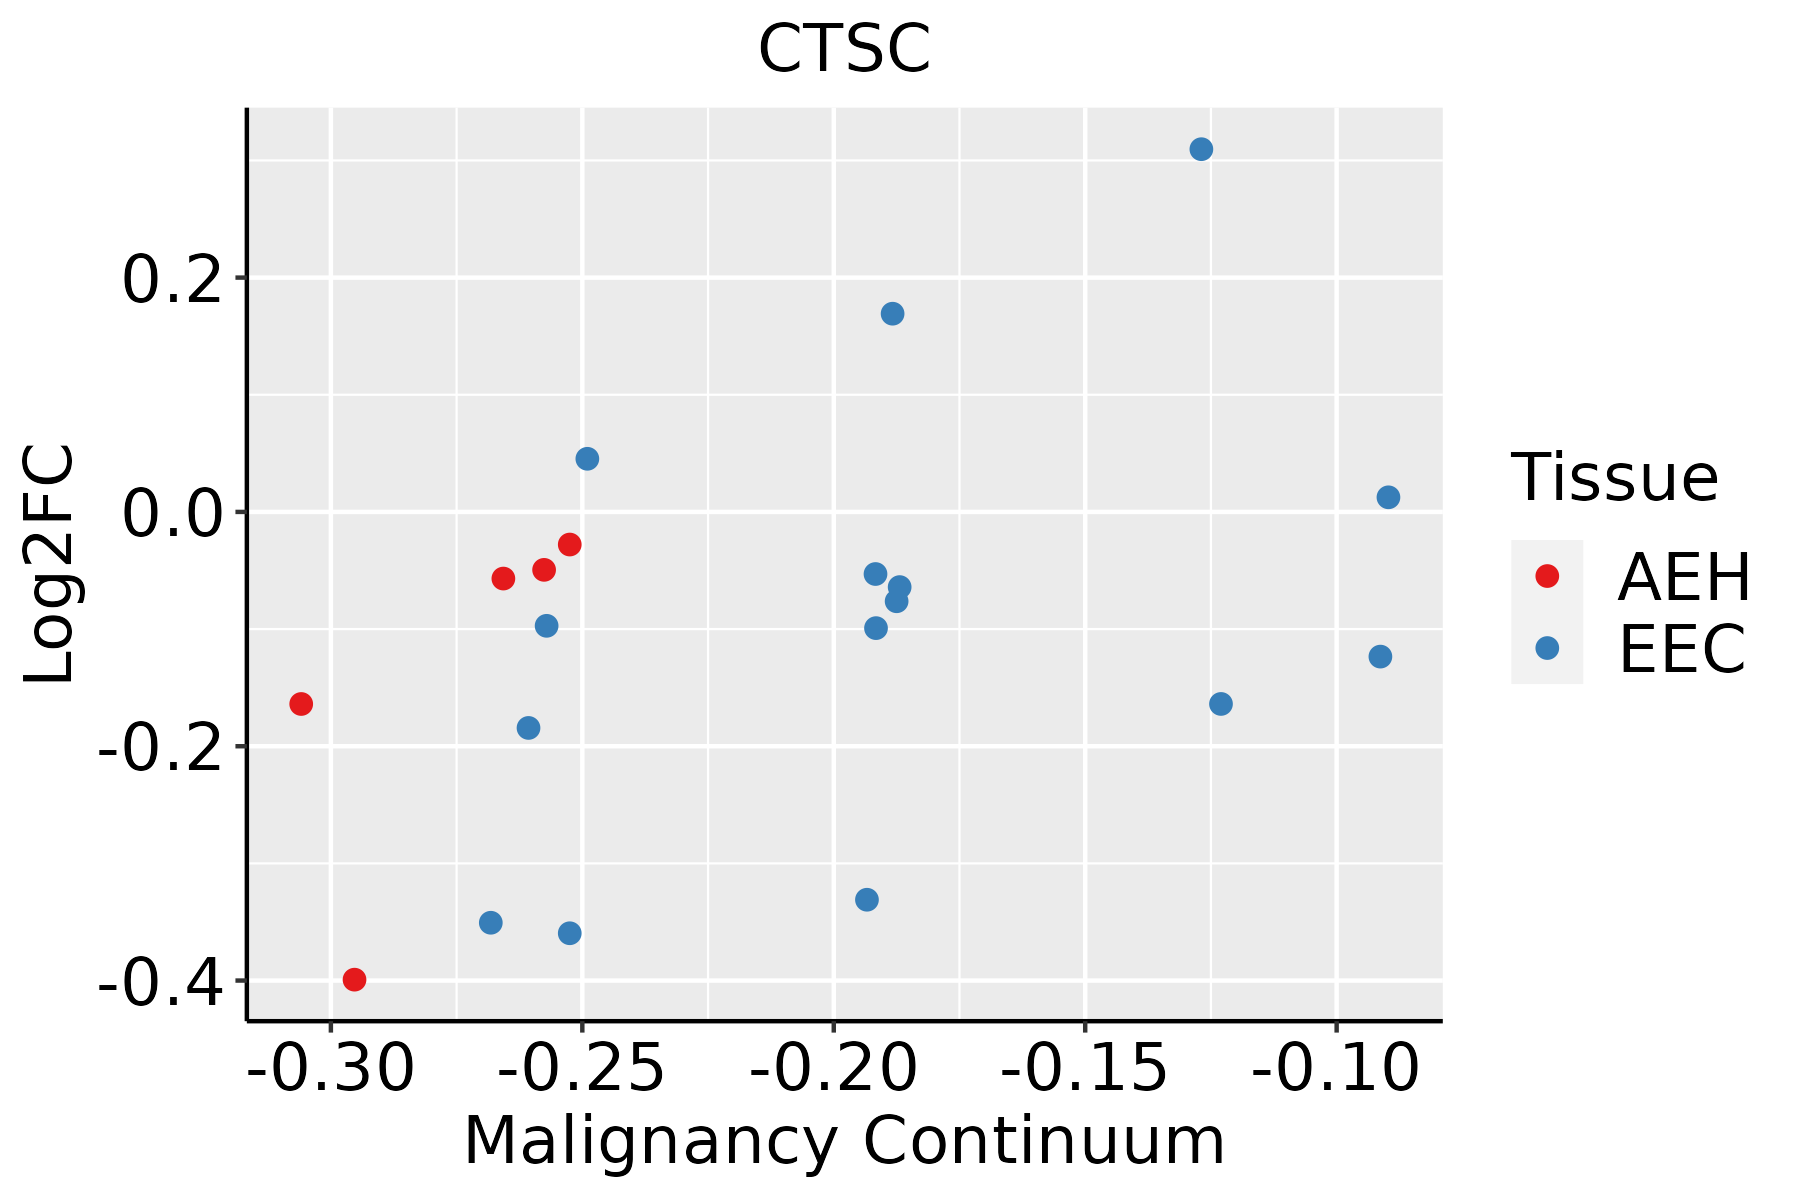 | AEH: Atypical endometrial hyperplasia |
| EEC: Endometrioid Cancer | ||
| Esophagus |  | ESCC: Esophageal squamous cell carcinoma |
| HGIN: High-grade intraepithelial neoplasias | ||
| LGIN: Low-grade intraepithelial neoplasias | ||
| Liver | 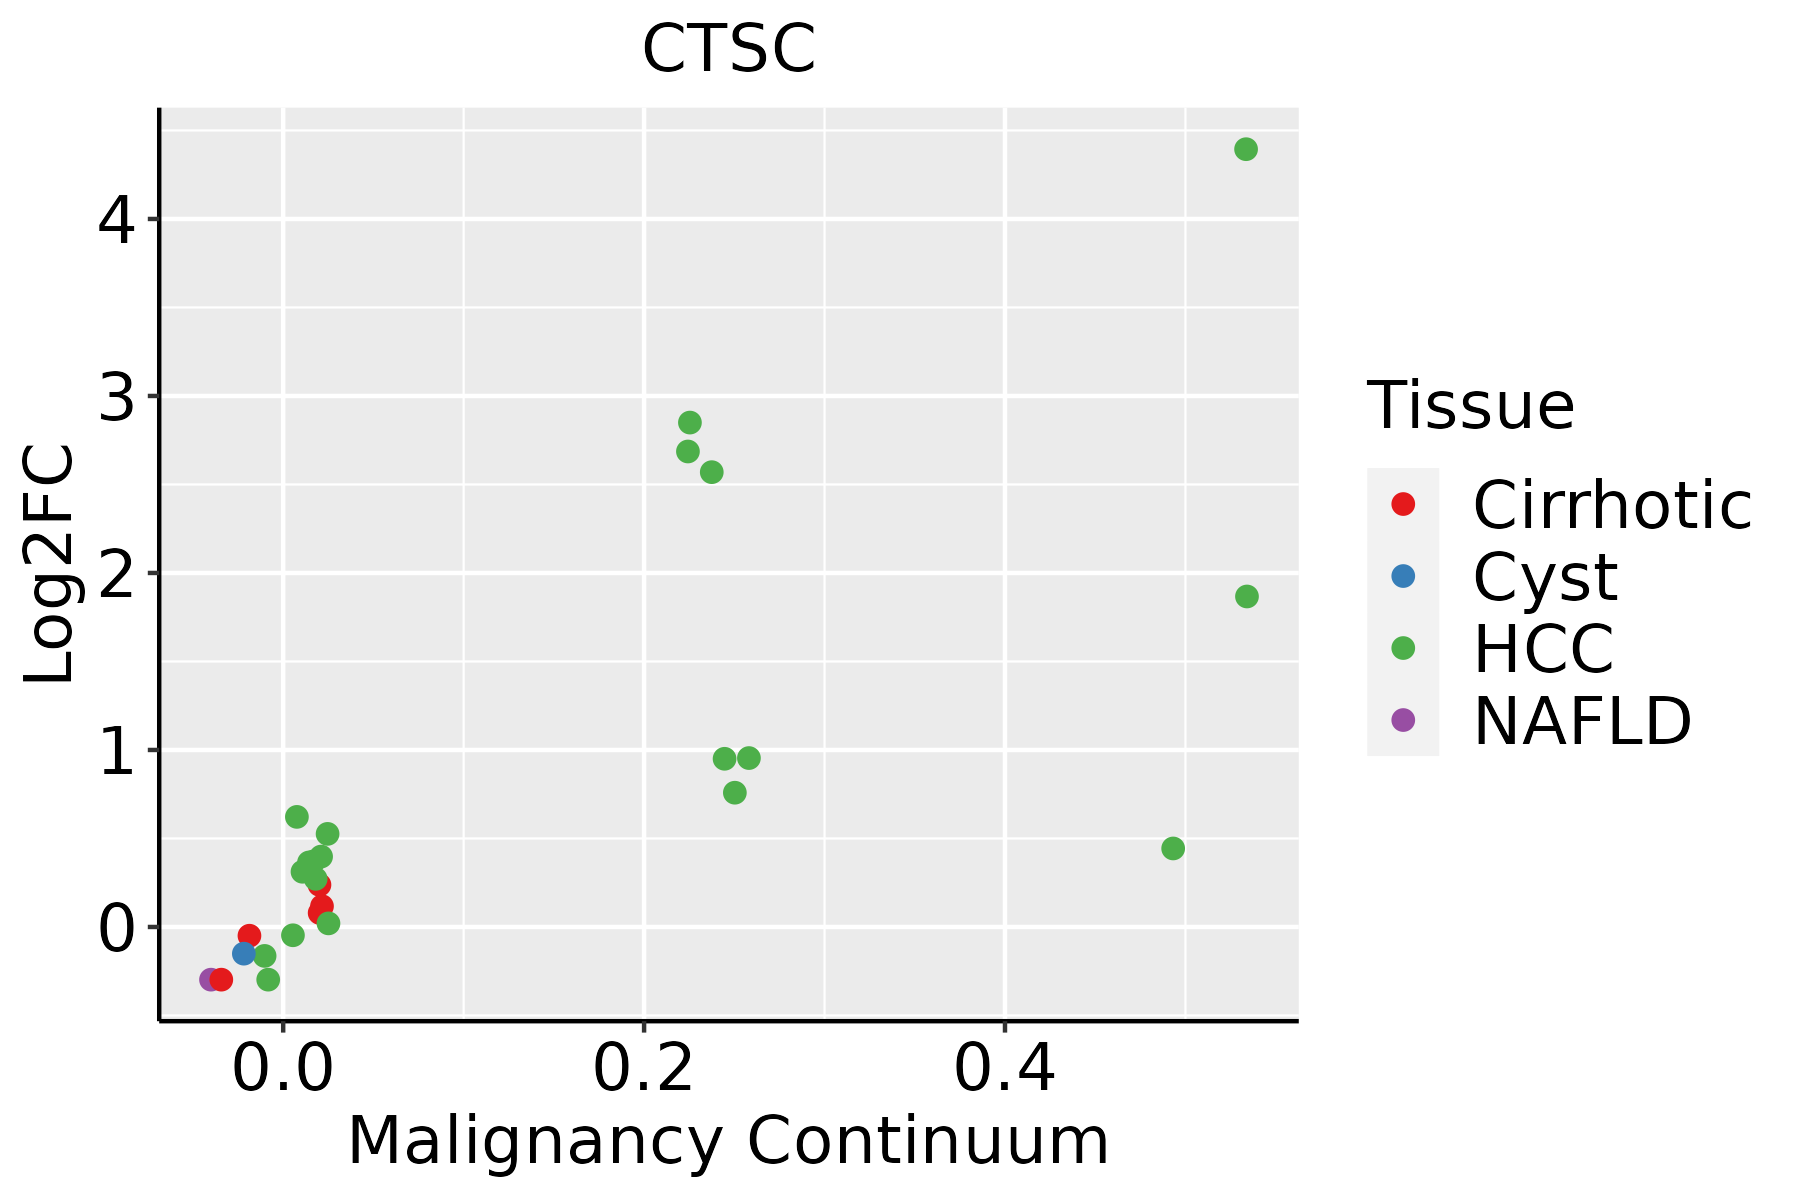 | HCC: Hepatocellular carcinoma |
| NAFLD: Non-alcoholic fatty liver disease | ||
| Oral Cavity |  | EOLP: Erosive Oral lichen planus |
| LP: leukoplakia | ||
| NEOLP: Non-erosive oral lichen planus | ||
| OSCC: Oral squamous cell carcinoma | ||
| Skin | 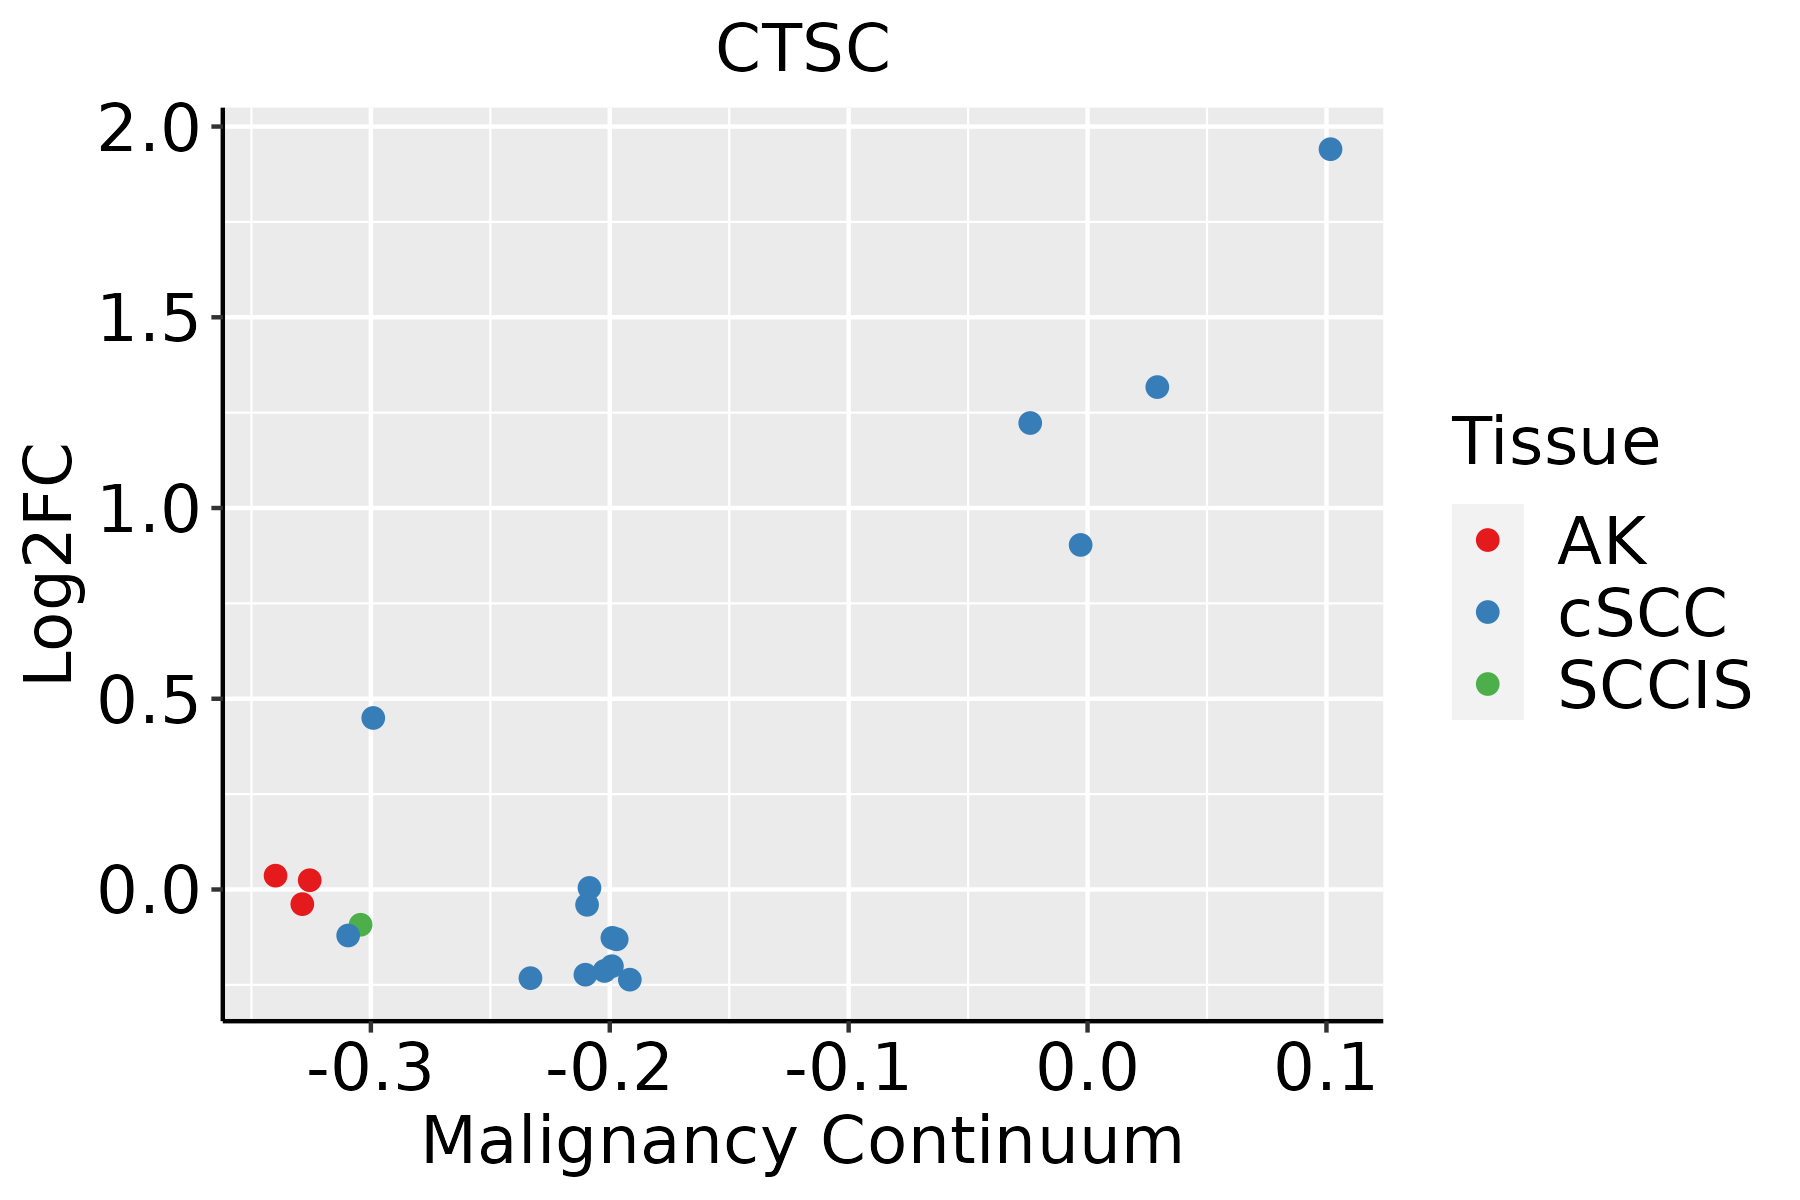 | AK: Actinic keratosis |
| cSCC: Cutaneous squamous cell carcinoma | ||
| SCCIS:squamous cell carcinoma in situ | ||
| Thyroid |  | ATC: Anaplastic thyroid cancer |
| HT: Hashimoto's thyroiditis | ||
| PTC: Papillary thyroid cancer |
| ∗log2FC in expression of this searched gene in stem-like cells from each diseased tissue sample relative to stem-like cells in normal samples in each tissue plotted against the malignancy continuum. Samples are colored based on if they are from different disease stage. |
Top |
Malignant transformation related pathway analysis |
| Find out the enriched GO biological processes and KEGG pathways involved in transition from healthy to precancer to cancer |
| Tissue | Disease Stage | Enriched GO biological Processes |
| Colorectum | AD |  |
| Colorectum | SER |  |
| Colorectum | MSS |  |
| Colorectum | MSI-H |  |
| Colorectum | FAP |  |
| ∗Top 15 enriched GO BP terms are showed in the bar plot of each disease state in each tissue. Each row represents a significant GO biological process which is colored according to the -log10(p.adjust). |
| Page: 1 2 3 4 5 6 7 8 9 |
| GO ID | Tissue | Disease Stage | Description | Gene Ratio | Bg Ratio | pvalue | p.adjust | Count |
| GO:004217610 | Cervix | CC | regulation of protein catabolic process | 104/2311 | 391/18723 | 9.39e-15 | 9.36e-12 | 104 |
| GO:200123310 | Cervix | CC | regulation of apoptotic signaling pathway | 96/2311 | 356/18723 | 4.08e-14 | 3.05e-11 | 96 |
| GO:004586210 | Cervix | CC | positive regulation of proteolysis | 95/2311 | 372/18723 | 1.84e-12 | 6.86e-10 | 95 |
| GO:190336210 | Cervix | CC | regulation of cellular protein catabolic process | 72/2311 | 255/18723 | 5.98e-12 | 2.10e-09 | 72 |
| GO:004573210 | Cervix | CC | positive regulation of protein catabolic process | 65/2311 | 231/18723 | 7.44e-11 | 1.39e-08 | 65 |
| GO:000989610 | Cervix | CC | positive regulation of catabolic process | 109/2311 | 492/18723 | 5.26e-10 | 6.99e-08 | 109 |
| GO:190305010 | Cervix | CC | regulation of proteolysis involved in cellular protein catabolic process | 60/2311 | 221/18723 | 1.82e-09 | 1.98e-07 | 60 |
| GO:00321035 | Cervix | CC | positive regulation of response to external stimulus | 95/2311 | 427/18723 | 5.44e-09 | 5.03e-07 | 95 |
| GO:003133110 | Cervix | CC | positive regulation of cellular catabolic process | 91/2311 | 427/18723 | 9.64e-08 | 5.25e-06 | 91 |
| GO:190336410 | Cervix | CC | positive regulation of cellular protein catabolic process | 43/2311 | 155/18723 | 1.80e-07 | 8.28e-06 | 43 |
| GO:20012357 | Cervix | CC | positive regulation of apoptotic signaling pathway | 37/2311 | 126/18723 | 2.70e-07 | 1.12e-05 | 37 |
| GO:00075689 | Cervix | CC | aging | 75/2311 | 339/18723 | 2.75e-07 | 1.13e-05 | 75 |
| GO:00313494 | Cervix | CC | positive regulation of defense response | 60/2311 | 278/18723 | 9.38e-06 | 2.11e-04 | 60 |
| GO:19030528 | Cervix | CC | positive regulation of proteolysis involved in cellular protein catabolic process | 34/2311 | 133/18723 | 2.28e-05 | 4.01e-04 | 34 |
| GO:00507273 | Cervix | CC | regulation of inflammatory response | 75/2311 | 386/18723 | 3.95e-05 | 6.18e-04 | 75 |
| GO:00507294 | Cervix | CC | positive regulation of inflammatory response | 34/2311 | 142/18723 | 9.51e-05 | 1.25e-03 | 34 |
| GO:00019135 | Cervix | CC | T cell mediated cytotoxicity | 15/2311 | 49/18723 | 5.81e-04 | 5.52e-03 | 15 |
| GO:00024564 | Cervix | CC | T cell mediated immunity | 26/2311 | 109/18723 | 6.39e-04 | 5.97e-03 | 26 |
| GO:00519603 | Cervix | CC | regulation of nervous system development | 77/2311 | 443/18723 | 1.13e-03 | 9.30e-03 | 77 |
| GO:00026967 | Cervix | CC | positive regulation of leukocyte activation | 72/2311 | 409/18723 | 1.13e-03 | 9.31e-03 | 72 |
| Page: 1 2 3 4 5 6 7 8 9 10 11 12 13 14 15 16 |
| Pathway ID | Tissue | Disease Stage | Description | Gene Ratio | Bg Ratio | pvalue | p.adjust | qvalue | Count |
| hsa042109 | Cervix | CC | Apoptosis | 36/1267 | 136/8465 | 3.21e-04 | 1.68e-03 | 9.91e-04 | 36 |
| hsa0421014 | Cervix | CC | Apoptosis | 36/1267 | 136/8465 | 3.21e-04 | 1.68e-03 | 9.91e-04 | 36 |
| hsa0421042 | Cervix | N_HPV | Apoptosis | 14/349 | 136/8465 | 1.40e-03 | 9.06e-03 | 7.08e-03 | 14 |
| hsa0421052 | Cervix | N_HPV | Apoptosis | 14/349 | 136/8465 | 1.40e-03 | 9.06e-03 | 7.08e-03 | 14 |
| hsa04142 | Colorectum | SER | Lysosome | 38/1580 | 132/8465 | 2.87e-03 | 2.03e-02 | 1.47e-02 | 38 |
| hsa041421 | Colorectum | SER | Lysosome | 38/1580 | 132/8465 | 2.87e-03 | 2.03e-02 | 1.47e-02 | 38 |
| hsa04210 | Colorectum | MSS | Apoptosis | 44/1875 | 136/8465 | 3.66e-03 | 1.66e-02 | 1.01e-02 | 44 |
| hsa042101 | Colorectum | MSS | Apoptosis | 44/1875 | 136/8465 | 3.66e-03 | 1.66e-02 | 1.01e-02 | 44 |
| hsa0421010 | Endometrium | AEH | Apoptosis | 30/1197 | 136/8465 | 7.72e-03 | 4.05e-02 | 2.96e-02 | 30 |
| hsa0421015 | Endometrium | AEH | Apoptosis | 30/1197 | 136/8465 | 7.72e-03 | 4.05e-02 | 2.96e-02 | 30 |
| hsa0421024 | Endometrium | EEC | Apoptosis | 31/1237 | 136/8465 | 6.72e-03 | 3.25e-02 | 2.42e-02 | 31 |
| hsa0421034 | Endometrium | EEC | Apoptosis | 31/1237 | 136/8465 | 6.72e-03 | 3.25e-02 | 2.42e-02 | 31 |
| hsa0421020 | Esophagus | HGIN | Apoptosis | 36/1383 | 136/8465 | 1.67e-03 | 1.52e-02 | 1.20e-02 | 36 |
| hsa041426 | Esophagus | HGIN | Lysosome | 33/1383 | 132/8465 | 6.65e-03 | 4.37e-02 | 3.47e-02 | 33 |
| hsa04210110 | Esophagus | HGIN | Apoptosis | 36/1383 | 136/8465 | 1.67e-03 | 1.52e-02 | 1.20e-02 | 36 |
| hsa0414213 | Esophagus | HGIN | Lysosome | 33/1383 | 132/8465 | 6.65e-03 | 4.37e-02 | 3.47e-02 | 33 |
| hsa0414222 | Esophagus | ESCC | Lysosome | 102/4205 | 132/8465 | 5.11e-11 | 7.13e-10 | 3.65e-10 | 102 |
| hsa0421027 | Esophagus | ESCC | Apoptosis | 102/4205 | 136/8465 | 1.05e-09 | 1.21e-08 | 6.21e-09 | 102 |
| hsa0414232 | Esophagus | ESCC | Lysosome | 102/4205 | 132/8465 | 5.11e-11 | 7.13e-10 | 3.65e-10 | 102 |
| hsa0421037 | Esophagus | ESCC | Apoptosis | 102/4205 | 136/8465 | 1.05e-09 | 1.21e-08 | 6.21e-09 | 102 |
| Page: 1 2 |
Top |
Cell-cell communication analysis |
| Identification of potential cell-cell interactions between two cell types and their ligand-receptor pairs for different disease states |
| Ligand | Receptor | LRpair | Pathway | Tissue | Disease Stage |
| Page: 1 |
Top |
Single-cell gene regulatory network inference analysis |
| Find out the significant the regulons (TFs) and the target genes of each regulon across cell types for different disease states |
| TF | Cell Type | Tissue | Disease Stage | Target Gene | RSS | Regulon Activity |
| ∗The dot plots of a searched regulon are shown for all cell subpopulations in each disease state of each tissue based on the regulon specific score inferred using pySCENIC and by calculating the average expression. |
| Page: 1 |
Top |
Somatic mutation of malignant transformation related genes |
| Annotation of somatic variants for genes involved in malignant transformation |
| Hugo Symbol | Variant Class | Variant Classification | dbSNP RS | HGVSc | HGVSp | HGVSp Short | SWISSPROT | BIOTYPE | SIFT | PolyPhen | Tumor Sample Barcode | Tissue | Histology | Sex | Age | Stage | Therapy Types | Drugs | Outcome |
| CTSC | SNV | Missense_Mutation | novel | c.656N>T | p.Pro219Leu | p.P219L | P53634 | protein_coding | deleterious(0.03) | possibly_damaging(0.477) | TCGA-EW-A2FR-01 | Breast | breast invasive carcinoma | Female | <65 | III/IV | Chemotherapy | epirubicin | SD |
| CTSC | SNV | Missense_Mutation | c.1106C>A | p.Pro369His | p.P369H | P53634 | protein_coding | deleterious(0) | probably_damaging(1) | TCGA-A6-2686-01 | Colorectum | colon adenocarcinoma | Female | >=65 | I/II | Unknown | Unknown | SD | |
| CTSC | SNV | Missense_Mutation | c.959N>A | p.Ala320Asp | p.A320D | P53634 | protein_coding | tolerated(0.72) | benign(0.001) | TCGA-A6-6653-01 | Colorectum | colon adenocarcinoma | Male | >=65 | I/II | Unknown | Unknown | SD | |
| CTSC | SNV | Missense_Mutation | c.680N>C | p.Lys227Thr | p.K227T | P53634 | protein_coding | tolerated(0.44) | benign(0.117) | TCGA-AA-3663-01 | Colorectum | colon adenocarcinoma | Male | <65 | I/II | Unknown | Unknown | SD | |
| CTSC | SNV | Missense_Mutation | rs370851747 | c.731N>G | p.Asn244Ser | p.N244S | P53634 | protein_coding | tolerated(0.09) | benign(0.237) | TCGA-AY-4071-01 | Colorectum | colon adenocarcinoma | Female | <65 | I/II | Unknown | Unknown | SD |
| CTSC | SNV | Missense_Mutation | novel | c.611N>A | p.Arg204Lys | p.R204K | P53634 | protein_coding | tolerated(0.08) | benign(0.018) | TCGA-CA-6717-01 | Colorectum | colon adenocarcinoma | Male | <65 | I/II | Chemotherapy | oxaliplatin | CR |
| CTSC | SNV | Missense_Mutation | rs754353507 | c.1318N>T | p.Arg440Trp | p.R440W | P53634 | protein_coding | deleterious(0.05) | possibly_damaging(0.736) | TCGA-G4-6588-01 | Colorectum | colon adenocarcinoma | Female | <65 | I/II | Unknown | Unknown | SD |
| CTSC | SNV | Missense_Mutation | c.551N>T | p.Ser184Phe | p.S184F | P53634 | protein_coding | deleterious(0.01) | possibly_damaging(0.903) | TCGA-G4-6625-01 | Colorectum | colon adenocarcinoma | Female | >=65 | I/II | Unknown | Unknown | PD | |
| CTSC | SNV | Missense_Mutation | c.460N>A | p.Ala154Thr | p.A154T | P53634 | protein_coding | tolerated(0.64) | benign(0.001) | TCGA-AG-A002-01 | Colorectum | rectum adenocarcinoma | Male | <65 | I/II | Unknown | Unknown | SD | |
| CTSC | insertion | Frame_Shift_Ins | novel | c.1280dupA | p.Asn427LysfsTer9 | p.N427Kfs*9 | P53634 | protein_coding | TCGA-AA-3947-01 | Colorectum | colon adenocarcinoma | Female | <65 | I/II | Unknown | Unknown | SD |
| Page: 1 2 3 4 5 6 |
Top |
Related drugs of malignant transformation related genes |
| Identification of chemicals and drugs interact with genes involved in malignant transfromation |
| (DGIdb 4.0) |
| Entrez ID | Symbol | Category | Interaction Types | Drug Claim Name | Drug Name | PMIDs |
| 1075 | CTSC | ENZYME, DRUGGABLE GENOME, PROTEASE | inhibitor | 252166823 | ||
| 1075 | CTSC | ENZYME, DRUGGABLE GENOME, PROTEASE | PROGESTERONE | PROGESTERONE | 17916955 | |
| 1075 | CTSC | ENZYME, DRUGGABLE GENOME, PROTEASE | PENTOSAN POLYSULFATE | 17826736 | ||
| 1075 | CTSC | ENZYME, DRUGGABLE GENOME, PROTEASE | GSK2793660 | |||
| 1075 | CTSC | ENZYME, DRUGGABLE GENOME, PROTEASE | CALCIUM GLUCONATE | 18822840 | ||
| 1075 | CTSC | ENZYME, DRUGGABLE GENOME, PROTEASE | inhibitor | 328083514 |
| Page: 1 |

Copyright 2023-Present -The University of Texas Health Science Center at Houston |