
|
|||||
|
 | |
| |
| |
| |
| |
| |
|
Gene: CTSB |
Gene summary for CTSB |
| Gene information | Species | Human | Gene symbol | CTSB | Gene ID | 1508 |
| Gene name | cathepsin B | |
| Gene Alias | APPS | |
| Cytomap | 8p23.1 | |
| Gene Type | protein-coding | GO ID | GO:0000003 | UniProtAcc | Q5HYG5 |
Top |
Malignant transformation analysis |
| Identification of the aberrant gene expression in precancerous and cancerous lesions by comparing the gene expression of stem-like cells in diseased tissues with normal stem cells |
| Entrez ID | Symbol | Replicates | Species | Organ | Tissue | Adj P-value | Log2FC | Malignancy |
| 1508 | CTSB | GSM4909281 | Human | Breast | IDC | 9.90e-29 | 6.27e-01 | 0.21 |
| 1508 | CTSB | GSM4909282 | Human | Breast | IDC | 6.44e-05 | 2.62e-01 | -0.0288 |
| 1508 | CTSB | GSM4909285 | Human | Breast | IDC | 5.41e-04 | -2.48e-01 | 0.21 |
| 1508 | CTSB | GSM4909286 | Human | Breast | IDC | 4.61e-06 | -3.12e-01 | 0.1081 |
| 1508 | CTSB | GSM4909290 | Human | Breast | IDC | 2.10e-05 | -3.66e-01 | 0.2096 |
| 1508 | CTSB | GSM4909293 | Human | Breast | IDC | 2.75e-05 | -3.35e-01 | 0.1581 |
| 1508 | CTSB | GSM4909294 | Human | Breast | IDC | 1.21e-19 | -4.58e-01 | 0.2022 |
| 1508 | CTSB | GSM4909296 | Human | Breast | IDC | 7.71e-10 | -2.81e-01 | 0.1524 |
| 1508 | CTSB | GSM4909297 | Human | Breast | IDC | 1.18e-16 | -2.20e-01 | 0.1517 |
| 1508 | CTSB | GSM4909311 | Human | Breast | IDC | 1.04e-28 | -4.02e-01 | 0.1534 |
| 1508 | CTSB | GSM4909312 | Human | Breast | IDC | 3.79e-19 | -4.16e-01 | 0.1552 |
| 1508 | CTSB | GSM4909313 | Human | Breast | IDC | 2.32e-02 | -1.00e-02 | 0.0391 |
| 1508 | CTSB | GSM4909315 | Human | Breast | IDC | 1.21e-11 | -4.28e-01 | 0.21 |
| 1508 | CTSB | GSM4909316 | Human | Breast | IDC | 2.16e-05 | -4.79e-01 | 0.21 |
| 1508 | CTSB | GSM4909319 | Human | Breast | IDC | 3.86e-39 | -3.91e-01 | 0.1563 |
| 1508 | CTSB | GSM4909320 | Human | Breast | IDC | 8.22e-07 | -4.41e-01 | 0.1575 |
| 1508 | CTSB | GSM4909321 | Human | Breast | IDC | 4.26e-16 | -2.13e-01 | 0.1559 |
| 1508 | CTSB | brca2 | Human | Breast | Precancer | 7.29e-22 | 5.06e-01 | -0.024 |
| 1508 | CTSB | M2 | Human | Breast | IDC | 1.14e-03 | -2.64e-01 | 0.21 |
| 1508 | CTSB | NCCBC11 | Human | Breast | DCIS | 2.16e-05 | 8.68e-02 | 0.1232 |
| Page: 1 2 3 4 5 6 7 8 9 10 11 12 13 14 15 |
| Tissue | Expression Dynamics | Abbreviation |
| Breast | 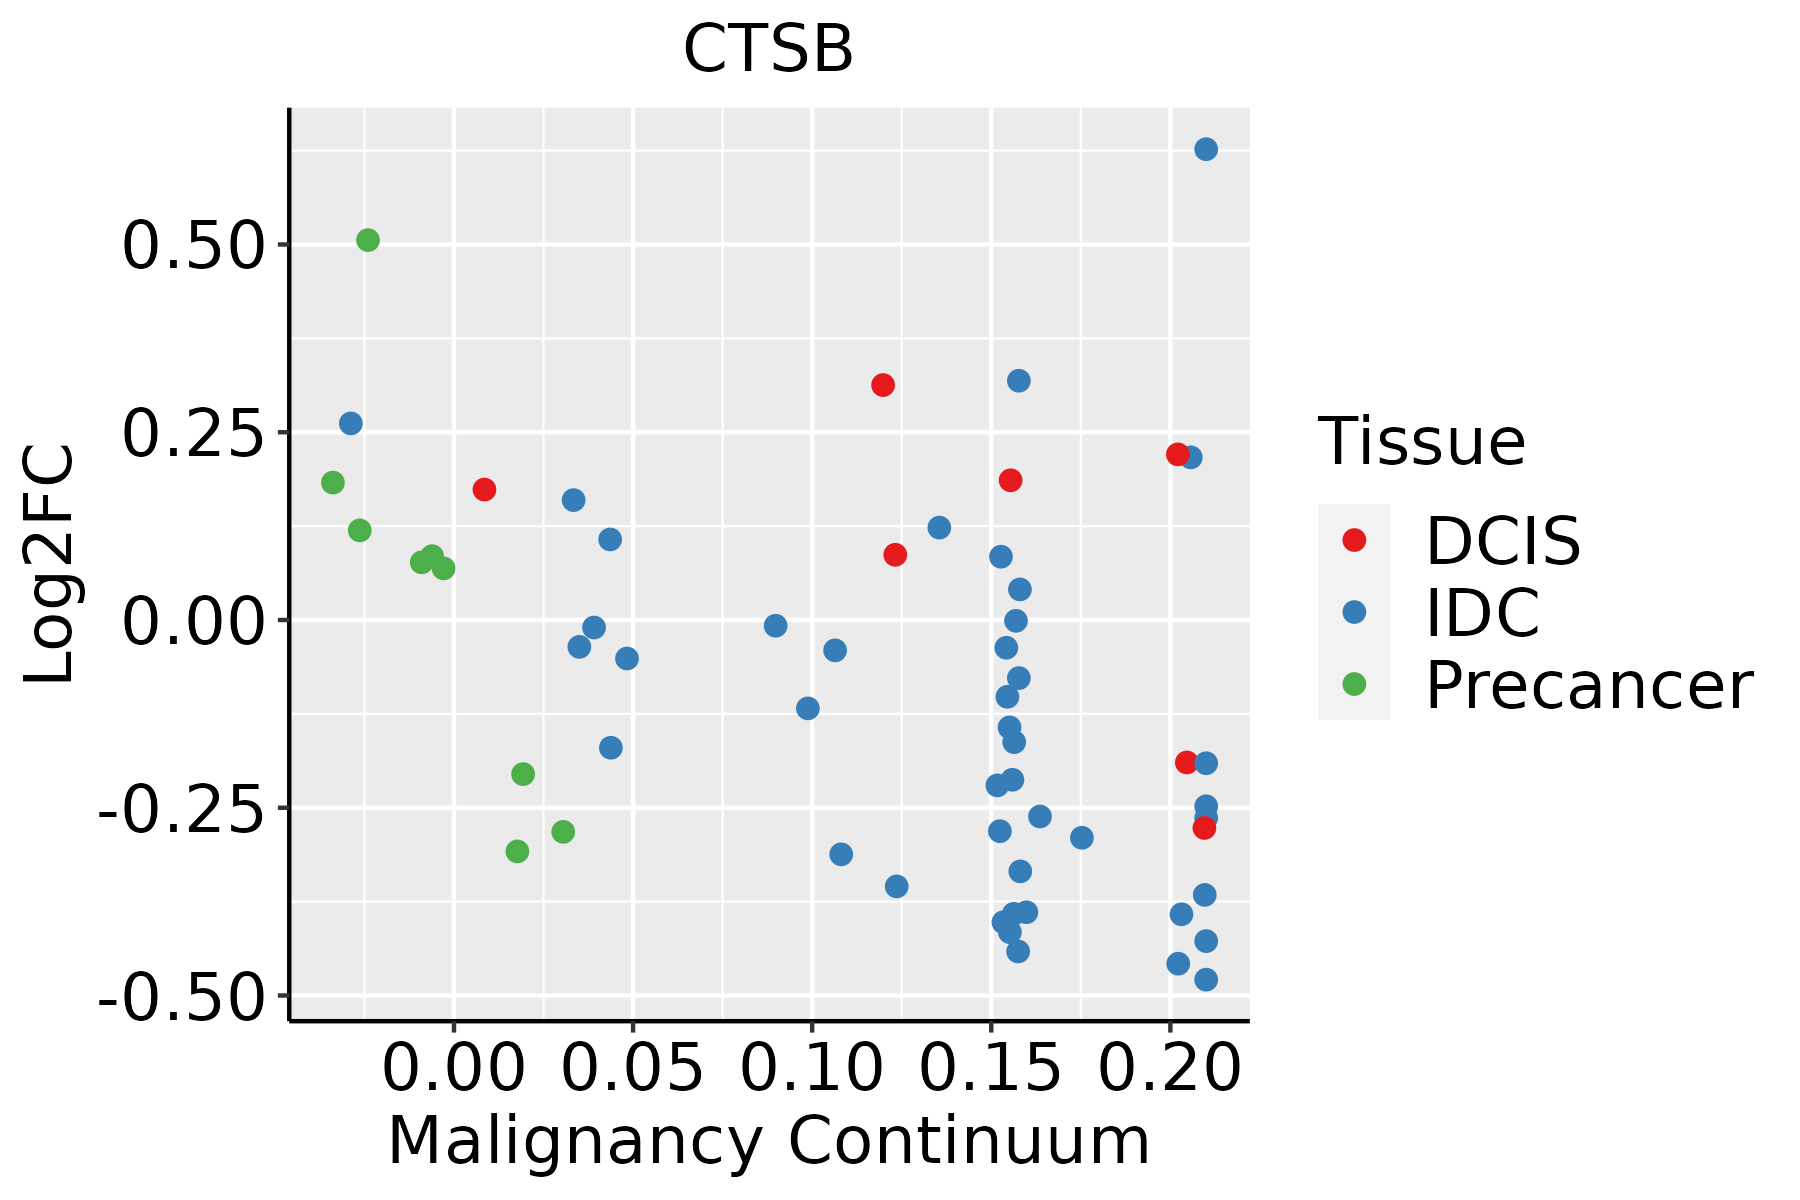 | IDC: Invasive ductal carcinoma |
| DCIS: Ductal carcinoma in situ | ||
| Precancer(BRCA1-mut): Precancerous lesion from BRCA1 mutation carriers | ||
| Cervix | 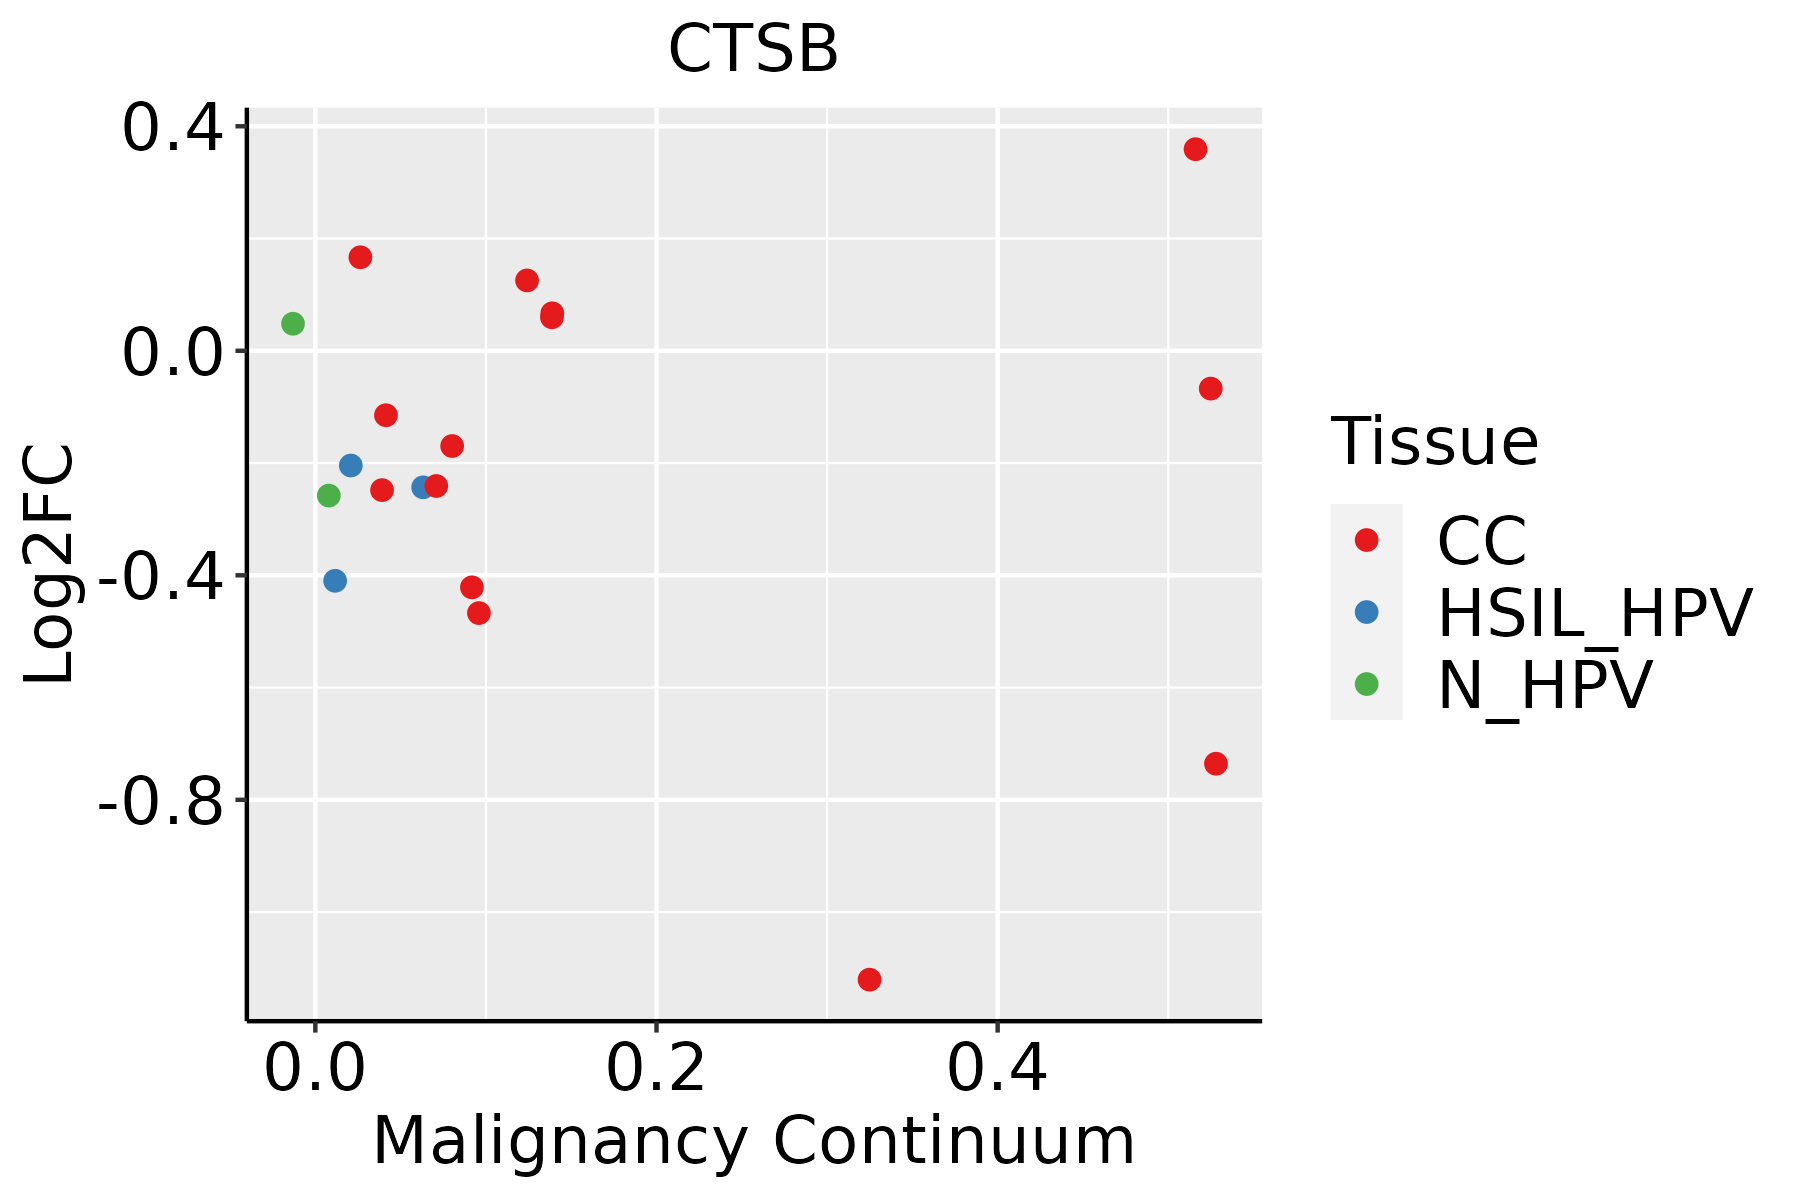 | CC: Cervix cancer |
| HSIL_HPV: HPV-infected high-grade squamous intraepithelial lesions | ||
| N_HPV: HPV-infected normal cervix | ||
| Colorectum (GSE201348) |  | FAP: Familial adenomatous polyposis |
| CRC: Colorectal cancer | ||
| Colorectum (HTA11) |  | AD: Adenomas |
| SER: Sessile serrated lesions | ||
| MSI-H: Microsatellite-high colorectal cancer | ||
| MSS: Microsatellite stable colorectal cancer | ||
| Endometrium | 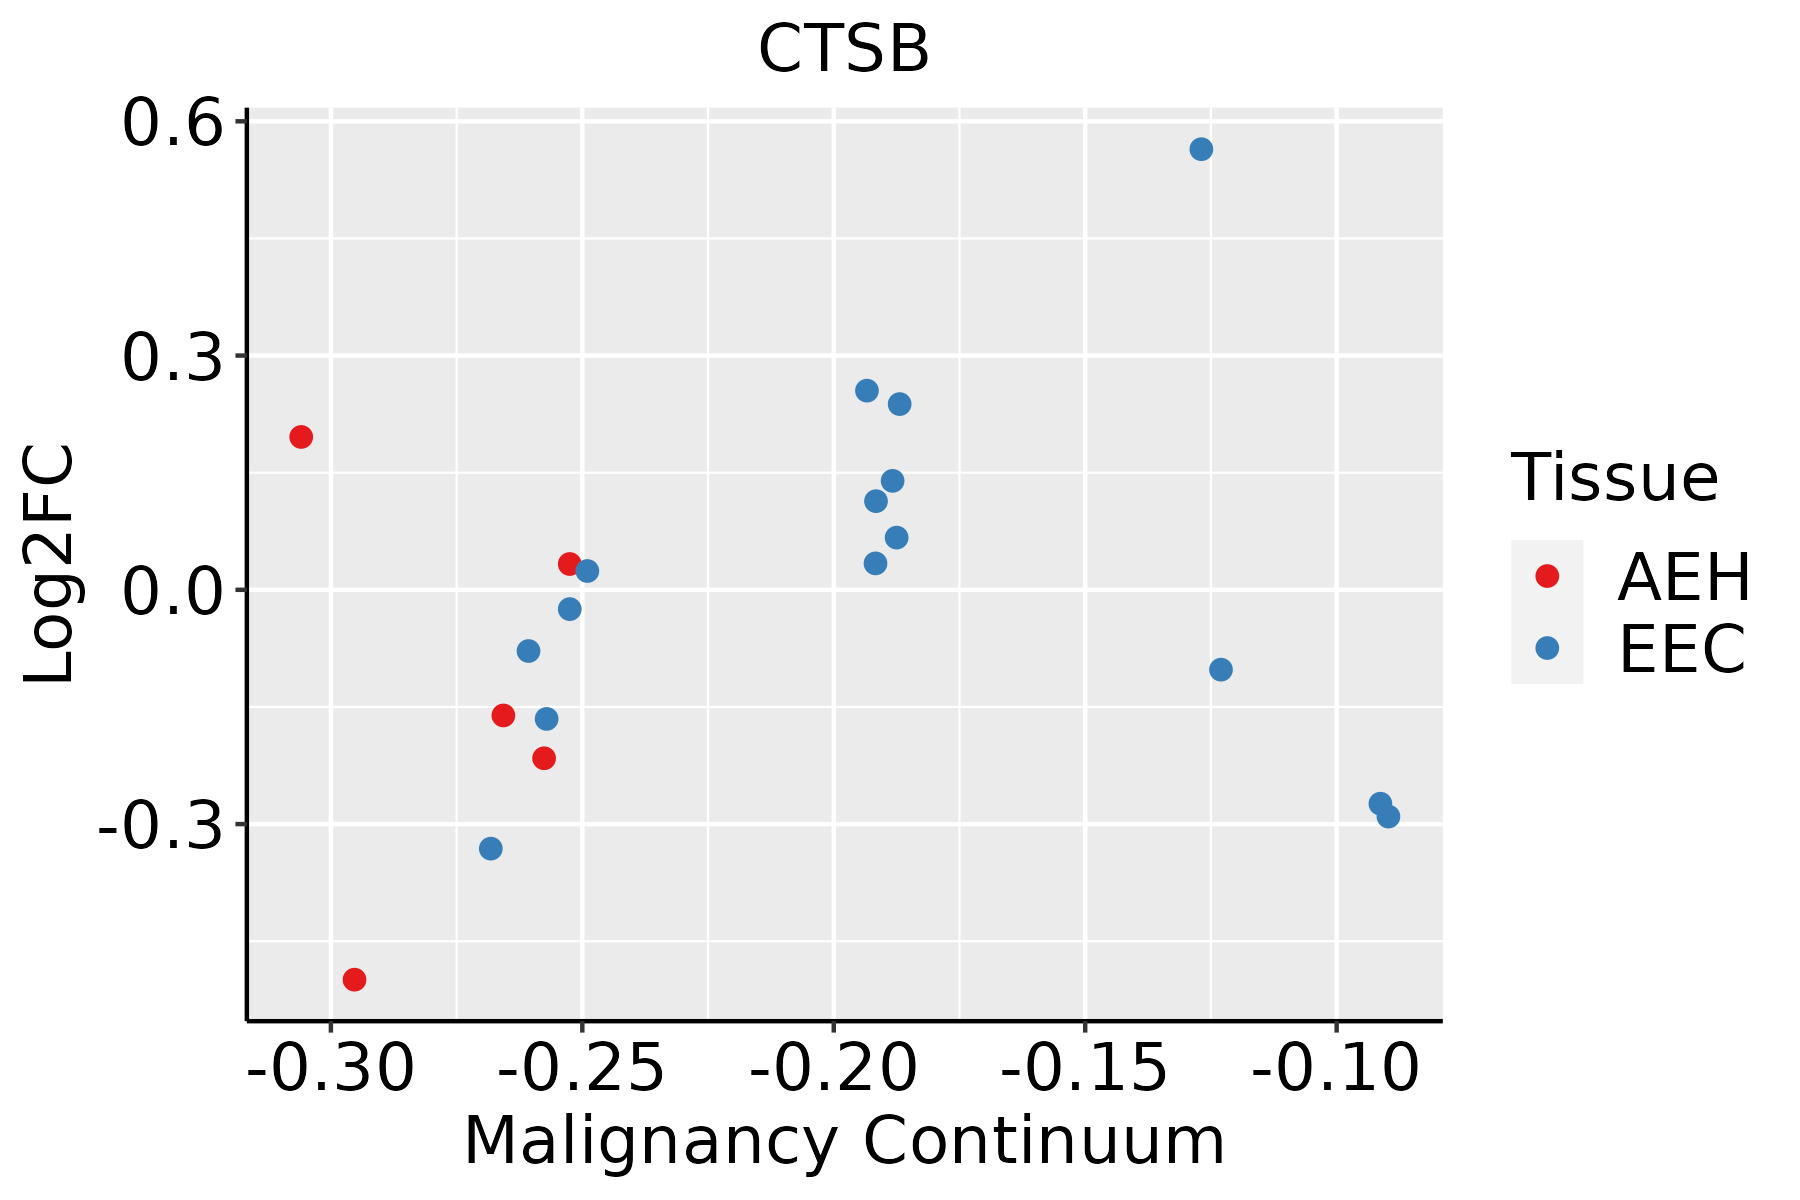 | AEH: Atypical endometrial hyperplasia |
| EEC: Endometrioid Cancer | ||
| Esophagus | 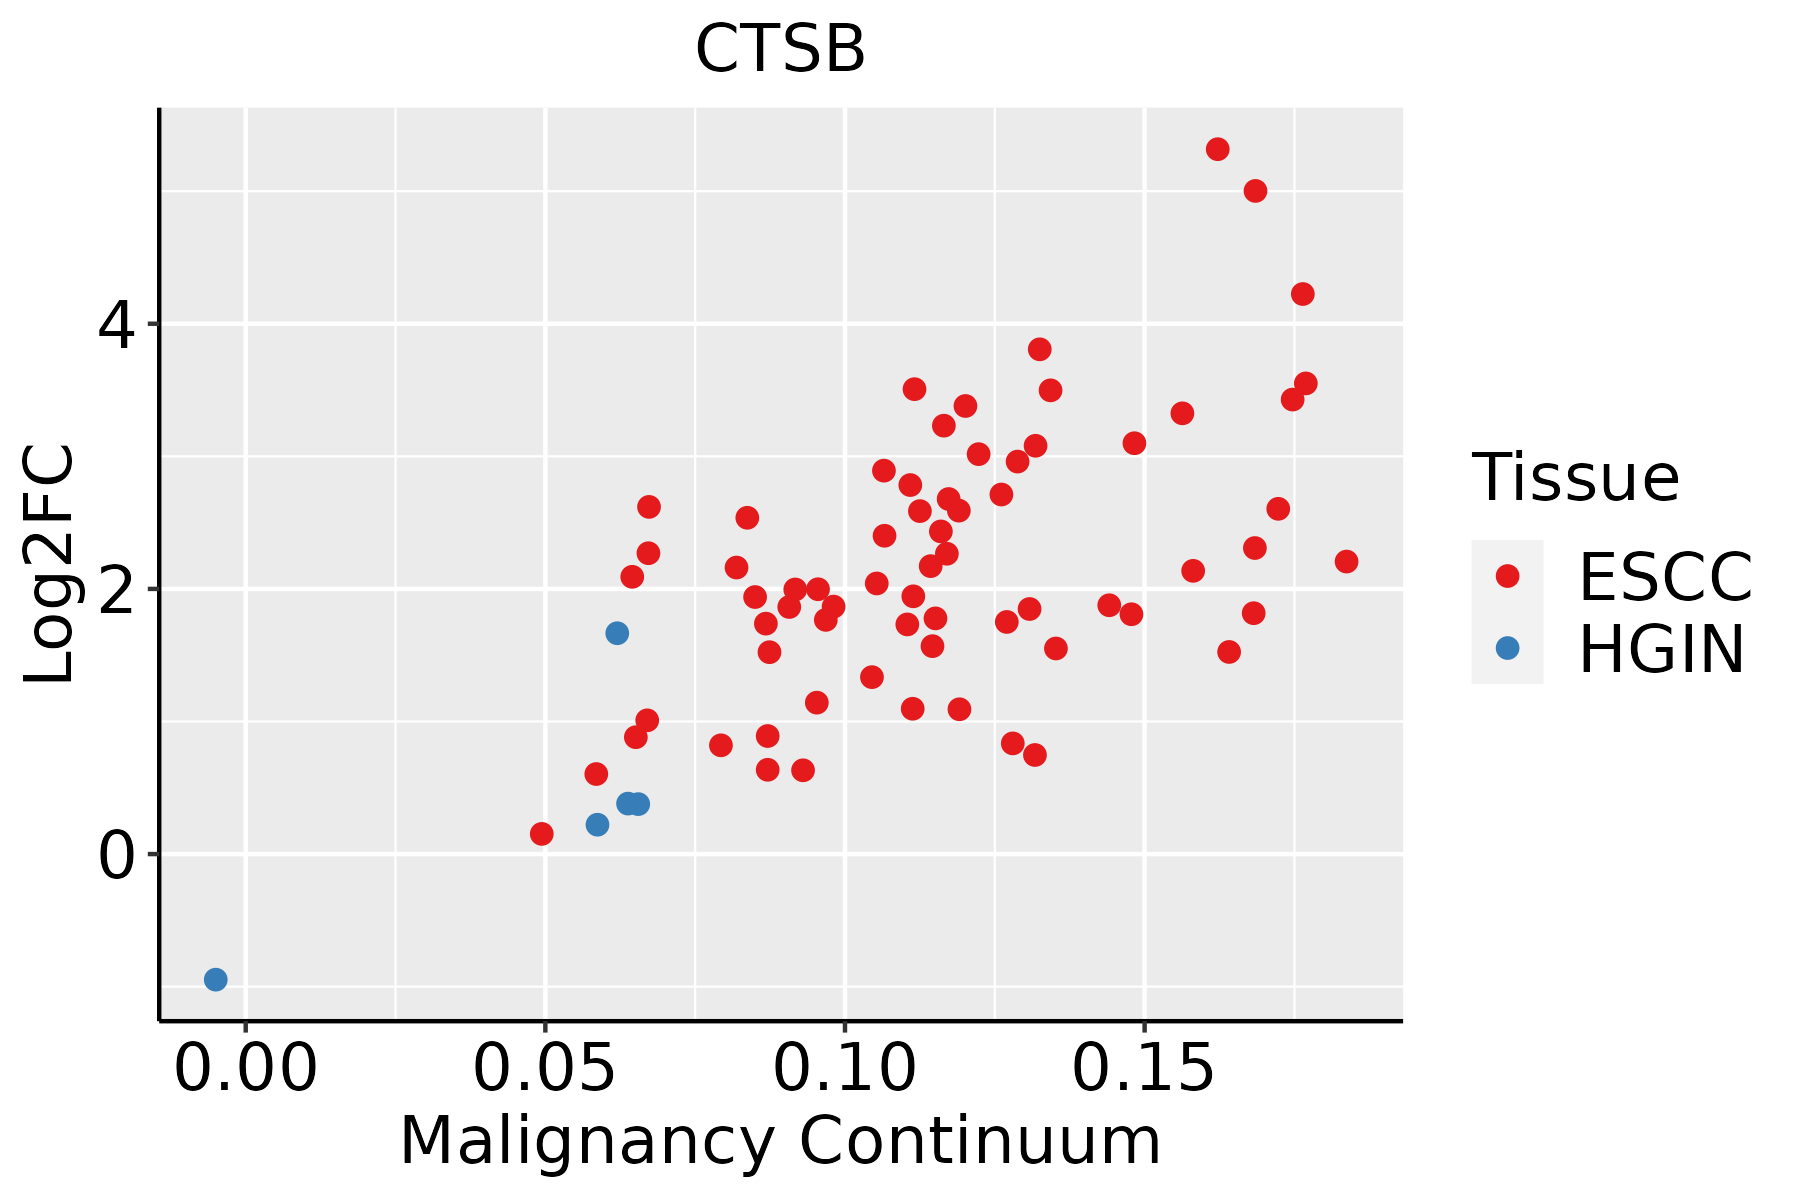 | ESCC: Esophageal squamous cell carcinoma |
| HGIN: High-grade intraepithelial neoplasias | ||
| LGIN: Low-grade intraepithelial neoplasias | ||
| Liver |  | HCC: Hepatocellular carcinoma |
| NAFLD: Non-alcoholic fatty liver disease | ||
| Lung | 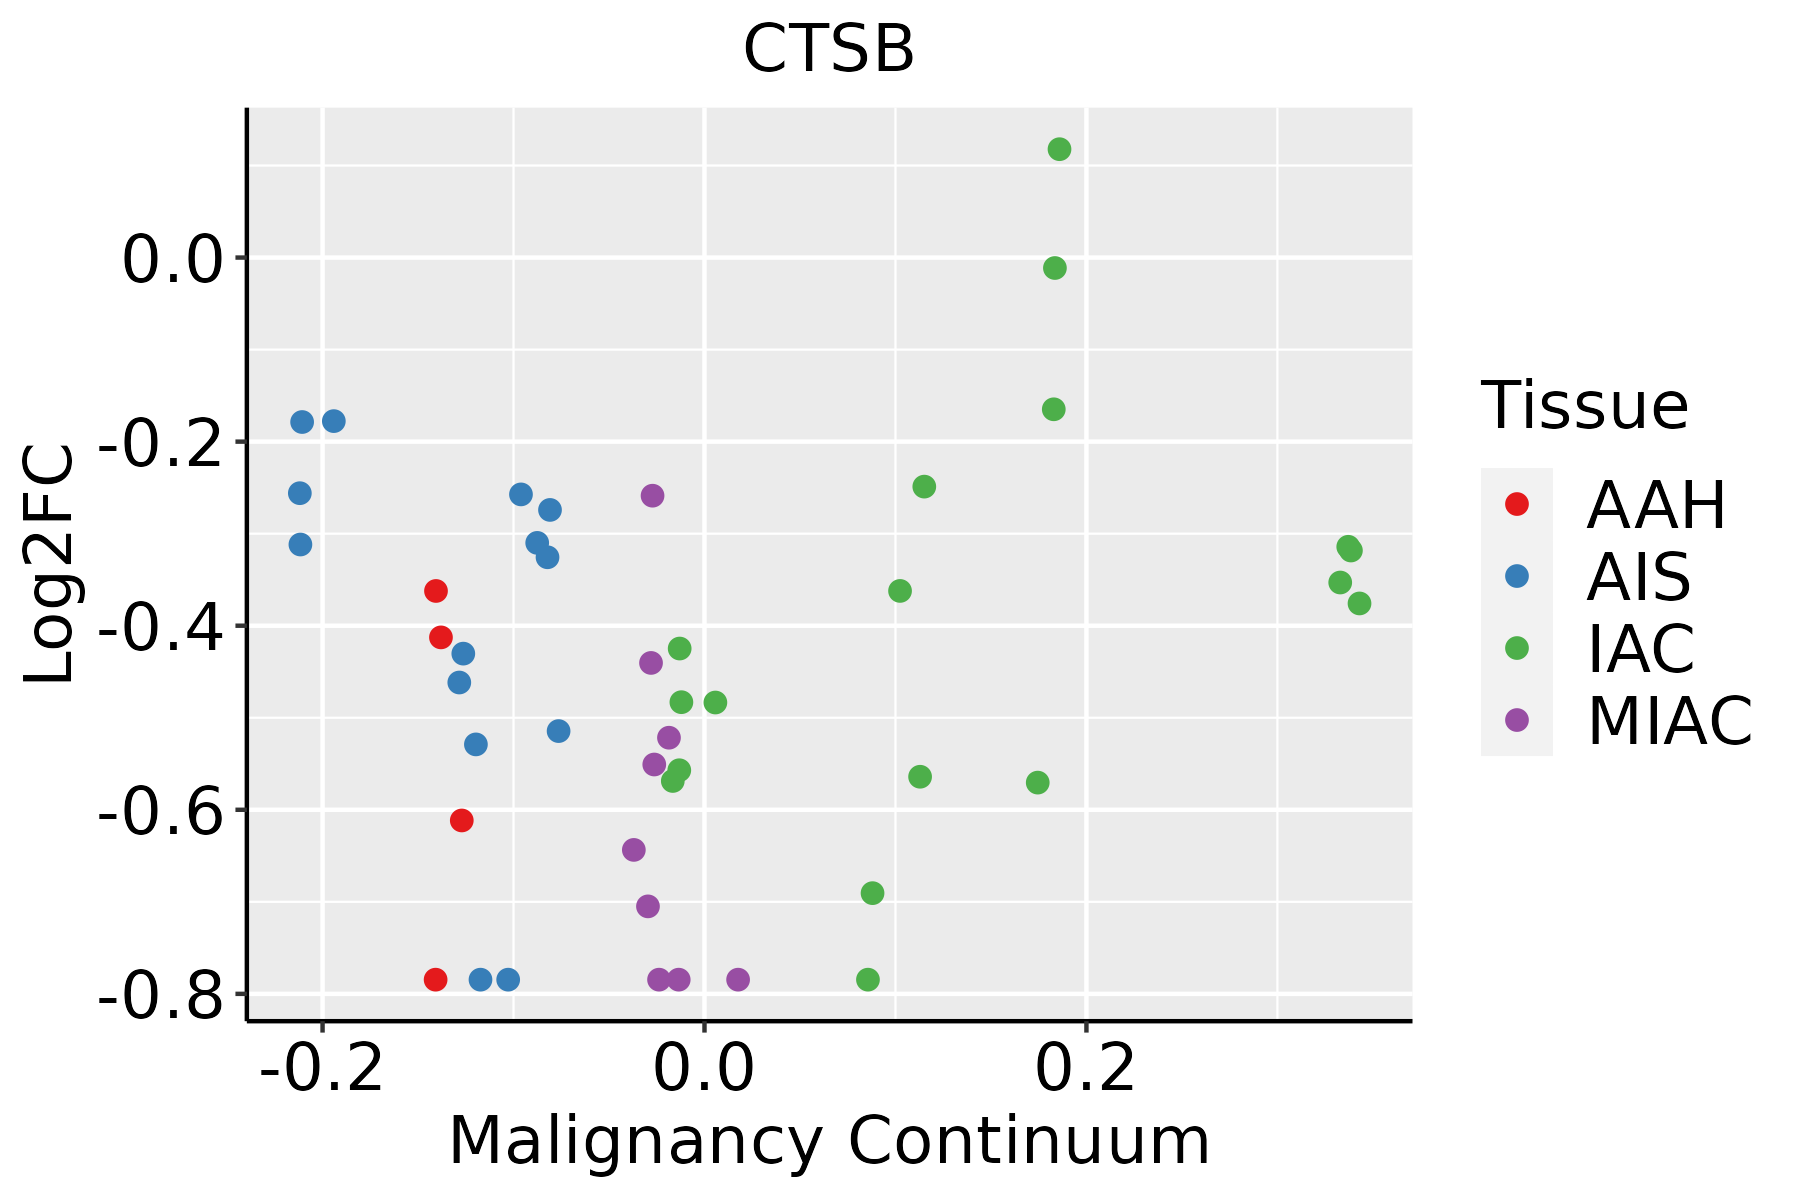 | AAH: Atypical adenomatous hyperplasia |
| AIS: Adenocarcinoma in situ | ||
| IAC: Invasive lung adenocarcinoma | ||
| MIA: Minimally invasive adenocarcinoma | ||
| Oral Cavity |  | EOLP: Erosive Oral lichen planus |
| LP: leukoplakia | ||
| NEOLP: Non-erosive oral lichen planus | ||
| OSCC: Oral squamous cell carcinoma | ||
| Prostate |  | BPH: Benign Prostatic Hyperplasia |
| Skin | 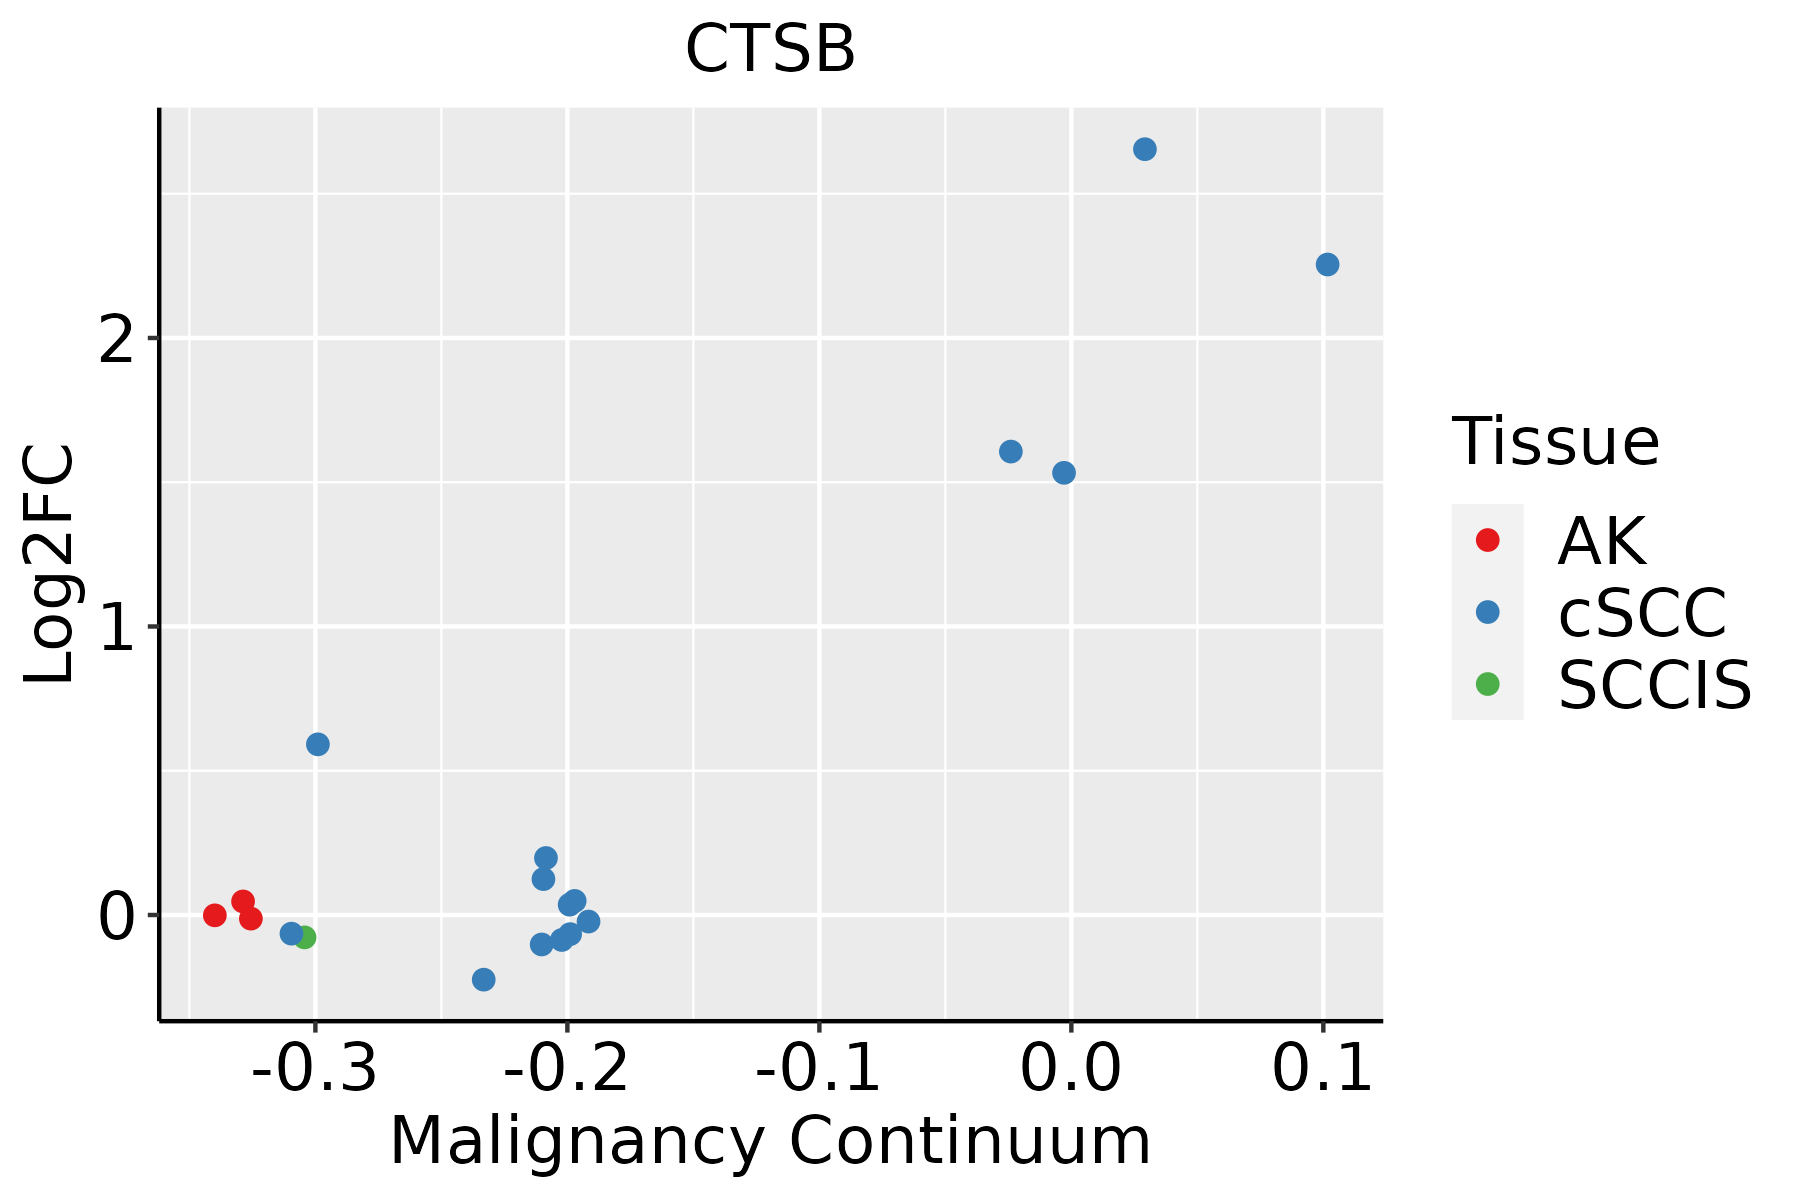 | AK: Actinic keratosis |
| cSCC: Cutaneous squamous cell carcinoma | ||
| SCCIS:squamous cell carcinoma in situ | ||
| Thyroid | 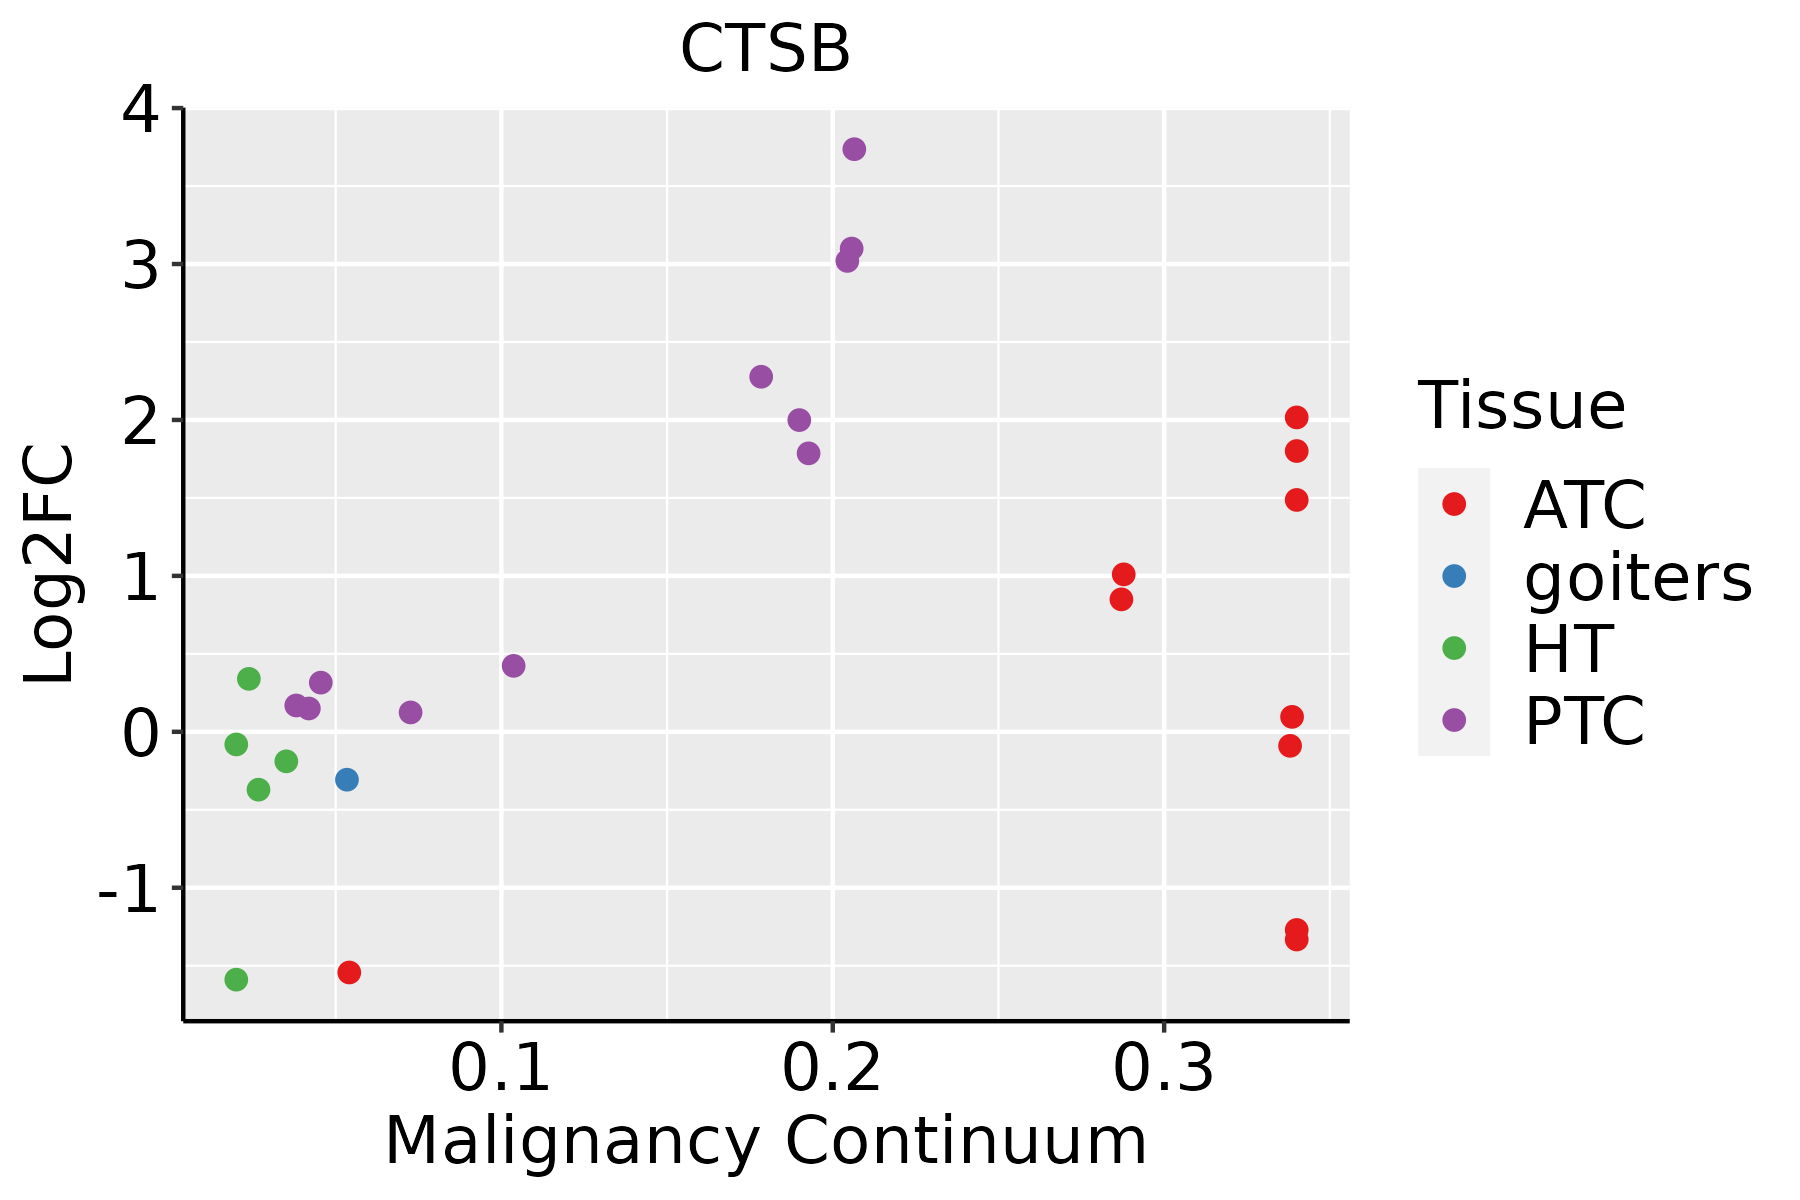 | ATC: Anaplastic thyroid cancer |
| HT: Hashimoto's thyroiditis | ||
| PTC: Papillary thyroid cancer |
| ∗log2FC in expression of this searched gene in stem-like cells from each diseased tissue sample relative to stem-like cells in normal samples in each tissue plotted against the malignancy continuum. Samples are colored based on if they are from different disease stage. |
Top |
Malignant transformation related pathway analysis |
| Find out the enriched GO biological processes and KEGG pathways involved in transition from healthy to precancer to cancer |
| Tissue | Disease Stage | Enriched GO biological Processes |
| Colorectum | AD |  |
| Colorectum | SER |  |
| Colorectum | MSS |  |
| Colorectum | MSI-H |  |
| Colorectum | FAP |  |
| ∗Top 15 enriched GO BP terms are showed in the bar plot of each disease state in each tissue. Each row represents a significant GO biological process which is colored according to the -log10(p.adjust). |
| Page: 1 2 3 4 5 6 7 8 9 |
| GO ID | Tissue | Disease Stage | Description | Gene Ratio | Bg Ratio | pvalue | p.adjust | Count |
| GO:00160329 | Breast | Precancer | viral process | 58/1080 | 415/18723 | 3.42e-10 | 3.16e-08 | 58 |
| GO:00190589 | Breast | Precancer | viral life cycle | 47/1080 | 317/18723 | 2.42e-09 | 1.99e-07 | 47 |
| GO:00444039 | Breast | Precancer | biological process involved in symbiotic interaction | 42/1080 | 290/18723 | 3.40e-08 | 2.11e-06 | 42 |
| GO:00521269 | Breast | Precancer | movement in host environment | 29/1080 | 175/18723 | 2.59e-07 | 1.28e-05 | 29 |
| GO:00517019 | Breast | Precancer | biological process involved in interaction with host | 31/1080 | 203/18723 | 6.52e-07 | 2.71e-05 | 31 |
| GO:00444099 | Breast | Precancer | entry into host | 25/1080 | 151/18723 | 1.74e-06 | 6.19e-05 | 25 |
| GO:00075653 | Breast | Precancer | female pregnancy | 29/1080 | 193/18723 | 2.07e-06 | 7.31e-05 | 29 |
| GO:00467189 | Breast | Precancer | viral entry into host cell | 24/1080 | 144/18723 | 2.46e-06 | 8.35e-05 | 24 |
| GO:00447063 | Breast | Precancer | multi-multicellular organism process | 31/1080 | 220/18723 | 3.73e-06 | 1.19e-04 | 31 |
| GO:00486087 | Breast | Precancer | reproductive structure development | 43/1080 | 424/18723 | 2.36e-04 | 3.56e-03 | 43 |
| GO:00614587 | Breast | Precancer | reproductive system development | 43/1080 | 427/18723 | 2.75e-04 | 4.00e-03 | 43 |
| GO:00018907 | Breast | Precancer | placenta development | 19/1080 | 144/18723 | 6.26e-04 | 7.78e-03 | 19 |
| GO:001603214 | Breast | IDC | viral process | 75/1434 | 415/18723 | 1.98e-12 | 4.02e-10 | 75 |
| GO:001905814 | Breast | IDC | viral life cycle | 61/1434 | 317/18723 | 1.61e-11 | 2.77e-09 | 61 |
| GO:004440314 | Breast | IDC | biological process involved in symbiotic interaction | 52/1434 | 290/18723 | 6.55e-09 | 5.03e-07 | 52 |
| GO:000756511 | Breast | IDC | female pregnancy | 39/1434 | 193/18723 | 1.81e-08 | 1.27e-06 | 39 |
| GO:00447061 | Breast | IDC | multi-multicellular organism process | 41/1434 | 220/18723 | 8.58e-08 | 5.19e-06 | 41 |
| GO:004860812 | Breast | IDC | reproductive structure development | 60/1434 | 424/18723 | 2.71e-06 | 1.03e-04 | 60 |
| GO:005212614 | Breast | IDC | movement in host environment | 32/1434 | 175/18723 | 3.33e-06 | 1.22e-04 | 32 |
| GO:006145813 | Breast | IDC | reproductive system development | 60/1434 | 427/18723 | 3.41e-06 | 1.24e-04 | 60 |
| Page: 1 2 3 4 5 6 7 8 9 10 11 12 13 14 15 16 17 18 19 |
| Pathway ID | Tissue | Disease Stage | Description | Gene Ratio | Bg Ratio | pvalue | p.adjust | qvalue | Count |
| hsa0461218 | Breast | Precancer | Antigen processing and presentation | 19/684 | 78/8465 | 9.61e-06 | 1.12e-04 | 8.62e-05 | 19 |
| hsa042108 | Breast | Precancer | Apoptosis | 25/684 | 136/8465 | 7.61e-05 | 6.87e-04 | 5.26e-04 | 25 |
| hsa0461219 | Breast | Precancer | Antigen processing and presentation | 19/684 | 78/8465 | 9.61e-06 | 1.12e-04 | 8.62e-05 | 19 |
| hsa0421013 | Breast | Precancer | Apoptosis | 25/684 | 136/8465 | 7.61e-05 | 6.87e-04 | 5.26e-04 | 25 |
| hsa0461223 | Breast | IDC | Antigen processing and presentation | 24/867 | 78/8465 | 4.61e-07 | 8.33e-06 | 6.23e-06 | 24 |
| hsa0421022 | Breast | IDC | Apoptosis | 31/867 | 136/8465 | 1.34e-05 | 1.61e-04 | 1.20e-04 | 31 |
| hsa0461233 | Breast | IDC | Antigen processing and presentation | 24/867 | 78/8465 | 4.61e-07 | 8.33e-06 | 6.23e-06 | 24 |
| hsa0421032 | Breast | IDC | Apoptosis | 31/867 | 136/8465 | 1.34e-05 | 1.61e-04 | 1.20e-04 | 31 |
| hsa0461242 | Breast | DCIS | Antigen processing and presentation | 25/846 | 78/8465 | 6.75e-08 | 1.28e-06 | 9.45e-07 | 25 |
| hsa0421041 | Breast | DCIS | Apoptosis | 29/846 | 136/8465 | 5.92e-05 | 5.97e-04 | 4.40e-04 | 29 |
| hsa0461252 | Breast | DCIS | Antigen processing and presentation | 25/846 | 78/8465 | 6.75e-08 | 1.28e-06 | 9.45e-07 | 25 |
| hsa0421051 | Breast | DCIS | Apoptosis | 29/846 | 136/8465 | 5.92e-05 | 5.97e-04 | 4.40e-04 | 29 |
| hsa0461220 | Cervix | CC | Antigen processing and presentation | 34/1267 | 78/8465 | 1.06e-09 | 2.14e-08 | 1.26e-08 | 34 |
| hsa042109 | Cervix | CC | Apoptosis | 36/1267 | 136/8465 | 3.21e-04 | 1.68e-03 | 9.91e-04 | 36 |
| hsa046213 | Cervix | CC | NOD-like receptor signaling pathway | 41/1267 | 186/8465 | 5.90e-03 | 1.95e-02 | 1.15e-02 | 41 |
| hsa04612110 | Cervix | CC | Antigen processing and presentation | 34/1267 | 78/8465 | 1.06e-09 | 2.14e-08 | 1.26e-08 | 34 |
| hsa0421014 | Cervix | CC | Apoptosis | 36/1267 | 136/8465 | 3.21e-04 | 1.68e-03 | 9.91e-04 | 36 |
| hsa0462112 | Cervix | CC | NOD-like receptor signaling pathway | 41/1267 | 186/8465 | 5.90e-03 | 1.95e-02 | 1.15e-02 | 41 |
| hsa0421023 | Cervix | HSIL_HPV | Apoptosis | 16/459 | 136/8465 | 2.74e-03 | 1.78e-02 | 1.44e-02 | 16 |
| hsa0421033 | Cervix | HSIL_HPV | Apoptosis | 16/459 | 136/8465 | 2.74e-03 | 1.78e-02 | 1.44e-02 | 16 |
| Page: 1 2 3 4 5 6 |
Top |
Cell-cell communication analysis |
| Identification of potential cell-cell interactions between two cell types and their ligand-receptor pairs for different disease states |
| Ligand | Receptor | LRpair | Pathway | Tissue | Disease Stage |
| Page: 1 |
Top |
Single-cell gene regulatory network inference analysis |
| Find out the significant the regulons (TFs) and the target genes of each regulon across cell types for different disease states |
| TF | Cell Type | Tissue | Disease Stage | Target Gene | RSS | Regulon Activity |
| ∗The dot plots of a searched regulon are shown for all cell subpopulations in each disease state of each tissue based on the regulon specific score inferred using pySCENIC and by calculating the average expression. |
| Page: 1 |
Top |
Somatic mutation of malignant transformation related genes |
| Annotation of somatic variants for genes involved in malignant transformation |
| Hugo Symbol | Variant Class | Variant Classification | dbSNP RS | HGVSc | HGVSp | HGVSp Short | SWISSPROT | BIOTYPE | SIFT | PolyPhen | Tumor Sample Barcode | Tissue | Histology | Sex | Age | Stage | Therapy Types | Drugs | Outcome |
| CTSB | SNV | Missense_Mutation | novel | c.979N>A | p.Ala327Thr | p.A327T | P07858 | protein_coding | tolerated(0.06) | benign(0.313) | TCGA-5L-AAT1-01 | Breast | breast invasive carcinoma | Female | <65 | III/IV | Hormone Therapy | letrozol | SD |
| CTSB | SNV | Missense_Mutation | c.835G>A | p.Ala279Thr | p.A279T | P07858 | protein_coding | deleterious(0.01) | probably_damaging(1) | TCGA-BH-A0HQ-01 | Breast | breast invasive carcinoma | Female | <65 | I/II | Hormone Therapy | arimidex | SD | |
| CTSB | insertion | Frame_Shift_Ins | novel | c.933_934insTC | p.Ile312SerfsTer52 | p.I312Sfs*52 | P07858 | protein_coding | TCGA-A8-A07U-01 | Breast | breast invasive carcinoma | Female | >=65 | III/IV | Chemotherapy | 5-fluorouracil | SD | ||
| CTSB | insertion | Nonsense_Mutation | novel | c.931_932insGATTTCAACACACAGATTTTTAACAACCTACCCTGA | p.Phe310_Lys311insArgPheGlnHisThrAspPheTerGlnProThrLeu | p.F310_K311insRFQHTDF*QPTL | P07858 | protein_coding | TCGA-A8-A07U-01 | Breast | breast invasive carcinoma | Female | >=65 | III/IV | Chemotherapy | 5-fluorouracil | SD | ||
| CTSB | SNV | Missense_Mutation | c.359G>T | p.Arg120Leu | p.R120L | P07858 | protein_coding | deleterious(0) | probably_damaging(0.993) | TCGA-A6-2686-01 | Colorectum | colon adenocarcinoma | Female | >=65 | I/II | Unknown | Unknown | SD | |
| CTSB | SNV | Missense_Mutation | novel | c.313N>C | p.Cys105Arg | p.C105R | P07858 | protein_coding | deleterious(0) | benign(0.232) | TCGA-AA-3947-01 | Colorectum | colon adenocarcinoma | Female | <65 | I/II | Unknown | Unknown | SD |
| CTSB | SNV | Missense_Mutation | c.536G>A | p.Cys179Tyr | p.C179Y | P07858 | protein_coding | deleterious(0) | probably_damaging(0.997) | TCGA-AA-A022-01 | Colorectum | colon adenocarcinoma | Female | >=65 | I/II | Unknown | Unknown | SD | |
| CTSB | SNV | Missense_Mutation | rs770370292 | c.97T>C | p.Tyr33His | p.Y33H | P07858 | protein_coding | tolerated(0.16) | benign(0.023) | TCGA-CK-6746-01 | Colorectum | colon adenocarcinoma | Female | >=65 | I/II | Unknown | Unknown | SD |
| CTSB | SNV | Missense_Mutation | rs778494806 | c.964N>A | p.Glu322Lys | p.E322K | P07858 | protein_coding | deleterious(0) | probably_damaging(1) | TCGA-AG-A002-01 | Colorectum | rectum adenocarcinoma | Male | <65 | I/II | Unknown | Unknown | SD |
| CTSB | SNV | Missense_Mutation | c.571N>A | p.Val191Ile | p.V191I | P07858 | protein_coding | tolerated(0.09) | benign(0.055) | TCGA-AG-A002-01 | Colorectum | rectum adenocarcinoma | Male | <65 | I/II | Unknown | Unknown | SD |
| Page: 1 2 3 |
Top |
Related drugs of malignant transformation related genes |
| Identification of chemicals and drugs interact with genes involved in malignant transfromation |
| (DGIdb 4.0) |
| Entrez ID | Symbol | Category | Interaction Types | Drug Claim Name | Drug Name | PMIDs |
| 1508 | CTSB | DRUGGABLE GENOME, PROTEASE, EXTERNAL SIDE OF PLASMA MEMBRANE, ENZYME | Dimethoxybenzylidene-2-thio-imidazole-4-one derivative 1 | |||
| 1508 | CTSB | DRUGGABLE GENOME, PROTEASE, EXTERNAL SIDE OF PLASMA MEMBRANE, ENZYME | inhibitor | 178103148 | ||
| 1508 | CTSB | DRUGGABLE GENOME, PROTEASE, EXTERNAL SIDE OF PLASMA MEMBRANE, ENZYME | PMID27998201-Compound-22 | |||
| 1508 | CTSB | DRUGGABLE GENOME, PROTEASE, EXTERNAL SIDE OF PLASMA MEMBRANE, ENZYME | PMID27998201-Compound-9 | |||
| 1508 | CTSB | DRUGGABLE GENOME, PROTEASE, EXTERNAL SIDE OF PLASMA MEMBRANE, ENZYME | PMID27998201-Compound-12 | |||
| 1508 | CTSB | DRUGGABLE GENOME, PROTEASE, EXTERNAL SIDE OF PLASMA MEMBRANE, ENZYME | PMID27998201-Compound-11 | |||
| 1508 | CTSB | DRUGGABLE GENOME, PROTEASE, EXTERNAL SIDE OF PLASMA MEMBRANE, ENZYME | PMID27998201-Compound-5 | |||
| 1508 | CTSB | DRUGGABLE GENOME, PROTEASE, EXTERNAL SIDE OF PLASMA MEMBRANE, ENZYME | inhibitor | 405067337 | ||
| 1508 | CTSB | DRUGGABLE GENOME, PROTEASE, EXTERNAL SIDE OF PLASMA MEMBRANE, ENZYME | inhibitor | 405560408 | ||
| 1508 | CTSB | DRUGGABLE GENOME, PROTEASE, EXTERNAL SIDE OF PLASMA MEMBRANE, ENZYME | PMID27998201-Compound-17 |
| Page: 1 2 |

Copyright 2023-Present -The University of Texas Health Science Center at Houston |