
|
|||||
|
 | |
| |
| |
| |
| |
| |
|
Gene: CTSA |
Gene summary for CTSA |
| Gene information | Species | Human | Gene symbol | CTSA | Gene ID | 5476 |
| Gene name | cathepsin A | |
| Gene Alias | GLB2 | |
| Cytomap | 20q13.12 | |
| Gene Type | protein-coding | GO ID | GO:0006508 | UniProtAcc | P10619 |
Top |
Malignant transformation analysis |
| Identification of the aberrant gene expression in precancerous and cancerous lesions by comparing the gene expression of stem-like cells in diseased tissues with normal stem cells |
| Entrez ID | Symbol | Replicates | Species | Organ | Tissue | Adj P-value | Log2FC | Malignancy |
| 5476 | CTSA | LZE4T | Human | Esophagus | ESCC | 7.98e-17 | 4.08e-01 | 0.0811 |
| 5476 | CTSA | LZE5T | Human | Esophagus | ESCC | 4.25e-04 | 6.93e-01 | 0.0514 |
| 5476 | CTSA | LZE7T | Human | Esophagus | ESCC | 8.08e-08 | 4.62e-01 | 0.0667 |
| 5476 | CTSA | LZE8T | Human | Esophagus | ESCC | 1.84e-13 | 3.31e-01 | 0.067 |
| 5476 | CTSA | LZE20T | Human | Esophagus | ESCC | 1.25e-17 | 8.18e-01 | 0.0662 |
| 5476 | CTSA | LZE21D1 | Human | Esophagus | HGIN | 3.56e-02 | 5.65e-01 | 0.0632 |
| 5476 | CTSA | LZE22T | Human | Esophagus | ESCC | 6.57e-07 | 6.75e-01 | 0.068 |
| 5476 | CTSA | LZE24T | Human | Esophagus | ESCC | 6.58e-31 | 8.29e-01 | 0.0596 |
| 5476 | CTSA | LZE21T | Human | Esophagus | ESCC | 2.96e-03 | 5.87e-01 | 0.0655 |
| 5476 | CTSA | LZE6T | Human | Esophagus | ESCC | 3.51e-12 | 7.82e-01 | 0.0845 |
| 5476 | CTSA | P1T-E | Human | Esophagus | ESCC | 1.60e-11 | 1.14e+00 | 0.0875 |
| 5476 | CTSA | P2T-E | Human | Esophagus | ESCC | 2.04e-37 | 5.98e-01 | 0.1177 |
| 5476 | CTSA | P4T-E | Human | Esophagus | ESCC | 2.64e-40 | 9.03e-01 | 0.1323 |
| 5476 | CTSA | P5T-E | Human | Esophagus | ESCC | 1.84e-11 | 4.17e-01 | 0.1327 |
| 5476 | CTSA | P8T-E | Human | Esophagus | ESCC | 4.41e-50 | 1.12e+00 | 0.0889 |
| 5476 | CTSA | P9T-E | Human | Esophagus | ESCC | 6.34e-19 | 5.89e-01 | 0.1131 |
| 5476 | CTSA | P10T-E | Human | Esophagus | ESCC | 5.91e-25 | 5.38e-01 | 0.116 |
| 5476 | CTSA | P11T-E | Human | Esophagus | ESCC | 9.72e-35 | 1.75e+00 | 0.1426 |
| 5476 | CTSA | P12T-E | Human | Esophagus | ESCC | 8.25e-41 | 8.91e-01 | 0.1122 |
| 5476 | CTSA | P15T-E | Human | Esophagus | ESCC | 2.56e-43 | 9.30e-01 | 0.1149 |
| Page: 1 2 3 4 5 6 7 8 |
| Tissue | Expression Dynamics | Abbreviation |
| Esophagus | 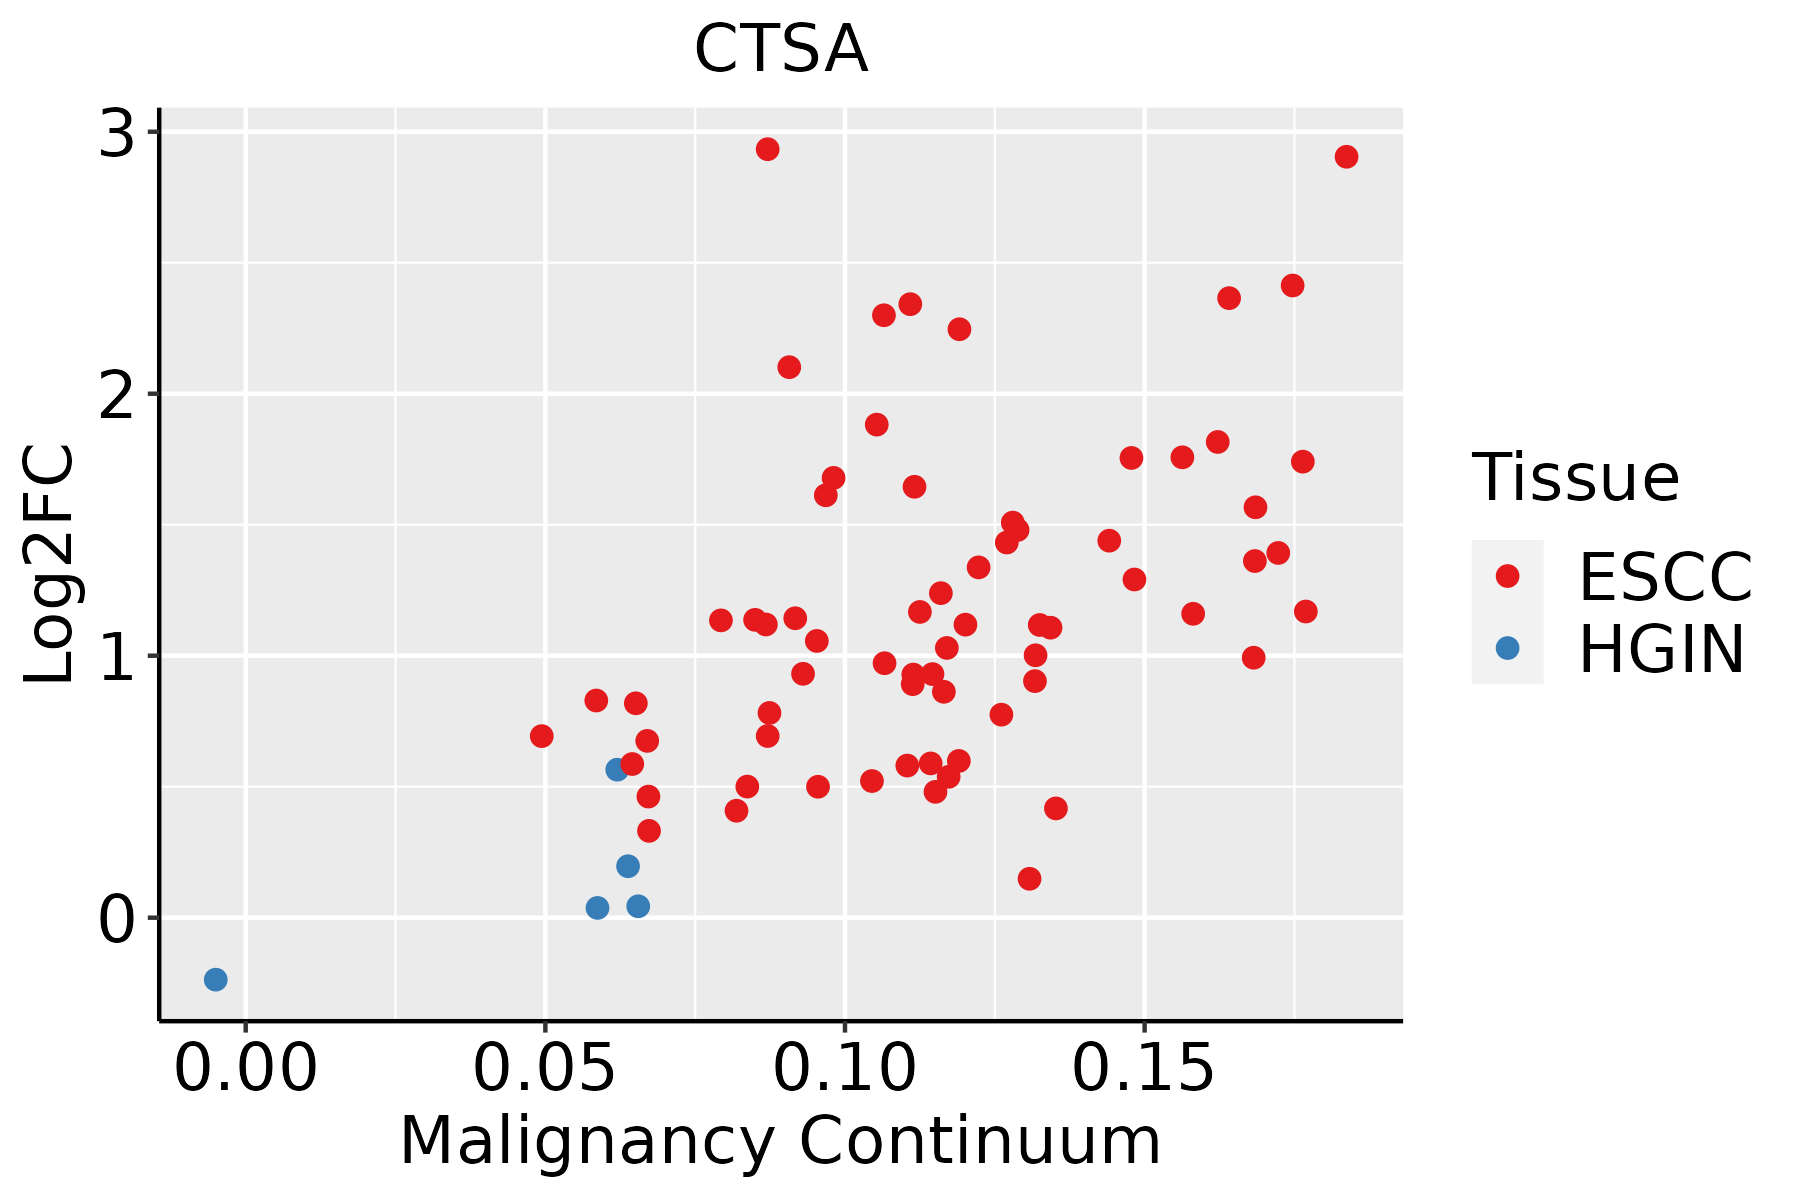 | ESCC: Esophageal squamous cell carcinoma |
| HGIN: High-grade intraepithelial neoplasias | ||
| LGIN: Low-grade intraepithelial neoplasias | ||
| GC |  | CAG: Chronic atrophic gastritis |
| CAG with IM: Chronic atrophic gastritis with intestinal metaplasia | ||
| CSG: Chronic superficial gastritis | ||
| GC: Gastric cancer | ||
| SIM: Severe intestinal metaplasia | ||
| WIM: Wild intestinal metaplasia | ||
| Liver | 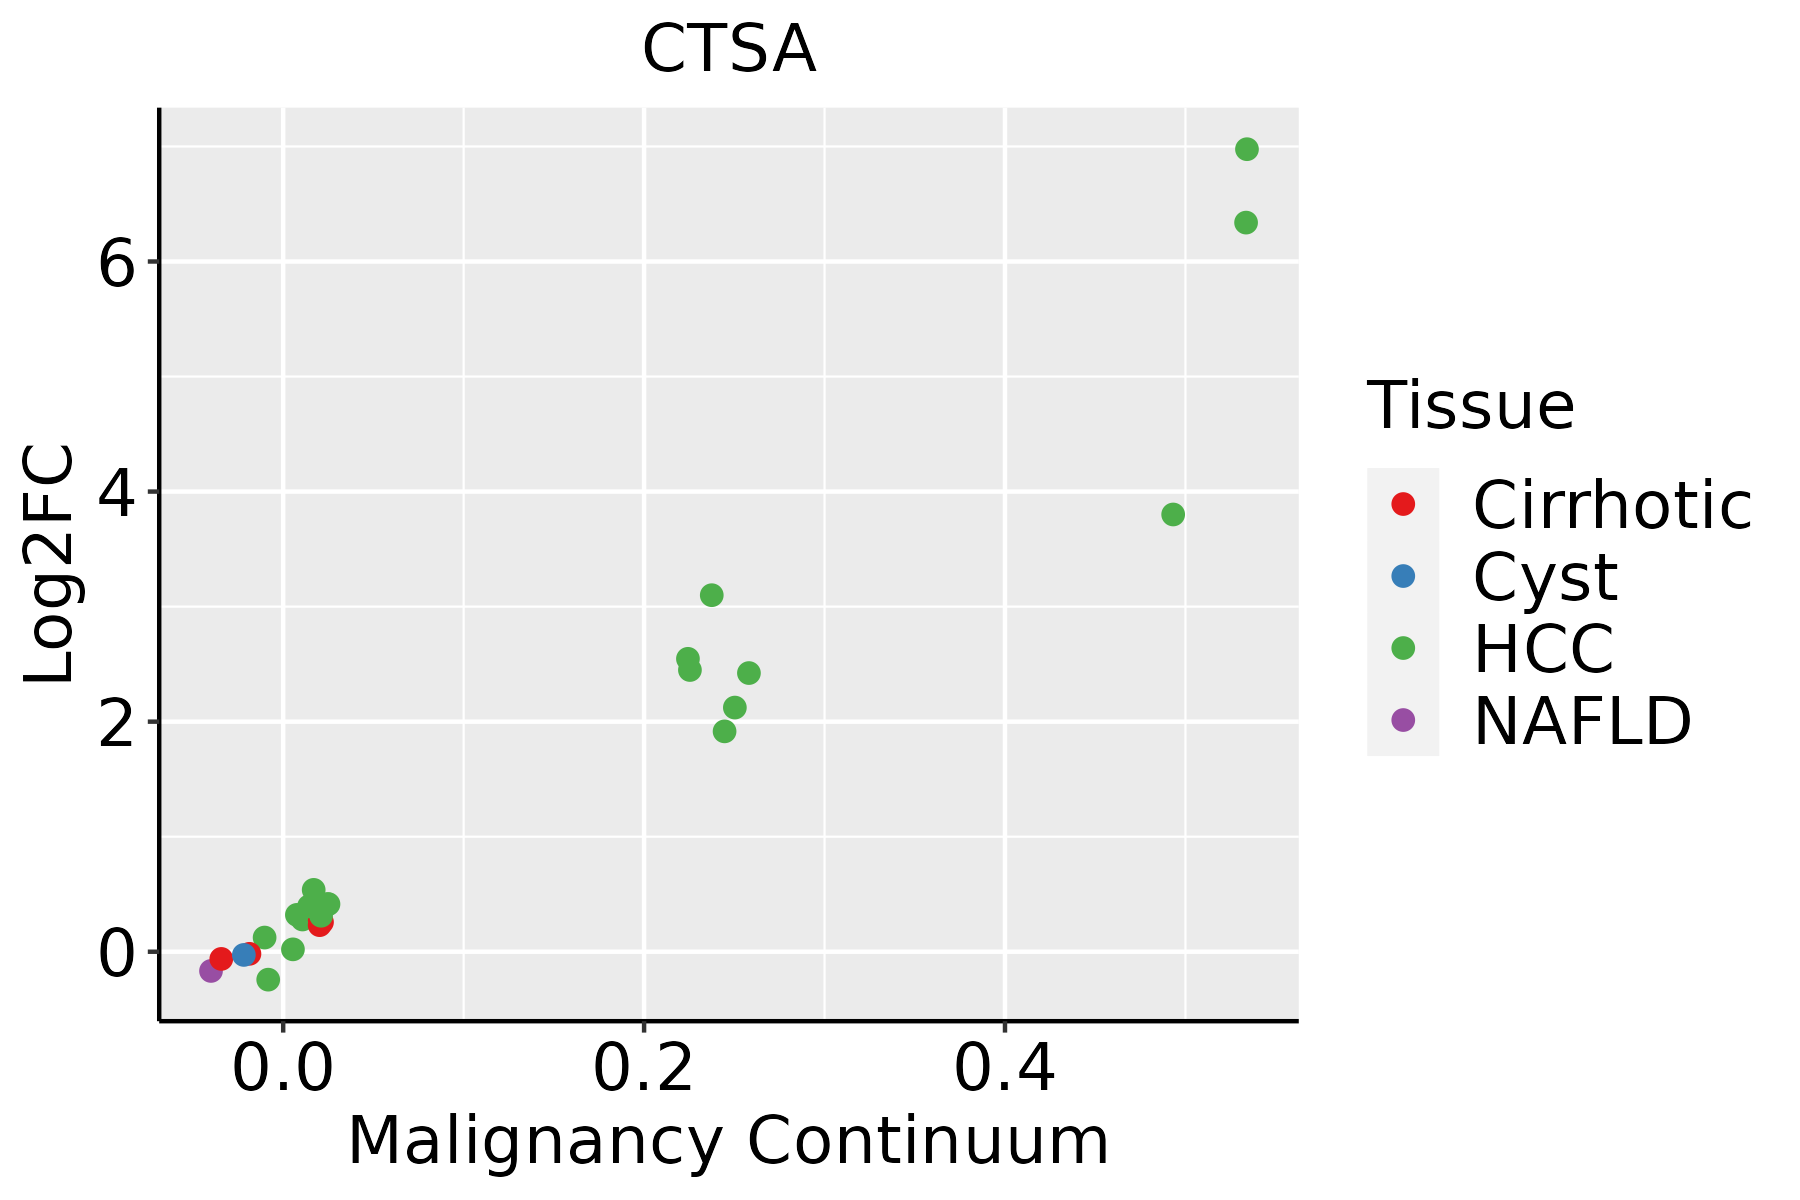 | HCC: Hepatocellular carcinoma |
| NAFLD: Non-alcoholic fatty liver disease | ||
| Oral Cavity |  | EOLP: Erosive Oral lichen planus |
| LP: leukoplakia | ||
| NEOLP: Non-erosive oral lichen planus | ||
| OSCC: Oral squamous cell carcinoma | ||
| Skin |  | AK: Actinic keratosis |
| cSCC: Cutaneous squamous cell carcinoma | ||
| SCCIS:squamous cell carcinoma in situ | ||
| Thyroid | 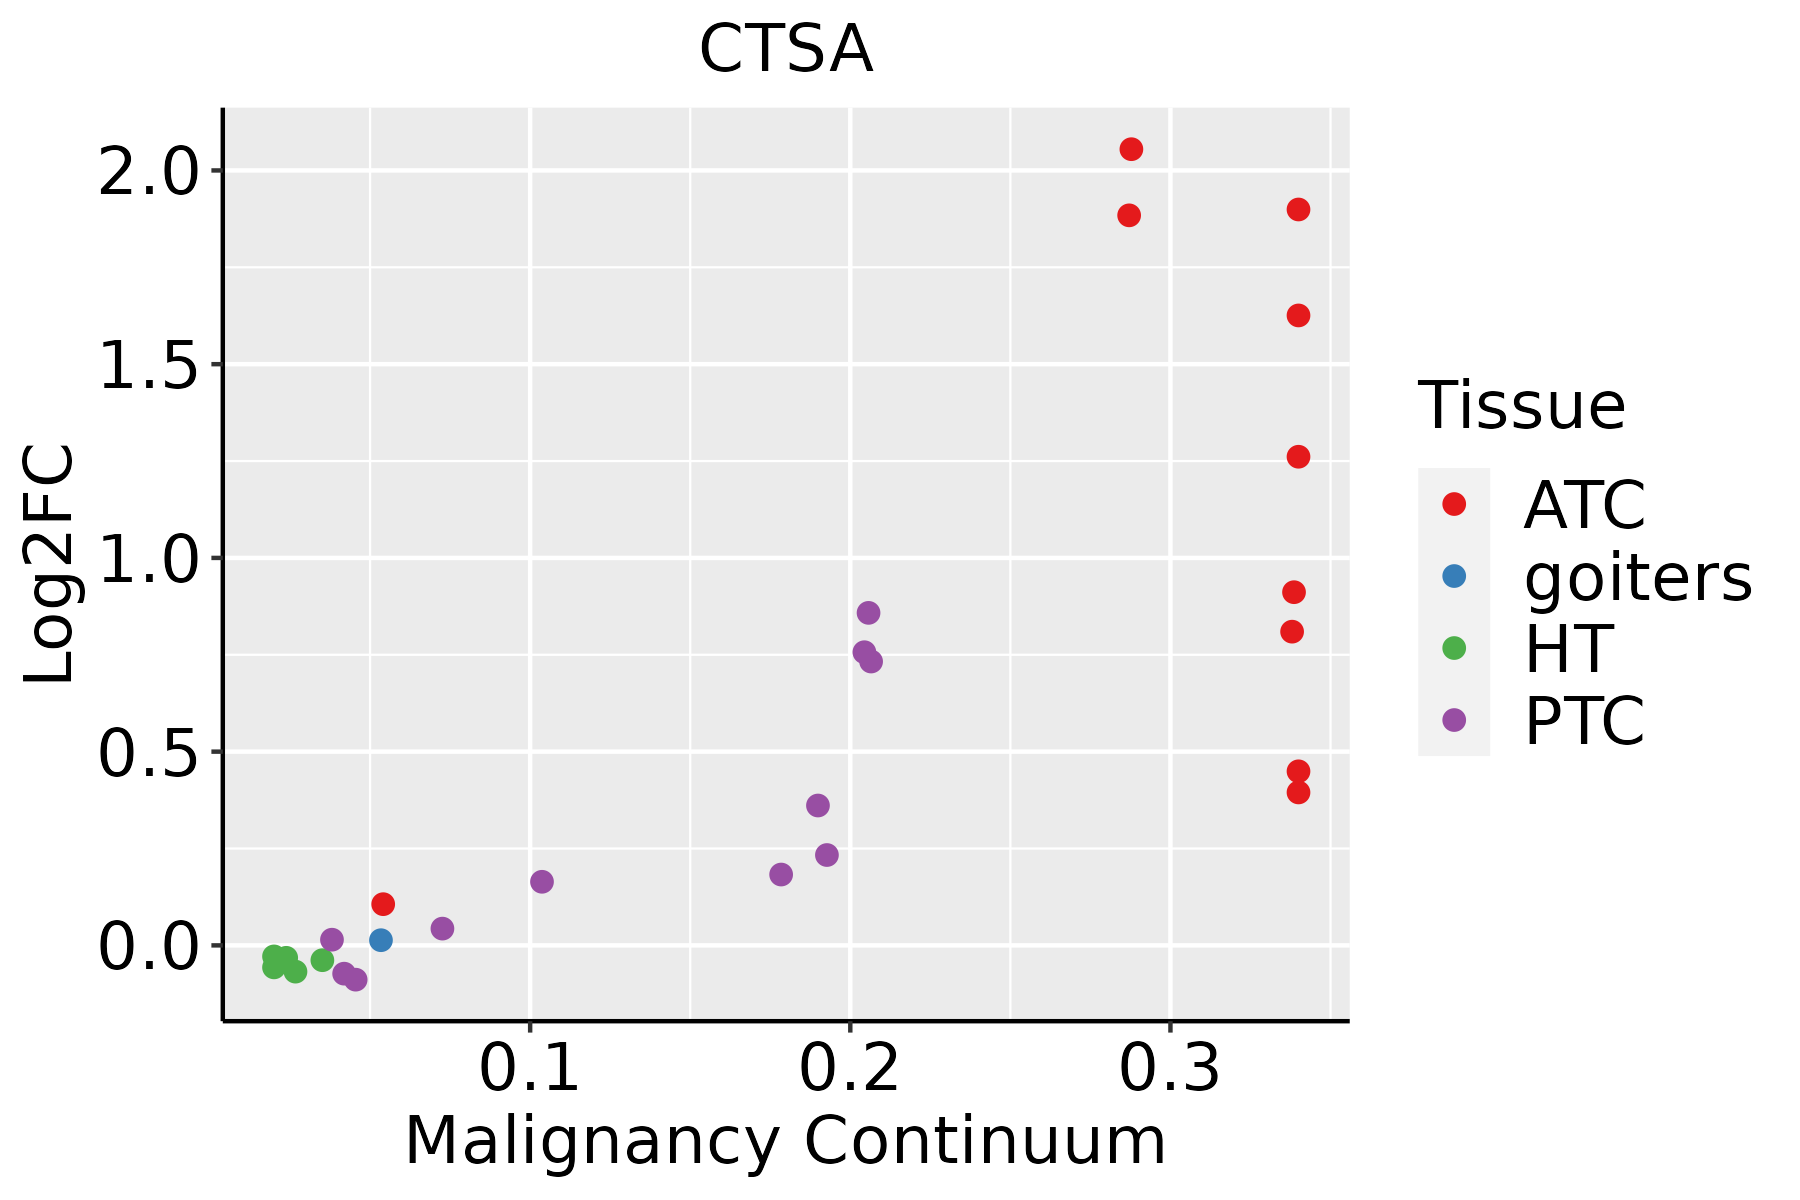 | ATC: Anaplastic thyroid cancer |
| HT: Hashimoto's thyroiditis | ||
| PTC: Papillary thyroid cancer |
| ∗log2FC in expression of this searched gene in stem-like cells from each diseased tissue sample relative to stem-like cells in normal samples in each tissue plotted against the malignancy continuum. Samples are colored based on if they are from different disease stage. |
Top |
Malignant transformation related pathway analysis |
| Find out the enriched GO biological processes and KEGG pathways involved in transition from healthy to precancer to cancer |
| Tissue | Disease Stage | Enriched GO biological Processes |
| Colorectum | AD |  |
| Colorectum | SER |  |
| Colorectum | MSS |  |
| Colorectum | MSI-H |  |
| Colorectum | FAP |  |
| ∗Top 15 enriched GO BP terms are showed in the bar plot of each disease state in each tissue. Each row represents a significant GO biological process which is colored according to the -log10(p.adjust). |
| Page: 1 2 3 4 5 6 7 8 9 |
| GO ID | Tissue | Disease Stage | Description | Gene Ratio | Bg Ratio | pvalue | p.adjust | Count |
| GO:004217627 | Esophagus | HGIN | regulation of protein catabolic process | 119/2587 | 391/18723 | 8.09e-18 | 2.43e-15 | 119 |
| GO:003164727 | Esophagus | HGIN | regulation of protein stability | 96/2587 | 298/18723 | 2.21e-16 | 5.76e-14 | 96 |
| GO:000989520 | Esophagus | HGIN | negative regulation of catabolic process | 87/2587 | 320/18723 | 1.74e-10 | 1.68e-08 | 87 |
| GO:003133026 | Esophagus | HGIN | negative regulation of cellular catabolic process | 74/2587 | 262/18723 | 6.27e-10 | 5.30e-08 | 74 |
| GO:001050616 | Esophagus | HGIN | regulation of autophagy | 84/2587 | 317/18723 | 1.39e-09 | 1.08e-07 | 84 |
| GO:004217720 | Esophagus | HGIN | negative regulation of protein catabolic process | 37/2587 | 121/18723 | 1.47e-06 | 5.56e-05 | 37 |
| GO:00105076 | Esophagus | HGIN | negative regulation of autophagy | 27/2587 | 85/18723 | 1.72e-05 | 4.71e-04 | 27 |
| GO:006168416 | Esophagus | HGIN | chaperone-mediated autophagy | 9/2587 | 16/18723 | 8.25e-05 | 1.82e-03 | 9 |
| GO:0042176111 | Esophagus | ESCC | regulation of protein catabolic process | 280/8552 | 391/18723 | 8.65e-26 | 2.39e-23 | 280 |
| GO:0031647111 | Esophagus | ESCC | regulation of protein stability | 223/8552 | 298/18723 | 5.76e-25 | 1.52e-22 | 223 |
| GO:001050617 | Esophagus | ESCC | regulation of autophagy | 220/8552 | 317/18723 | 6.72e-18 | 6.36e-16 | 220 |
| GO:0009895111 | Esophagus | ESCC | negative regulation of catabolic process | 201/8552 | 320/18723 | 3.88e-10 | 1.05e-08 | 201 |
| GO:0031330111 | Esophagus | ESCC | negative regulation of cellular catabolic process | 166/8552 | 262/18723 | 5.17e-09 | 1.08e-07 | 166 |
| GO:0042177111 | Esophagus | ESCC | negative regulation of protein catabolic process | 84/8552 | 121/18723 | 1.03e-07 | 1.69e-06 | 84 |
| GO:001050712 | Esophagus | ESCC | negative regulation of autophagy | 56/8552 | 85/18723 | 1.34e-04 | 9.09e-04 | 56 |
| GO:006168417 | Esophagus | ESCC | chaperone-mediated autophagy | 13/8552 | 16/18723 | 4.05e-03 | 1.62e-02 | 13 |
| GO:004217612 | Liver | Cirrhotic | regulation of protein catabolic process | 181/4634 | 391/18723 | 7.94e-21 | 2.77e-18 | 181 |
| GO:003164712 | Liver | Cirrhotic | regulation of protein stability | 144/4634 | 298/18723 | 6.74e-19 | 1.28e-16 | 144 |
| GO:001050611 | Liver | Cirrhotic | regulation of autophagy | 132/4634 | 317/18723 | 2.17e-11 | 1.33e-09 | 132 |
| GO:000989512 | Liver | Cirrhotic | negative regulation of catabolic process | 121/4634 | 320/18723 | 1.21e-07 | 3.39e-06 | 121 |
| Page: 1 2 3 4 5 |
| Pathway ID | Tissue | Disease Stage | Description | Gene Ratio | Bg Ratio | pvalue | p.adjust | qvalue | Count |
| hsa041426 | Esophagus | HGIN | Lysosome | 33/1383 | 132/8465 | 6.65e-03 | 4.37e-02 | 3.47e-02 | 33 |
| hsa0414213 | Esophagus | HGIN | Lysosome | 33/1383 | 132/8465 | 6.65e-03 | 4.37e-02 | 3.47e-02 | 33 |
| hsa0414222 | Esophagus | ESCC | Lysosome | 102/4205 | 132/8465 | 5.11e-11 | 7.13e-10 | 3.65e-10 | 102 |
| hsa0414232 | Esophagus | ESCC | Lysosome | 102/4205 | 132/8465 | 5.11e-11 | 7.13e-10 | 3.65e-10 | 102 |
| hsa041424 | Liver | Cirrhotic | Lysosome | 68/2530 | 132/8465 | 1.34e-07 | 1.97e-06 | 1.21e-06 | 68 |
| hsa0414211 | Liver | Cirrhotic | Lysosome | 68/2530 | 132/8465 | 1.34e-07 | 1.97e-06 | 1.21e-06 | 68 |
| hsa041422 | Liver | HCC | Lysosome | 100/4020 | 132/8465 | 2.32e-11 | 4.31e-10 | 2.40e-10 | 100 |
| hsa041423 | Liver | HCC | Lysosome | 100/4020 | 132/8465 | 2.32e-11 | 4.31e-10 | 2.40e-10 | 100 |
| hsa041425 | Oral cavity | OSCC | Lysosome | 87/3704 | 132/8465 | 1.97e-07 | 1.35e-06 | 6.86e-07 | 87 |
| hsa0414212 | Oral cavity | OSCC | Lysosome | 87/3704 | 132/8465 | 1.97e-07 | 1.35e-06 | 6.86e-07 | 87 |
| hsa0414221 | Oral cavity | LP | Lysosome | 67/2418 | 132/8465 | 5.13e-08 | 7.77e-07 | 5.01e-07 | 67 |
| hsa0414231 | Oral cavity | LP | Lysosome | 67/2418 | 132/8465 | 5.13e-08 | 7.77e-07 | 5.01e-07 | 67 |
| Page: 1 |
Top |
Cell-cell communication analysis |
| Identification of potential cell-cell interactions between two cell types and their ligand-receptor pairs for different disease states |
| Ligand | Receptor | LRpair | Pathway | Tissue | Disease Stage |
| Page: 1 |
Top |
Single-cell gene regulatory network inference analysis |
| Find out the significant the regulons (TFs) and the target genes of each regulon across cell types for different disease states |
| TF | Cell Type | Tissue | Disease Stage | Target Gene | RSS | Regulon Activity |
| ∗The dot plots of a searched regulon are shown for all cell subpopulations in each disease state of each tissue based on the regulon specific score inferred using pySCENIC and by calculating the average expression. |
| Page: 1 |
Top |
Somatic mutation of malignant transformation related genes |
| Annotation of somatic variants for genes involved in malignant transformation |
| Hugo Symbol | Variant Class | Variant Classification | dbSNP RS | HGVSc | HGVSp | HGVSp Short | SWISSPROT | BIOTYPE | SIFT | PolyPhen | Tumor Sample Barcode | Tissue | Histology | Sex | Age | Stage | Therapy Types | Drugs | Outcome |
| CTSA | SNV | Missense_Mutation | c.419N>T | p.Asn140Ile | p.N140I | protein_coding | deleterious(0) | possibly_damaging(0.899) | TCGA-A2-A0EU-01 | Breast | breast invasive carcinoma | Female | >=65 | I/II | Unknown | Unknown | SD | ||
| CTSA | SNV | Missense_Mutation | novel | c.661N>A | p.Ala221Thr | p.A221T | protein_coding | deleterious(0) | probably_damaging(1) | TCGA-EW-A1IZ-01 | Breast | breast invasive carcinoma | Female | <65 | III/IV | Chemotherapy | taxotere | SD | |
| CTSA | insertion | Nonsense_Mutation | novel | c.1088_1089insAG | p.Tyr363Ter | p.Y363* | protein_coding | TCGA-A8-A07Z-01 | Breast | breast invasive carcinoma | Female | >=65 | I/II | Unspecific | Exemestane | SD | |||
| CTSA | SNV | Missense_Mutation | c.637N>T | p.Pro213Ser | p.P213S | protein_coding | tolerated(0.63) | benign(0.003) | TCGA-IR-A3LK-01 | Cervix | cervical & endocervical cancer | Female | >=65 | I/II | Chemotherapy | cisplatin | PD | ||
| CTSA | deletion | Frame_Shift_Del | rs777834472 | c.1038delN | p.Cys349AlafsTer36 | p.C349Afs*36 | protein_coding | TCGA-2W-A8YY-01 | Cervix | cervical & endocervical cancer | Female | <65 | I/II | Chemotherapy | cisplatin | CR | |||
| CTSA | deletion | In_Frame_Del | novel | c.145_150delNNNNNN | p.Gln50_Asp51del | p.Q50_D51del | protein_coding | TCGA-IR-A3L7-01 | Cervix | cervical & endocervical cancer | Female | <65 | I/II | Chemotherapy | cisplatin | CR | |||
| CTSA | deletion | Frame_Shift_Del | rs755100318 | c.393delN | p.Tyr133IlefsTer5 | p.Y133Ifs*5 | protein_coding | TCGA-A6-5661-01 | Colorectum | colon adenocarcinoma | Female | >=65 | I/II | Unknown | Unknown | SD | |||
| CTSA | deletion | Frame_Shift_Del | rs777834472 | c.1044delC | p.Cys349AlafsTer36 | p.C349Afs*36 | protein_coding | TCGA-AA-3833-01 | Colorectum | colon adenocarcinoma | Female | <65 | I/II | Unknown | Unknown | SD | |||
| CTSA | deletion | Frame_Shift_Del | rs777834472 | c.1044delC | p.Cys349AlafsTer36 | p.C349Afs*36 | protein_coding | TCGA-G4-6586-01 | Colorectum | colon adenocarcinoma | Female | >=65 | I/II | Unknown | Unknown | SD | |||
| CTSA | SNV | Missense_Mutation | novel | c.749N>C | p.Leu250Pro | p.L250P | protein_coding | deleterious(0) | probably_damaging(1) | TCGA-AJ-A23O-01 | Endometrium | uterine corpus endometrioid carcinoma | Female | >=65 | I/II | Unknown | Unknown | SD |
| Page: 1 2 3 4 5 |
Top |
Related drugs of malignant transformation related genes |
| Identification of chemicals and drugs interact with genes involved in malignant transfromation |
| (DGIdb 4.0) |
| Entrez ID | Symbol | Category | Interaction Types | Drug Claim Name | Drug Name | PMIDs |
| 5476 | CTSA | DRUGGABLE GENOME, ENZYME, PROTEASE | SAR164653 | |||
| 5476 | CTSA | DRUGGABLE GENOME, ENZYME, PROTEASE | inhibitor | 223366200 | TELAPREVIR | |
| 5476 | CTSA | DRUGGABLE GENOME, ENZYME, PROTEASE | inhibitor | 223366214 | ||
| 5476 | CTSA | DRUGGABLE GENOME, ENZYME, PROTEASE | inhibitor | 223366205 | BOCEPREVIR | |
| 5476 | CTSA | DRUGGABLE GENOME, ENZYME, PROTEASE | inhibitor | 223366215 |
| Page: 1 |

Copyright 2023-Present -The University of Texas Health Science Center at Houston |