
|
|||||
|
 | |
| |
| |
| |
| |
| |
|
Gene: CTNS |
Gene summary for CTNS |
| Gene information | Species | Human | Gene symbol | CTNS | Gene ID | 1497 |
| Gene name | cystinosin, lysosomal cystine transporter | |
| Gene Alias | CTNS-LSB | |
| Cytomap | 17p13.2 | |
| Gene Type | protein-coding | GO ID | GO:0000101 | UniProtAcc | A0A0S2Z3I9 |
Top |
Malignant transformation analysis |
| Identification of the aberrant gene expression in precancerous and cancerous lesions by comparing the gene expression of stem-like cells in diseased tissues with normal stem cells |
| Entrez ID | Symbol | Replicates | Species | Organ | Tissue | Adj P-value | Log2FC | Malignancy |
| 1497 | CTNS | LZE24T | Human | Esophagus | ESCC | 4.32e-05 | 2.08e-01 | 0.0596 |
| 1497 | CTNS | P2T-E | Human | Esophagus | ESCC | 1.69e-06 | 1.14e-01 | 0.1177 |
| 1497 | CTNS | P4T-E | Human | Esophagus | ESCC | 1.79e-04 | 1.79e-01 | 0.1323 |
| 1497 | CTNS | P9T-E | Human | Esophagus | ESCC | 1.84e-06 | 1.65e-01 | 0.1131 |
| 1497 | CTNS | P10T-E | Human | Esophagus | ESCC | 3.24e-06 | 9.75e-02 | 0.116 |
| 1497 | CTNS | P11T-E | Human | Esophagus | ESCC | 5.11e-03 | 1.75e-01 | 0.1426 |
| 1497 | CTNS | P12T-E | Human | Esophagus | ESCC | 3.74e-05 | 1.53e-01 | 0.1122 |
| 1497 | CTNS | P15T-E | Human | Esophagus | ESCC | 1.46e-02 | 8.75e-02 | 0.1149 |
| 1497 | CTNS | P16T-E | Human | Esophagus | ESCC | 8.19e-10 | 1.91e-01 | 0.1153 |
| 1497 | CTNS | P21T-E | Human | Esophagus | ESCC | 8.70e-10 | 1.92e-01 | 0.1617 |
| 1497 | CTNS | P22T-E | Human | Esophagus | ESCC | 2.89e-06 | 8.47e-02 | 0.1236 |
| 1497 | CTNS | P23T-E | Human | Esophagus | ESCC | 1.38e-06 | 1.89e-01 | 0.108 |
| 1497 | CTNS | P24T-E | Human | Esophagus | ESCC | 3.61e-05 | 1.32e-01 | 0.1287 |
| 1497 | CTNS | P26T-E | Human | Esophagus | ESCC | 7.08e-07 | 8.26e-02 | 0.1276 |
| 1497 | CTNS | P31T-E | Human | Esophagus | ESCC | 1.91e-09 | 1.44e-01 | 0.1251 |
| 1497 | CTNS | P32T-E | Human | Esophagus | ESCC | 2.16e-06 | 1.40e-01 | 0.1666 |
| 1497 | CTNS | P36T-E | Human | Esophagus | ESCC | 9.60e-09 | 2.57e-01 | 0.1187 |
| 1497 | CTNS | P37T-E | Human | Esophagus | ESCC | 2.22e-06 | 1.21e-01 | 0.1371 |
| 1497 | CTNS | P39T-E | Human | Esophagus | ESCC | 8.40e-03 | 9.37e-02 | 0.0894 |
| 1497 | CTNS | P42T-E | Human | Esophagus | ESCC | 4.47e-05 | 1.68e-01 | 0.1175 |
| Page: 1 2 3 |
| Tissue | Expression Dynamics | Abbreviation |
| Esophagus |  | ESCC: Esophageal squamous cell carcinoma |
| HGIN: High-grade intraepithelial neoplasias | ||
| LGIN: Low-grade intraepithelial neoplasias | ||
| Liver | 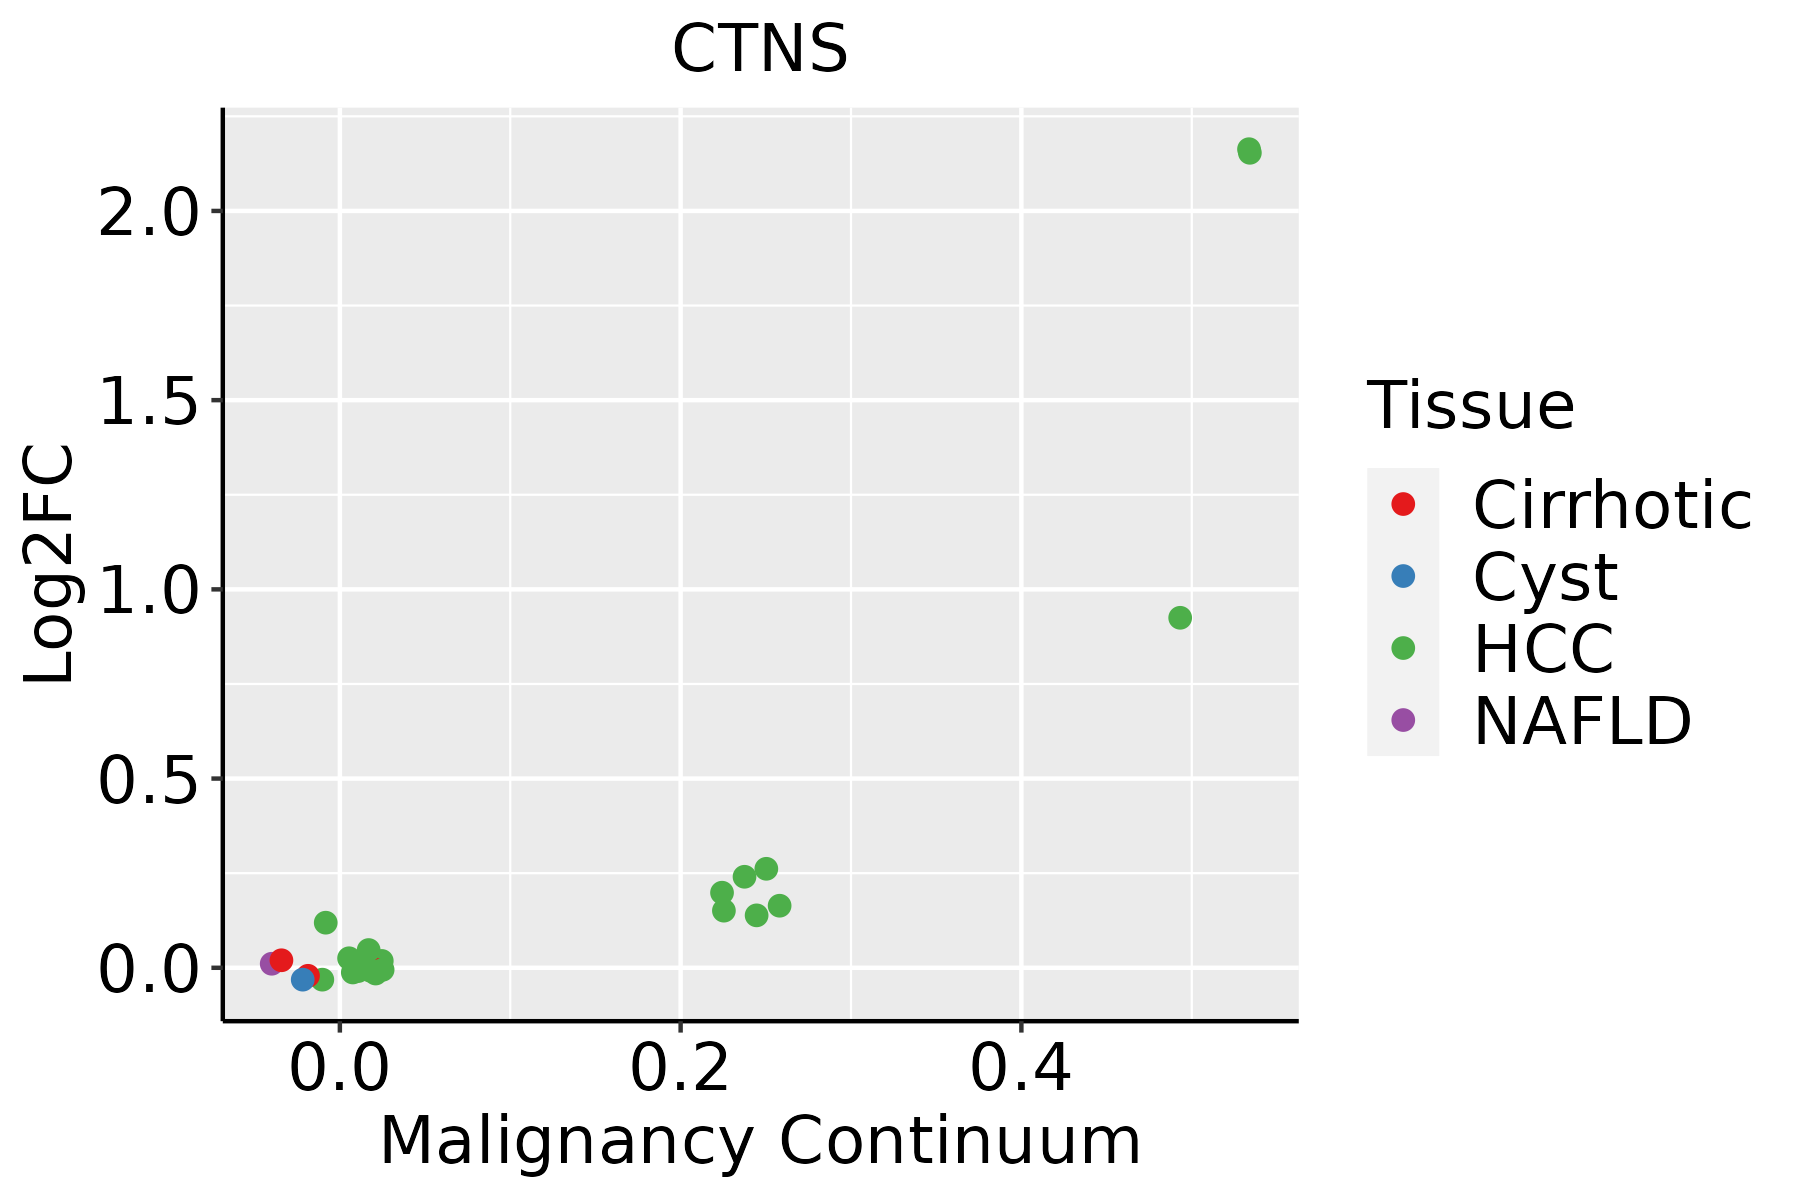 | HCC: Hepatocellular carcinoma |
| NAFLD: Non-alcoholic fatty liver disease |
| ∗log2FC in expression of this searched gene in stem-like cells from each diseased tissue sample relative to stem-like cells in normal samples in each tissue plotted against the malignancy continuum. Samples are colored based on if they are from different disease stage. |
Top |
Malignant transformation related pathway analysis |
| Find out the enriched GO biological processes and KEGG pathways involved in transition from healthy to precancer to cancer |
| Tissue | Disease Stage | Enriched GO biological Processes |
| Colorectum | AD |  |
| Colorectum | SER |  |
| Colorectum | MSS |  |
| Colorectum | MSI-H |  |
| Colorectum | FAP |  |
| ∗Top 15 enriched GO BP terms are showed in the bar plot of each disease state in each tissue. Each row represents a significant GO biological process which is colored according to the -log10(p.adjust). |
| Page: 1 2 3 4 5 6 7 8 9 |
| GO ID | Tissue | Disease Stage | Description | Gene Ratio | Bg Ratio | pvalue | p.adjust | Count |
| GO:0046034111 | Esophagus | ESCC | ATP metabolic process | 189/8552 | 277/18723 | 1.99e-14 | 1.04e-12 | 189 |
| GO:000931419 | Esophagus | ESCC | response to radiation | 277/8552 | 456/18723 | 4.42e-11 | 1.43e-09 | 277 |
| GO:00067906 | Esophagus | ESCC | sulfur compound metabolic process | 201/8552 | 339/18723 | 2.64e-07 | 3.94e-06 | 201 |
| GO:200037718 | Esophagus | ESCC | regulation of reactive oxygen species metabolic process | 100/8552 | 157/18723 | 3.87e-06 | 4.17e-05 | 100 |
| GO:000941611 | Esophagus | ESCC | response to light stimulus | 183/8552 | 320/18723 | 2.03e-05 | 1.76e-04 | 183 |
| GO:005188110 | Esophagus | ESCC | regulation of mitochondrial membrane potential | 51/8552 | 74/18723 | 4.42e-05 | 3.51e-04 | 51 |
| GO:00065757 | Esophagus | ESCC | cellular modified amino acid metabolic process | 112/8552 | 188/18723 | 8.31e-05 | 6.06e-04 | 112 |
| GO:00319294 | Esophagus | ESCC | TOR signaling | 79/8552 | 126/18723 | 8.57e-05 | 6.21e-04 | 79 |
| GO:007259318 | Esophagus | ESCC | reactive oxygen species metabolic process | 137/8552 | 239/18723 | 1.82e-04 | 1.16e-03 | 137 |
| GO:000674912 | Esophagus | ESCC | glutathione metabolic process | 42/8552 | 64/18723 | 1.01e-03 | 5.12e-03 | 42 |
| GO:00320061 | Esophagus | ESCC | regulation of TOR signaling | 63/8552 | 104/18723 | 1.55e-03 | 7.29e-03 | 63 |
| GO:00461482 | Esophagus | ESCC | pigment biosynthetic process | 40/8552 | 62/18723 | 2.14e-03 | 9.54e-03 | 40 |
| GO:0010918 | Esophagus | ESCC | positive regulation of mitochondrial membrane potential | 10/8552 | 11/18723 | 2.54e-03 | 1.08e-02 | 10 |
| GO:20003783 | Esophagus | ESCC | negative regulation of reactive oxygen species metabolic process | 34/8552 | 52/18723 | 3.26e-03 | 1.35e-02 | 34 |
| GO:00320082 | Esophagus | ESCC | positive regulation of TOR signaling | 31/8552 | 47/18723 | 4.01e-03 | 1.62e-02 | 31 |
| GO:00458381 | Esophagus | ESCC | positive regulation of membrane potential | 13/8552 | 16/18723 | 4.05e-03 | 1.62e-02 | 13 |
| GO:190260018 | Esophagus | ESCC | proton transmembrane transport | 88/8552 | 157/18723 | 5.62e-03 | 2.10e-02 | 88 |
| GO:19016174 | Esophagus | ESCC | organic hydroxy compound biosynthetic process | 128/8552 | 237/18723 | 5.86e-03 | 2.16e-02 | 128 |
| GO:00424401 | Esophagus | ESCC | pigment metabolic process | 50/8552 | 84/18723 | 7.34e-03 | 2.64e-02 | 50 |
| GO:00103101 | Esophagus | ESCC | regulation of hydrogen peroxide metabolic process | 16/8552 | 22/18723 | 9.46e-03 | 3.28e-02 | 16 |
| Page: 1 2 |
| Pathway ID | Tissue | Disease Stage | Description | Gene Ratio | Bg Ratio | pvalue | p.adjust | qvalue | Count |
| hsa0414222 | Esophagus | ESCC | Lysosome | 102/4205 | 132/8465 | 5.11e-11 | 7.13e-10 | 3.65e-10 | 102 |
| hsa0414232 | Esophagus | ESCC | Lysosome | 102/4205 | 132/8465 | 5.11e-11 | 7.13e-10 | 3.65e-10 | 102 |
| hsa041422 | Liver | HCC | Lysosome | 100/4020 | 132/8465 | 2.32e-11 | 4.31e-10 | 2.40e-10 | 100 |
| hsa041423 | Liver | HCC | Lysosome | 100/4020 | 132/8465 | 2.32e-11 | 4.31e-10 | 2.40e-10 | 100 |
| Page: 1 |
Top |
Cell-cell communication analysis |
| Identification of potential cell-cell interactions between two cell types and their ligand-receptor pairs for different disease states |
| Ligand | Receptor | LRpair | Pathway | Tissue | Disease Stage |
| Page: 1 |
Top |
Single-cell gene regulatory network inference analysis |
| Find out the significant the regulons (TFs) and the target genes of each regulon across cell types for different disease states |
| TF | Cell Type | Tissue | Disease Stage | Target Gene | RSS | Regulon Activity |
| ∗The dot plots of a searched regulon are shown for all cell subpopulations in each disease state of each tissue based on the regulon specific score inferred using pySCENIC and by calculating the average expression. |
| Page: 1 |
Top |
Somatic mutation of malignant transformation related genes |
| Annotation of somatic variants for genes involved in malignant transformation |
| Hugo Symbol | Variant Class | Variant Classification | dbSNP RS | HGVSc | HGVSp | HGVSp Short | SWISSPROT | BIOTYPE | SIFT | PolyPhen | Tumor Sample Barcode | Tissue | Histology | Sex | Age | Stage | Therapy Types | Drugs | Outcome |
| CTNS | SNV | Missense_Mutation | novel | c.292N>T | p.Thr98Ser | p.T98S | O60931 | protein_coding | tolerated(0.11) | possibly_damaging(0.843) | TCGA-AN-A0FF-01 | Breast | breast invasive carcinoma | Female | <65 | I/II | Unknown | Unknown | SD |
| CTNS | insertion | Frame_Shift_Ins | novel | c.827_828insAATTTTATTCGATGATTCCATTCGAATCCATTCGATGATGAGTC | p.Thr277IlefsTer26 | p.T277Ifs*26 | O60931 | protein_coding | TCGA-AO-A0JB-01 | Breast | breast invasive carcinoma | Female | <65 | III/IV | Chemotherapy | cyclophosphamide | SD | ||
| CTNS | SNV | Missense_Mutation | novel | c.583N>T | p.Pro195Ser | p.P195S | O60931 | protein_coding | deleterious(0) | probably_damaging(0.988) | TCGA-2W-A8YY-01 | Cervix | cervical & endocervical cancer | Female | <65 | I/II | Chemotherapy | cisplatin | CR |
| CTNS | SNV | Missense_Mutation | novel | c.535N>T | p.Gly179Cys | p.G179C | O60931 | protein_coding | deleterious(0.02) | probably_damaging(0.957) | TCGA-VS-A94Z-01 | Cervix | cervical & endocervical cancer | Female | <65 | I/II | Chemotherapy | cisplatin | CR |
| CTNS | SNV | Missense_Mutation | rs374075160 | c.715N>A | p.Gly239Ser | p.G239S | O60931 | protein_coding | tolerated(0.46) | benign(0.015) | TCGA-AA-3527-01 | Colorectum | colon adenocarcinoma | Female | >=65 | I/II | Unknown | Unknown | SD |
| CTNS | SNV | Missense_Mutation | rs559362332 | c.341N>A | p.Arg114His | p.R114H | O60931 | protein_coding | tolerated(0.06) | benign(0.005) | TCGA-AA-3713-01 | Colorectum | colon adenocarcinoma | Male | >=65 | III/IV | Chemotherapy | 5-fluorouracil | PR |
| CTNS | SNV | Missense_Mutation | rs555311279 | c.187N>T | p.Arg63Cys | p.R63C | O60931 | protein_coding | tolerated(0.08) | benign(0.34) | TCGA-AA-A00N-01 | Colorectum | colon adenocarcinoma | Male | >=65 | I/II | Unknown | Unknown | PD |
| CTNS | SNV | Missense_Mutation | novel | c.394N>C | p.Trp132Arg | p.W132R | O60931 | protein_coding | deleterious(0) | probably_damaging(1) | TCGA-AY-4071-01 | Colorectum | colon adenocarcinoma | Female | <65 | I/II | Unknown | Unknown | SD |
| CTNS | SNV | Missense_Mutation | c.1190G>A | p.Ser397Asn | p.S397N | O60931 | protein_coding | tolerated_low_confidence(0.26) | benign(0.006) | TCGA-CK-4951-01 | Colorectum | colon adenocarcinoma | Female | >=65 | I/II | Unknown | Unknown | PD | |
| CTNS | SNV | Missense_Mutation | rs776658046 | c.635N>T | p.Ala212Val | p.A212V | O60931 | protein_coding | deleterious(0) | probably_damaging(0.995) | TCGA-G4-6302-01 | Colorectum | colon adenocarcinoma | Female | >=65 | I/II | Unknown | Unknown | SD |
| Page: 1 2 3 4 |
Top |
Related drugs of malignant transformation related genes |
| Identification of chemicals and drugs interact with genes involved in malignant transfromation |
| (DGIdb 4.0) |
| Entrez ID | Symbol | Category | Interaction Types | Drug Claim Name | Drug Name | PMIDs |
| Page: 1 |

Copyright 2023-Present -The University of Texas Health Science Center at Houston |