
|
|||||
|
 | |
| |
| |
| |
| |
| |
|
Gene: CTNND2 |
Gene summary for CTNND2 |
| Gene information | Species | Human | Gene symbol | CTNND2 | Gene ID | 1501 |
| Gene name | catenin delta 2 | |
| Gene Alias | GT24 | |
| Cytomap | 5p15.2 | |
| Gene Type | protein-coding | GO ID | GO:0000902 | UniProtAcc | E7EPC8 |
Top |
Malignant transformation analysis |
| Identification of the aberrant gene expression in precancerous and cancerous lesions by comparing the gene expression of stem-like cells in diseased tissues with normal stem cells |
| Entrez ID | Symbol | Replicates | Species | Organ | Tissue | Adj P-value | Log2FC | Malignancy |
| 1501 | CTNND2 | HTA12-16-5 | Human | Pancreas | PDAC | 1.94e-02 | 5.85e-01 | 0.047 |
| 1501 | CTNND2 | HTA12-23-1 | Human | Pancreas | PDAC | 2.89e-11 | 1.17e+00 | 0.3405 |
| 1501 | CTNND2 | HTA12-25-1 | Human | Pancreas | PDAC | 8.73e-04 | 6.47e-01 | 0.313 |
| 1501 | CTNND2 | HTA12-26-1 | Human | Pancreas | PDAC | 9.82e-11 | 7.66e-01 | 0.3728 |
| 1501 | CTNND2 | HTA12-29-1 | Human | Pancreas | PDAC | 5.71e-55 | 1.18e+00 | 0.3722 |
| 1501 | CTNND2 | HTA12-32-1 | Human | Pancreas | PDAC | 5.30e-06 | 1.32e+00 | 0.3624 |
| 1501 | CTNND2 | P1_S1_AK | Human | Skin | AK | 8.79e-12 | 3.71e-01 | -0.3399 |
| 1501 | CTNND2 | P2_S3_AK | Human | Skin | AK | 7.41e-14 | 4.34e-01 | -0.3287 |
| 1501 | CTNND2 | P2_S4_SCCIS | Human | Skin | SCCIS | 4.43e-05 | 2.47e-01 | -0.3043 |
| 1501 | CTNND2 | P3_S6_AK | Human | Skin | AK | 2.08e-05 | 2.58e-01 | -0.3256 |
| Page: 1 |
| Tissue | Expression Dynamics | Abbreviation |
| Skin | 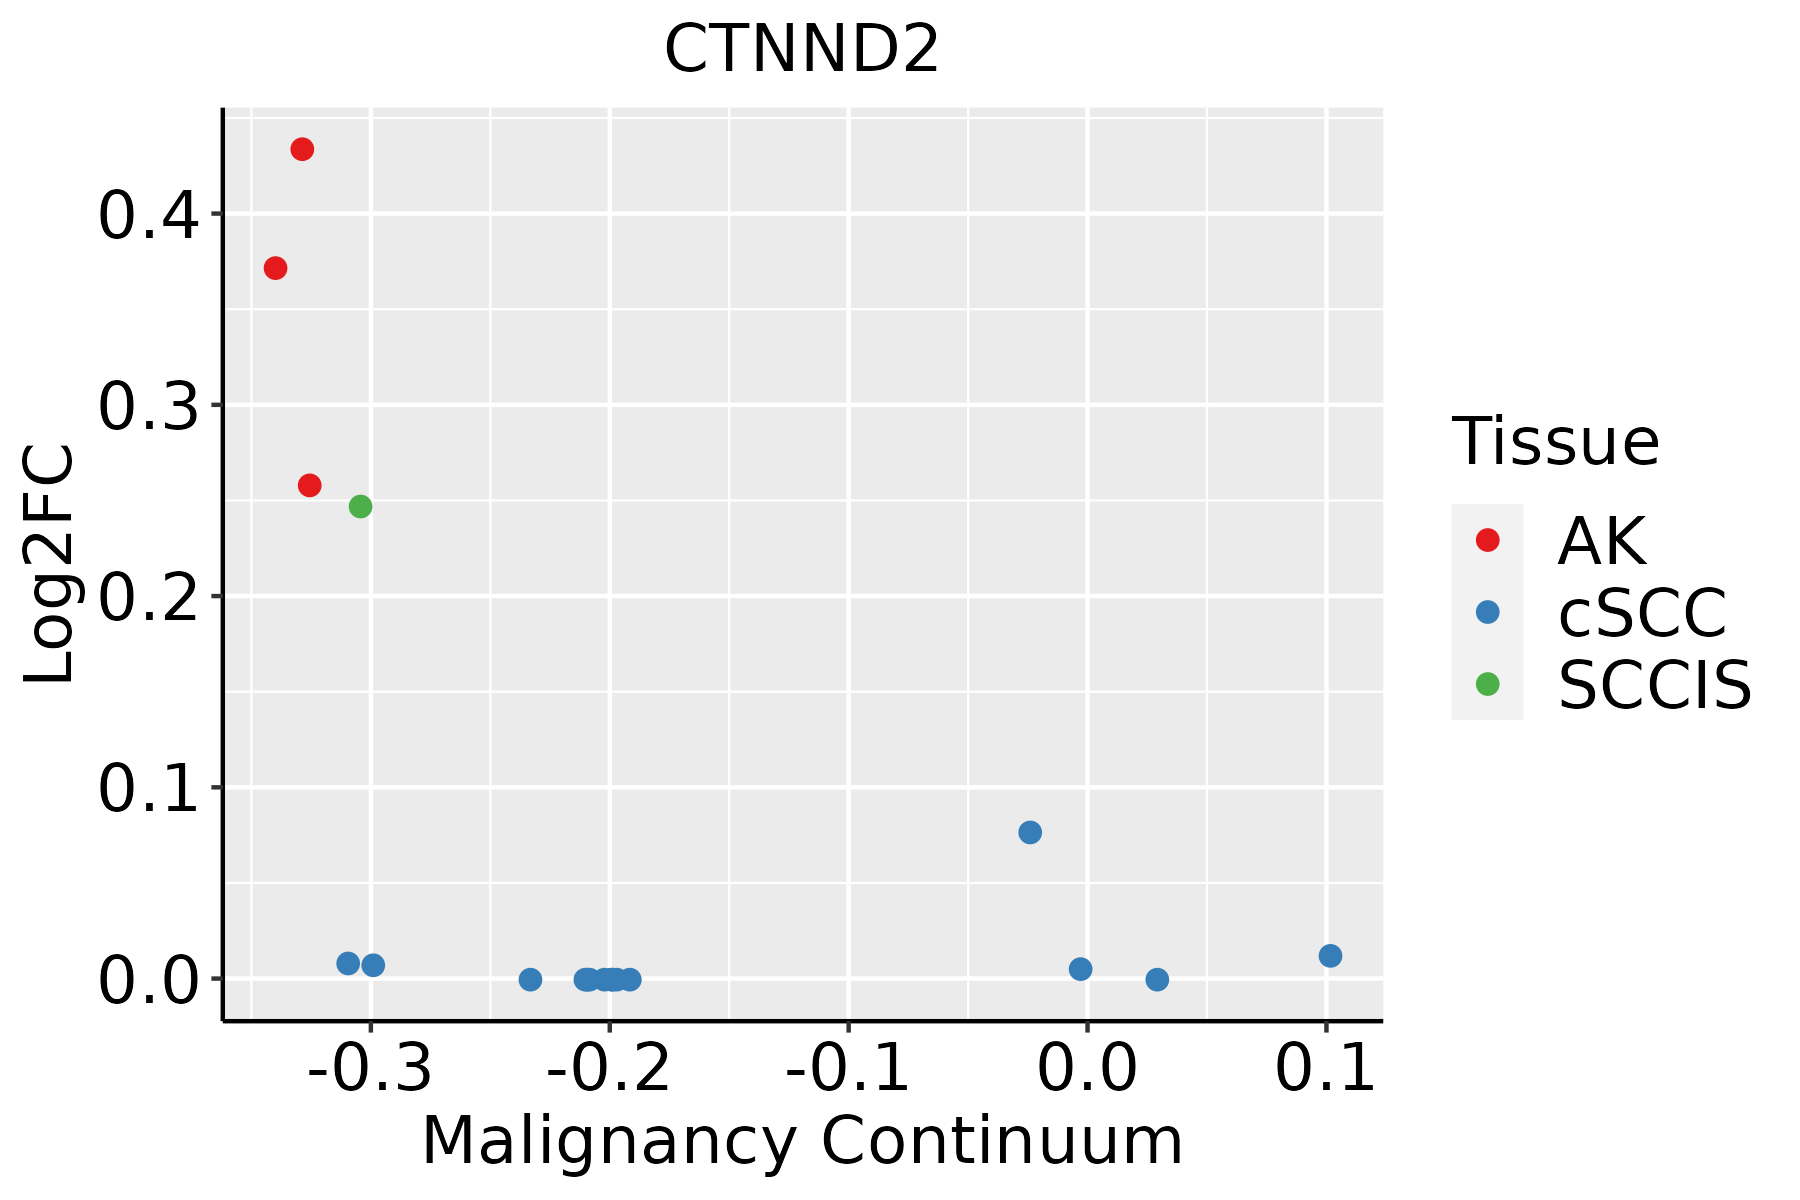 | AK: Actinic keratosis |
| cSCC: Cutaneous squamous cell carcinoma | ||
| SCCIS:squamous cell carcinoma in situ |
| ∗log2FC in expression of this searched gene in stem-like cells from each diseased tissue sample relative to stem-like cells in normal samples in each tissue plotted against the malignancy continuum. Samples are colored based on if they are from different disease stage. |
Top |
Malignant transformation related pathway analysis |
| Find out the enriched GO biological processes and KEGG pathways involved in transition from healthy to precancer to cancer |
| Tissue | Disease Stage | Enriched GO biological Processes |
| Colorectum | AD |  |
| Colorectum | SER |  |
| Colorectum | MSS |  |
| Colorectum | MSI-H |  |
| Colorectum | FAP |  |
| ∗Top 15 enriched GO BP terms are showed in the bar plot of each disease state in each tissue. Each row represents a significant GO biological process which is colored according to the -log10(p.adjust). |
| Page: 1 2 3 4 5 6 7 8 9 |
| GO ID | Tissue | Disease Stage | Description | Gene Ratio | Bg Ratio | pvalue | p.adjust | Count |
| GO:001605518 | Skin | AK | Wnt signaling pathway | 98/1910 | 444/18723 | 9.39e-14 | 3.09e-11 | 98 |
| GO:019873818 | Skin | AK | cell-cell signaling by wnt | 98/1910 | 446/18723 | 1.26e-13 | 3.72e-11 | 98 |
| GO:003011118 | Skin | AK | regulation of Wnt signaling pathway | 73/1910 | 328/18723 | 9.27e-11 | 1.52e-08 | 73 |
| GO:003432919 | Skin | AK | cell junction assembly | 86/1910 | 420/18723 | 1.95e-10 | 2.68e-08 | 86 |
| GO:004521626 | Skin | AK | cell-cell junction organization | 51/1910 | 200/18723 | 4.51e-10 | 5.24e-08 | 51 |
| GO:006007017 | Skin | AK | canonical Wnt signaling pathway | 67/1910 | 303/18723 | 7.30e-10 | 7.45e-08 | 67 |
| GO:006082818 | Skin | AK | regulation of canonical Wnt signaling pathway | 57/1910 | 253/18723 | 6.57e-09 | 4.47e-07 | 57 |
| GO:000704319 | Skin | AK | cell-cell junction assembly | 36/1910 | 146/18723 | 3.88e-07 | 1.47e-05 | 36 |
| GO:00609968 | Skin | AK | dendritic spine development | 27/1910 | 99/18723 | 1.34e-06 | 4.15e-05 | 27 |
| GO:001635817 | Skin | AK | dendrite development | 49/1910 | 243/18723 | 2.42e-06 | 6.72e-05 | 49 |
| GO:00508088 | Skin | AK | synapse organization | 71/1910 | 426/18723 | 2.21e-05 | 4.07e-04 | 71 |
| GO:010602710 | Skin | AK | neuron projection organization | 23/1910 | 93/18723 | 4.44e-05 | 7.03e-04 | 23 |
| GO:00970619 | Skin | AK | dendritic spine organization | 21/1910 | 84/18723 | 7.93e-05 | 1.09e-03 | 21 |
| GO:00609975 | Skin | AK | dendritic spine morphogenesis | 17/1910 | 61/18723 | 8.79e-05 | 1.20e-03 | 17 |
| GO:00488138 | Skin | AK | dendrite morphogenesis | 30/1910 | 146/18723 | 1.44e-04 | 1.73e-03 | 30 |
| GO:00991737 | Skin | AK | postsynapse organization | 32/1910 | 168/18723 | 3.77e-04 | 3.65e-03 | 32 |
| GO:0034329110 | Skin | SCCIS | cell junction assembly | 52/919 | 420/18723 | 7.89e-10 | 5.23e-07 | 52 |
| GO:001635818 | Skin | SCCIS | dendrite development | 36/919 | 243/18723 | 3.00e-09 | 1.45e-06 | 36 |
| GO:001605519 | Skin | SCCIS | Wnt signaling pathway | 51/919 | 444/18723 | 1.48e-08 | 4.37e-06 | 51 |
| GO:019873819 | Skin | SCCIS | cell-cell signaling by wnt | 51/919 | 446/18723 | 1.72e-08 | 4.81e-06 | 51 |
| Page: 1 2 |
| Pathway ID | Tissue | Disease Stage | Description | Gene Ratio | Bg Ratio | pvalue | p.adjust | qvalue | Count |
| Page: 1 |
Top |
Cell-cell communication analysis |
| Identification of potential cell-cell interactions between two cell types and their ligand-receptor pairs for different disease states |
| Ligand | Receptor | LRpair | Pathway | Tissue | Disease Stage |
| Page: 1 |
Top |
Single-cell gene regulatory network inference analysis |
| Find out the significant the regulons (TFs) and the target genes of each regulon across cell types for different disease states |
| TF | Cell Type | Tissue | Disease Stage | Target Gene | RSS | Regulon Activity |
| ∗The dot plots of a searched regulon are shown for all cell subpopulations in each disease state of each tissue based on the regulon specific score inferred using pySCENIC and by calculating the average expression. |
| Page: 1 |
Top |
Somatic mutation of malignant transformation related genes |
| Annotation of somatic variants for genes involved in malignant transformation |
| Hugo Symbol | Variant Class | Variant Classification | dbSNP RS | HGVSc | HGVSp | HGVSp Short | SWISSPROT | BIOTYPE | SIFT | PolyPhen | Tumor Sample Barcode | Tissue | Histology | Sex | Age | Stage | Therapy Types | Drugs | Outcome |
| CTNND2 | SNV | Missense_Mutation | novel | c.301N>G | p.Gln101Glu | p.Q101E | Q9UQB3 | protein_coding | deleterious(0.02) | benign(0.015) | TCGA-5L-AAT1-01 | Breast | breast invasive carcinoma | Female | <65 | III/IV | Hormone Therapy | letrozol | SD |
| CTNND2 | SNV | Missense_Mutation | novel | c.2068N>T | p.His690Tyr | p.H690Y | Q9UQB3 | protein_coding | tolerated(0.05) | benign(0.265) | TCGA-A2-A0CT-01 | Breast | breast invasive carcinoma | Female | >=65 | I/II | Chemotherapy | cytoxan | SD |
| CTNND2 | SNV | Missense_Mutation | c.1515N>T | p.Gln505His | p.Q505H | Q9UQB3 | protein_coding | tolerated(0.08) | benign(0.001) | TCGA-A8-A08T-01 | Breast | breast invasive carcinoma | Female | <65 | III/IV | Unknown | Unknown | PD | |
| CTNND2 | SNV | Missense_Mutation | c.2885C>G | p.Ala962Gly | p.A962G | Q9UQB3 | protein_coding | deleterious(0) | probably_damaging(0.97) | TCGA-AN-A0AK-01 | Breast | breast invasive carcinoma | Female | >=65 | I/II | Unknown | Unknown | SD | |
| CTNND2 | SNV | Missense_Mutation | c.2891G>A | p.Cys964Tyr | p.C964Y | Q9UQB3 | protein_coding | deleterious(0) | probably_damaging(0.982) | TCGA-AR-A0TY-01 | Breast | breast invasive carcinoma | Female | <65 | I/II | Unspecific | Paclitaxel | PD | |
| CTNND2 | SNV | Missense_Mutation | c.2176G>C | p.Gly726Arg | p.G726R | Q9UQB3 | protein_coding | tolerated(0.11) | probably_damaging(0.996) | TCGA-BH-A0BZ-01 | Breast | breast invasive carcinoma | Female | <65 | III/IV | Chemotherapy | doxorubicin | CR | |
| CTNND2 | SNV | Missense_Mutation | rs772102141 | c.2953N>A | p.Gly985Ser | p.G985S | Q9UQB3 | protein_coding | deleterious(0.02) | probably_damaging(0.994) | TCGA-BH-A18T-01 | Breast | breast invasive carcinoma | Female | >=65 | I/II | Unknown | Unknown | PD |
| CTNND2 | SNV | Missense_Mutation | c.3064N>G | p.Leu1022Val | p.L1022V | Q9UQB3 | protein_coding | deleterious(0) | benign(0.021) | TCGA-E2-A10C-01 | Breast | breast invasive carcinoma | Female | <65 | I/II | Chemotherapy | cytoxan | SD | |
| CTNND2 | SNV | Missense_Mutation | c.1486N>C | p.Ala496Pro | p.A496P | Q9UQB3 | protein_coding | deleterious(0.01) | benign(0.001) | TCGA-E2-A14X-01 | Breast | breast invasive carcinoma | Female | <65 | III/IV | Chemotherapy | doxorubicin | SD | |
| CTNND2 | SNV | Missense_Mutation | novel | c.2729N>T | p.Cys910Phe | p.C910F | Q9UQB3 | protein_coding | deleterious(0.01) | probably_damaging(0.996) | TCGA-E9-A1RH-01 | Breast | breast invasive carcinoma | Female | <65 | I/II | Chemotherapy | 5-fluorouracil | SD |
| Page: 1 2 3 4 5 6 7 8 9 10 11 12 13 14 15 16 17 18 19 20 21 22 23 24 25 26 27 28 29 30 |
Top |
Related drugs of malignant transformation related genes |
| Identification of chemicals and drugs interact with genes involved in malignant transfromation |
| (DGIdb 4.0) |
| Entrez ID | Symbol | Category | Interaction Types | Drug Claim Name | Drug Name | PMIDs |
| Page: 1 |

Copyright 2023-Present -The University of Texas Health Science Center at Houston |