
|
|||||
|
 | |
| |
| |
| |
| |
| |
|
Gene: CTNNBL1 |
Gene summary for CTNNBL1 |
| Gene information | Species | Human | Gene symbol | CTNNBL1 | Gene ID | 56259 |
| Gene name | catenin beta like 1 | |
| Gene Alias | C20orf33 | |
| Cytomap | 20q11.23 | |
| Gene Type | protein-coding | GO ID | GO:0002200 | UniProtAcc | Q8WYA6 |
Top |
Malignant transformation analysis |
| Identification of the aberrant gene expression in precancerous and cancerous lesions by comparing the gene expression of stem-like cells in diseased tissues with normal stem cells |
| Entrez ID | Symbol | Replicates | Species | Organ | Tissue | Adj P-value | Log2FC | Malignancy |
| 56259 | CTNNBL1 | LZE4T | Human | Esophagus | ESCC | 8.34e-12 | 4.11e-01 | 0.0811 |
| 56259 | CTNNBL1 | LZE7T | Human | Esophagus | ESCC | 2.43e-08 | 3.91e-01 | 0.0667 |
| 56259 | CTNNBL1 | LZE8T | Human | Esophagus | ESCC | 6.03e-04 | 1.12e-01 | 0.067 |
| 56259 | CTNNBL1 | LZE24T | Human | Esophagus | ESCC | 2.40e-34 | 9.17e-01 | 0.0596 |
| 56259 | CTNNBL1 | LZE21T | Human | Esophagus | ESCC | 7.41e-04 | 1.99e-01 | 0.0655 |
| 56259 | CTNNBL1 | LZE6T | Human | Esophagus | ESCC | 2.02e-04 | 2.85e-01 | 0.0845 |
| 56259 | CTNNBL1 | P1T-E | Human | Esophagus | ESCC | 2.74e-08 | 4.70e-01 | 0.0875 |
| 56259 | CTNNBL1 | P2T-E | Human | Esophagus | ESCC | 3.94e-20 | 4.17e-01 | 0.1177 |
| 56259 | CTNNBL1 | P4T-E | Human | Esophagus | ESCC | 2.50e-22 | 5.10e-01 | 0.1323 |
| 56259 | CTNNBL1 | P5T-E | Human | Esophagus | ESCC | 4.38e-12 | 2.53e-01 | 0.1327 |
| 56259 | CTNNBL1 | P8T-E | Human | Esophagus | ESCC | 1.79e-36 | 7.00e-01 | 0.0889 |
| 56259 | CTNNBL1 | P9T-E | Human | Esophagus | ESCC | 8.11e-11 | 2.17e-01 | 0.1131 |
| 56259 | CTNNBL1 | P10T-E | Human | Esophagus | ESCC | 1.25e-23 | 4.40e-01 | 0.116 |
| 56259 | CTNNBL1 | P11T-E | Human | Esophagus | ESCC | 9.80e-12 | 5.18e-01 | 0.1426 |
| 56259 | CTNNBL1 | P12T-E | Human | Esophagus | ESCC | 8.82e-38 | 7.14e-01 | 0.1122 |
| 56259 | CTNNBL1 | P15T-E | Human | Esophagus | ESCC | 2.90e-26 | 5.62e-01 | 0.1149 |
| 56259 | CTNNBL1 | P16T-E | Human | Esophagus | ESCC | 2.72e-41 | 7.46e-01 | 0.1153 |
| 56259 | CTNNBL1 | P17T-E | Human | Esophagus | ESCC | 4.90e-15 | 5.90e-01 | 0.1278 |
| 56259 | CTNNBL1 | P19T-E | Human | Esophagus | ESCC | 3.98e-09 | 7.58e-01 | 0.1662 |
| 56259 | CTNNBL1 | P20T-E | Human | Esophagus | ESCC | 3.40e-29 | 6.51e-01 | 0.1124 |
| Page: 1 2 3 4 5 6 |
| Tissue | Expression Dynamics | Abbreviation |
| Esophagus | 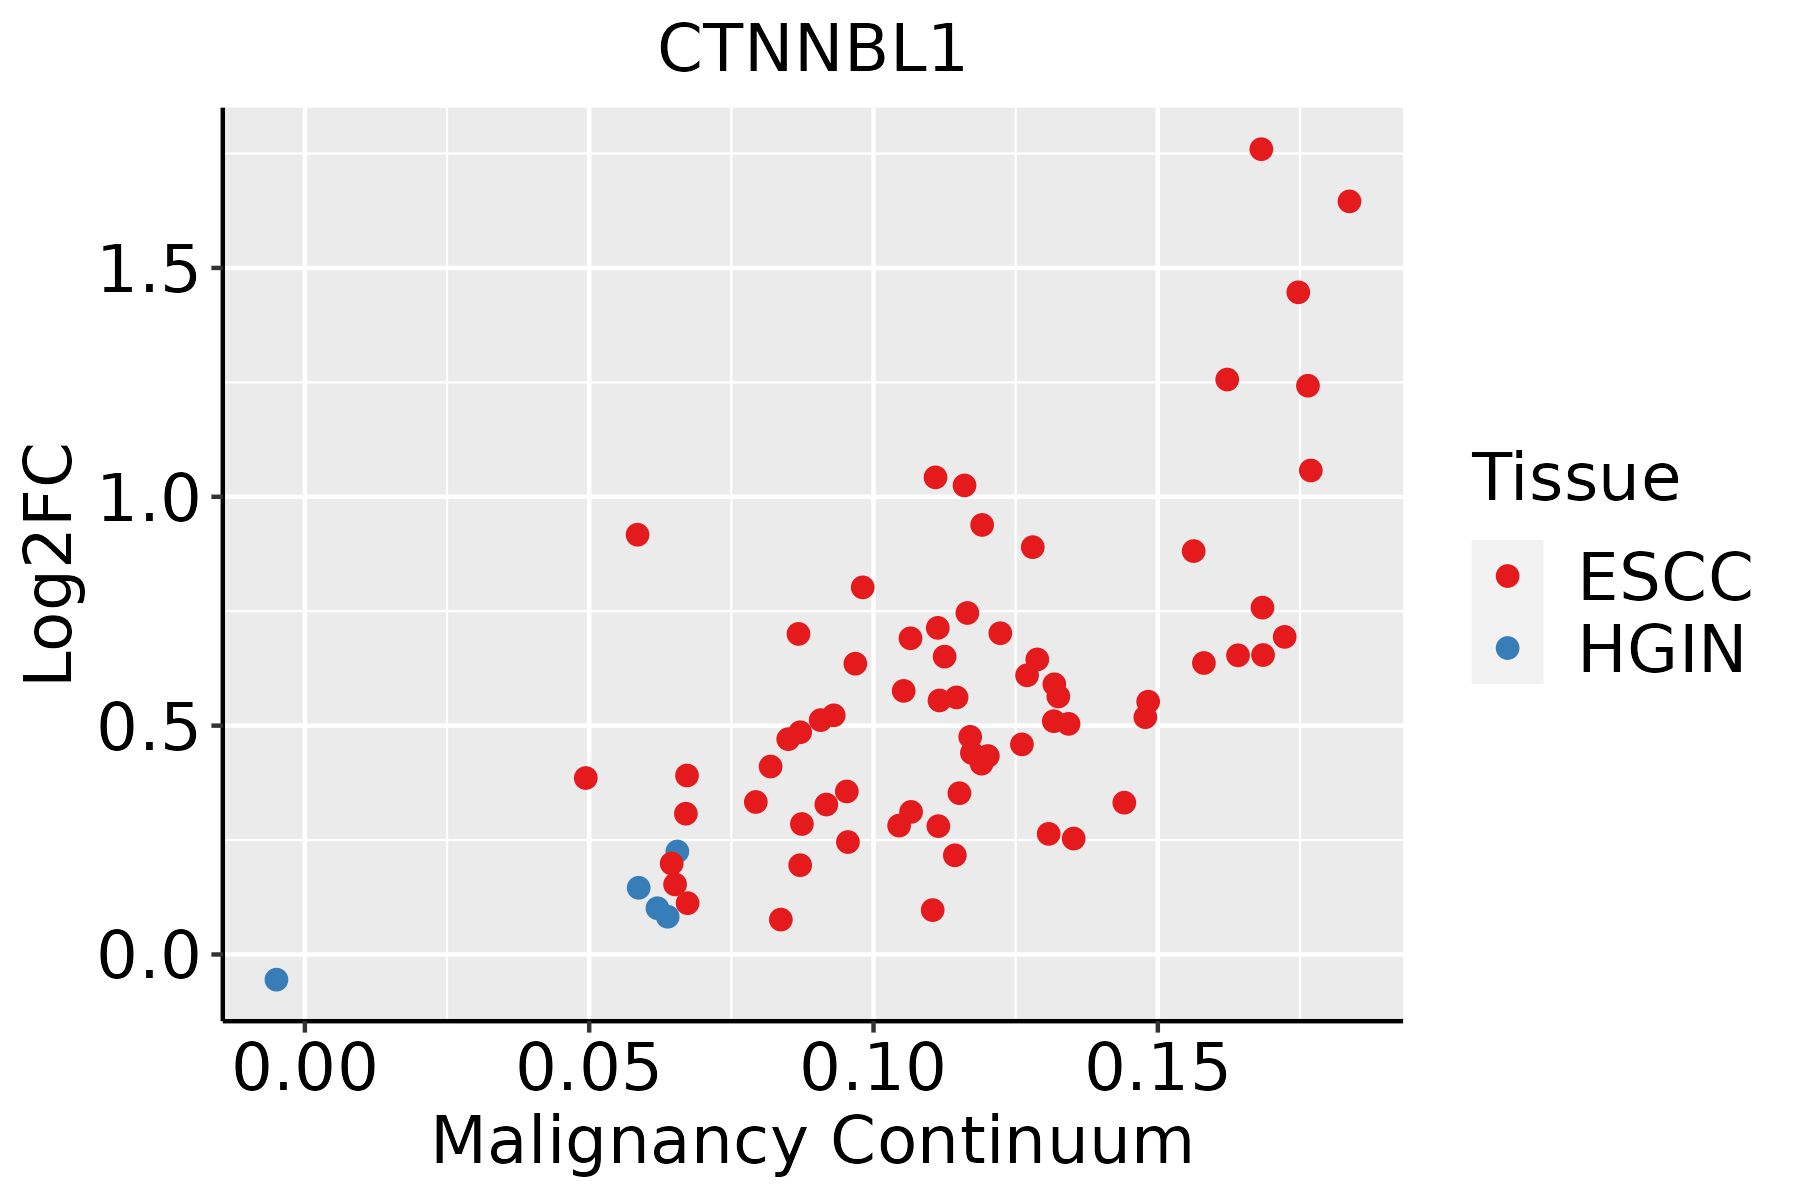 | ESCC: Esophageal squamous cell carcinoma |
| HGIN: High-grade intraepithelial neoplasias | ||
| LGIN: Low-grade intraepithelial neoplasias | ||
| Liver |  | HCC: Hepatocellular carcinoma |
| NAFLD: Non-alcoholic fatty liver disease | ||
| Oral Cavity | 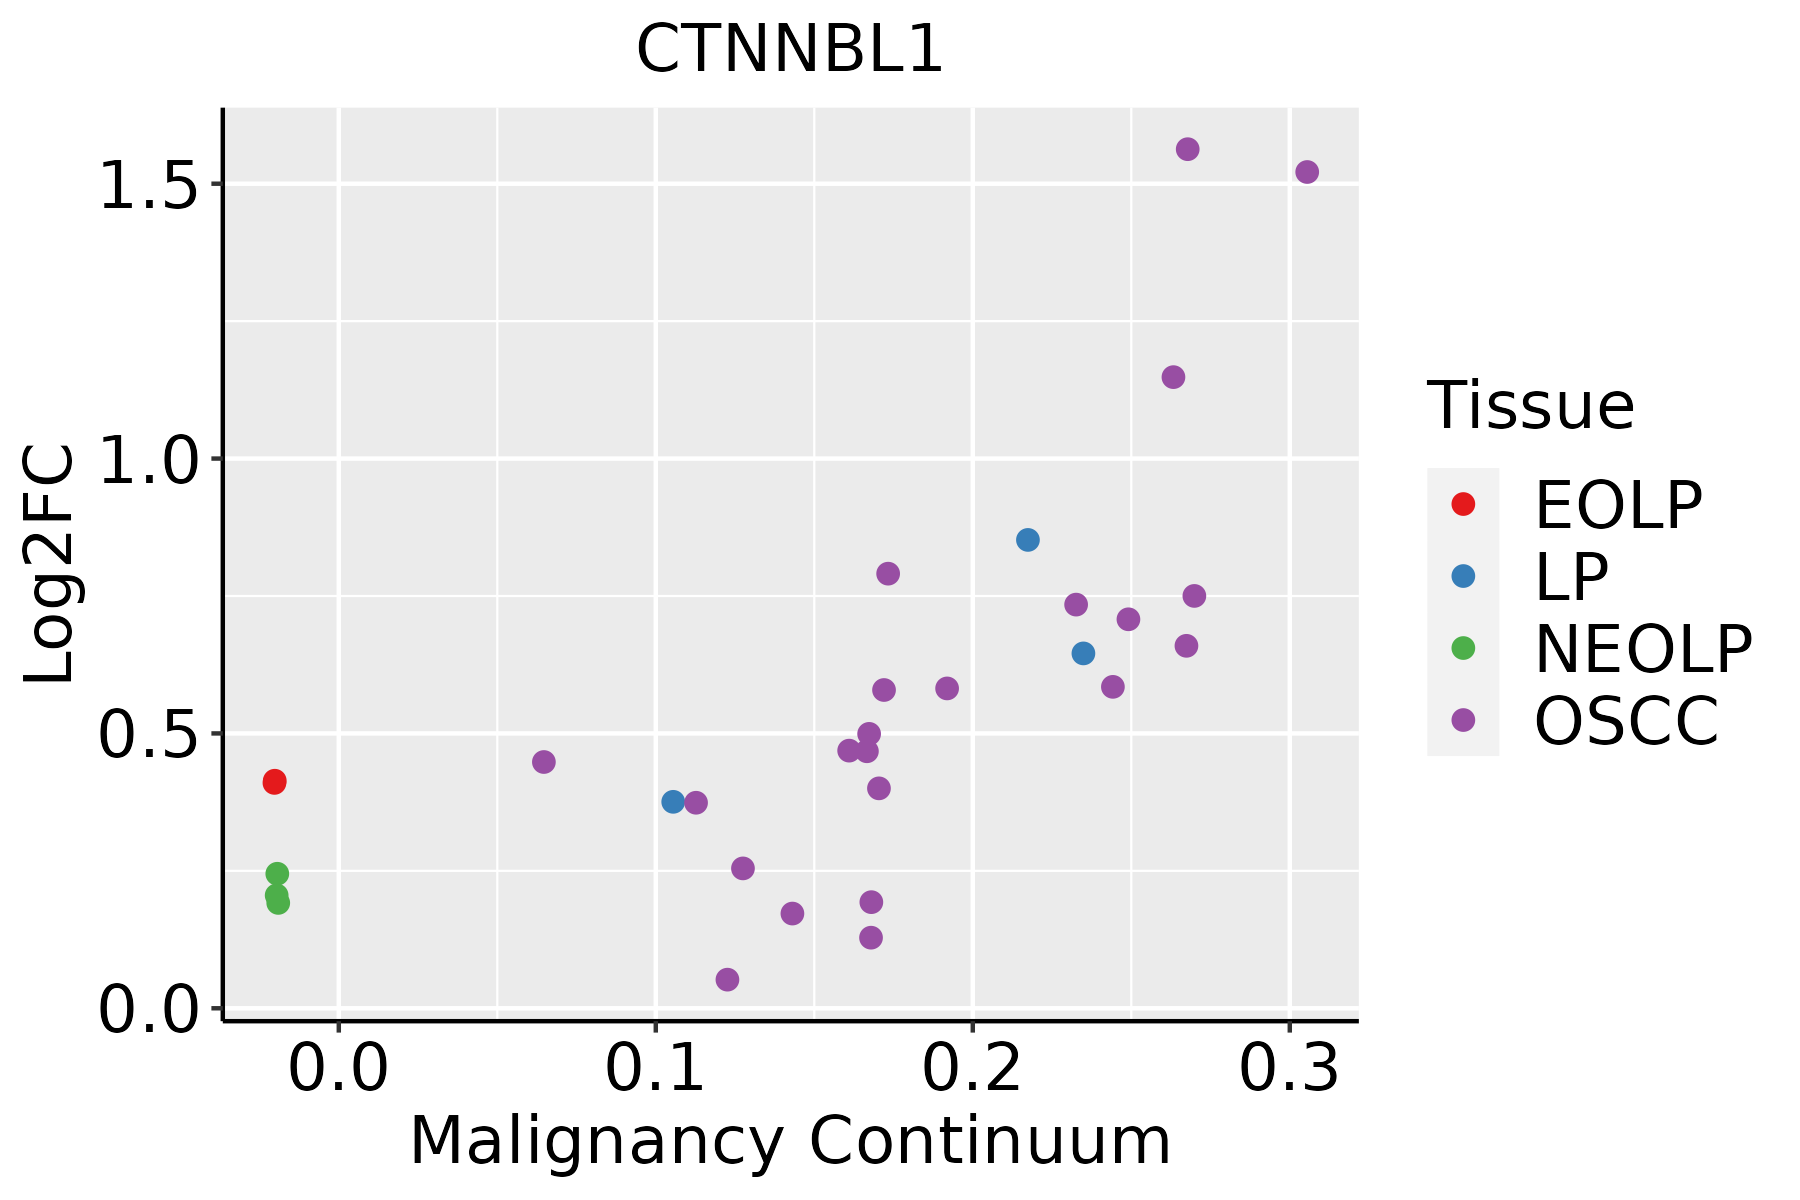 | EOLP: Erosive Oral lichen planus |
| LP: leukoplakia | ||
| NEOLP: Non-erosive oral lichen planus | ||
| OSCC: Oral squamous cell carcinoma | ||
| Skin | 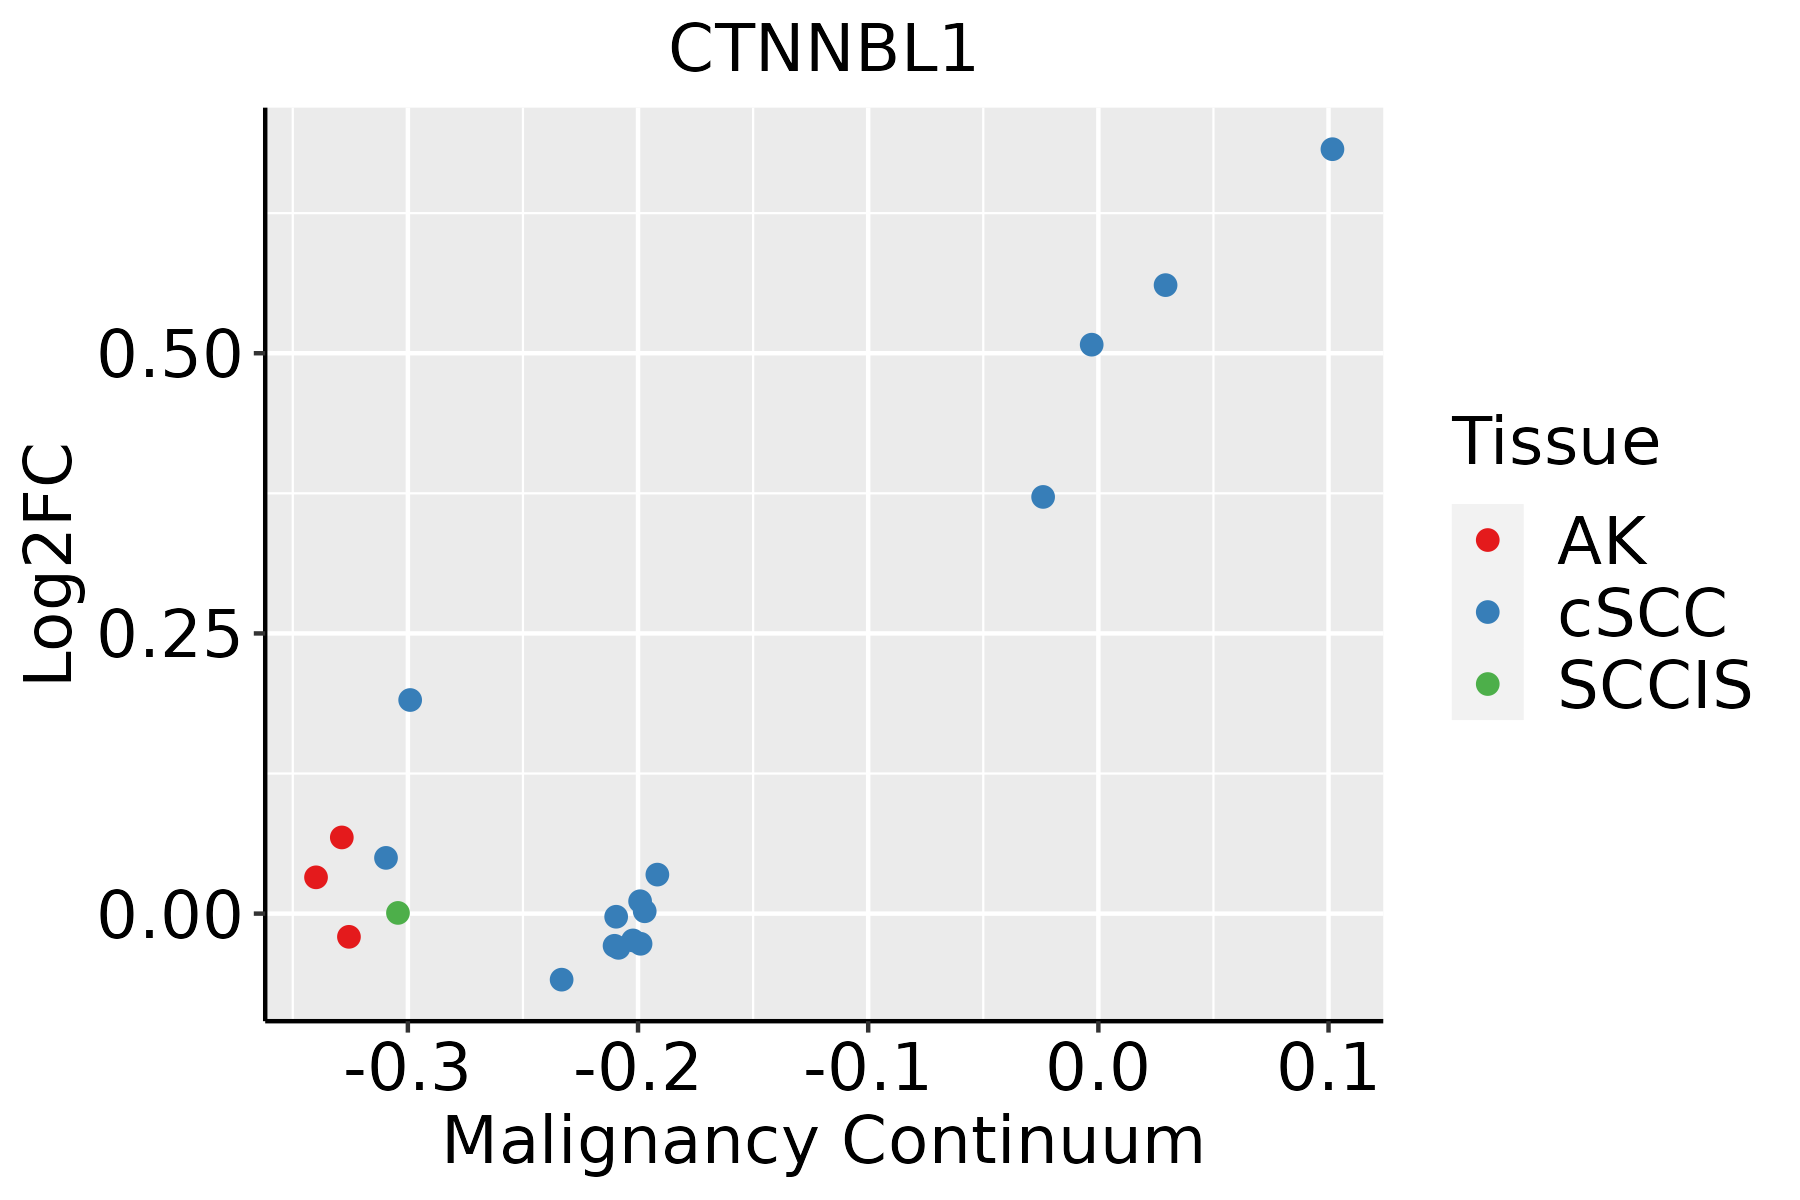 | AK: Actinic keratosis |
| cSCC: Cutaneous squamous cell carcinoma | ||
| SCCIS:squamous cell carcinoma in situ | ||
| Thyroid | 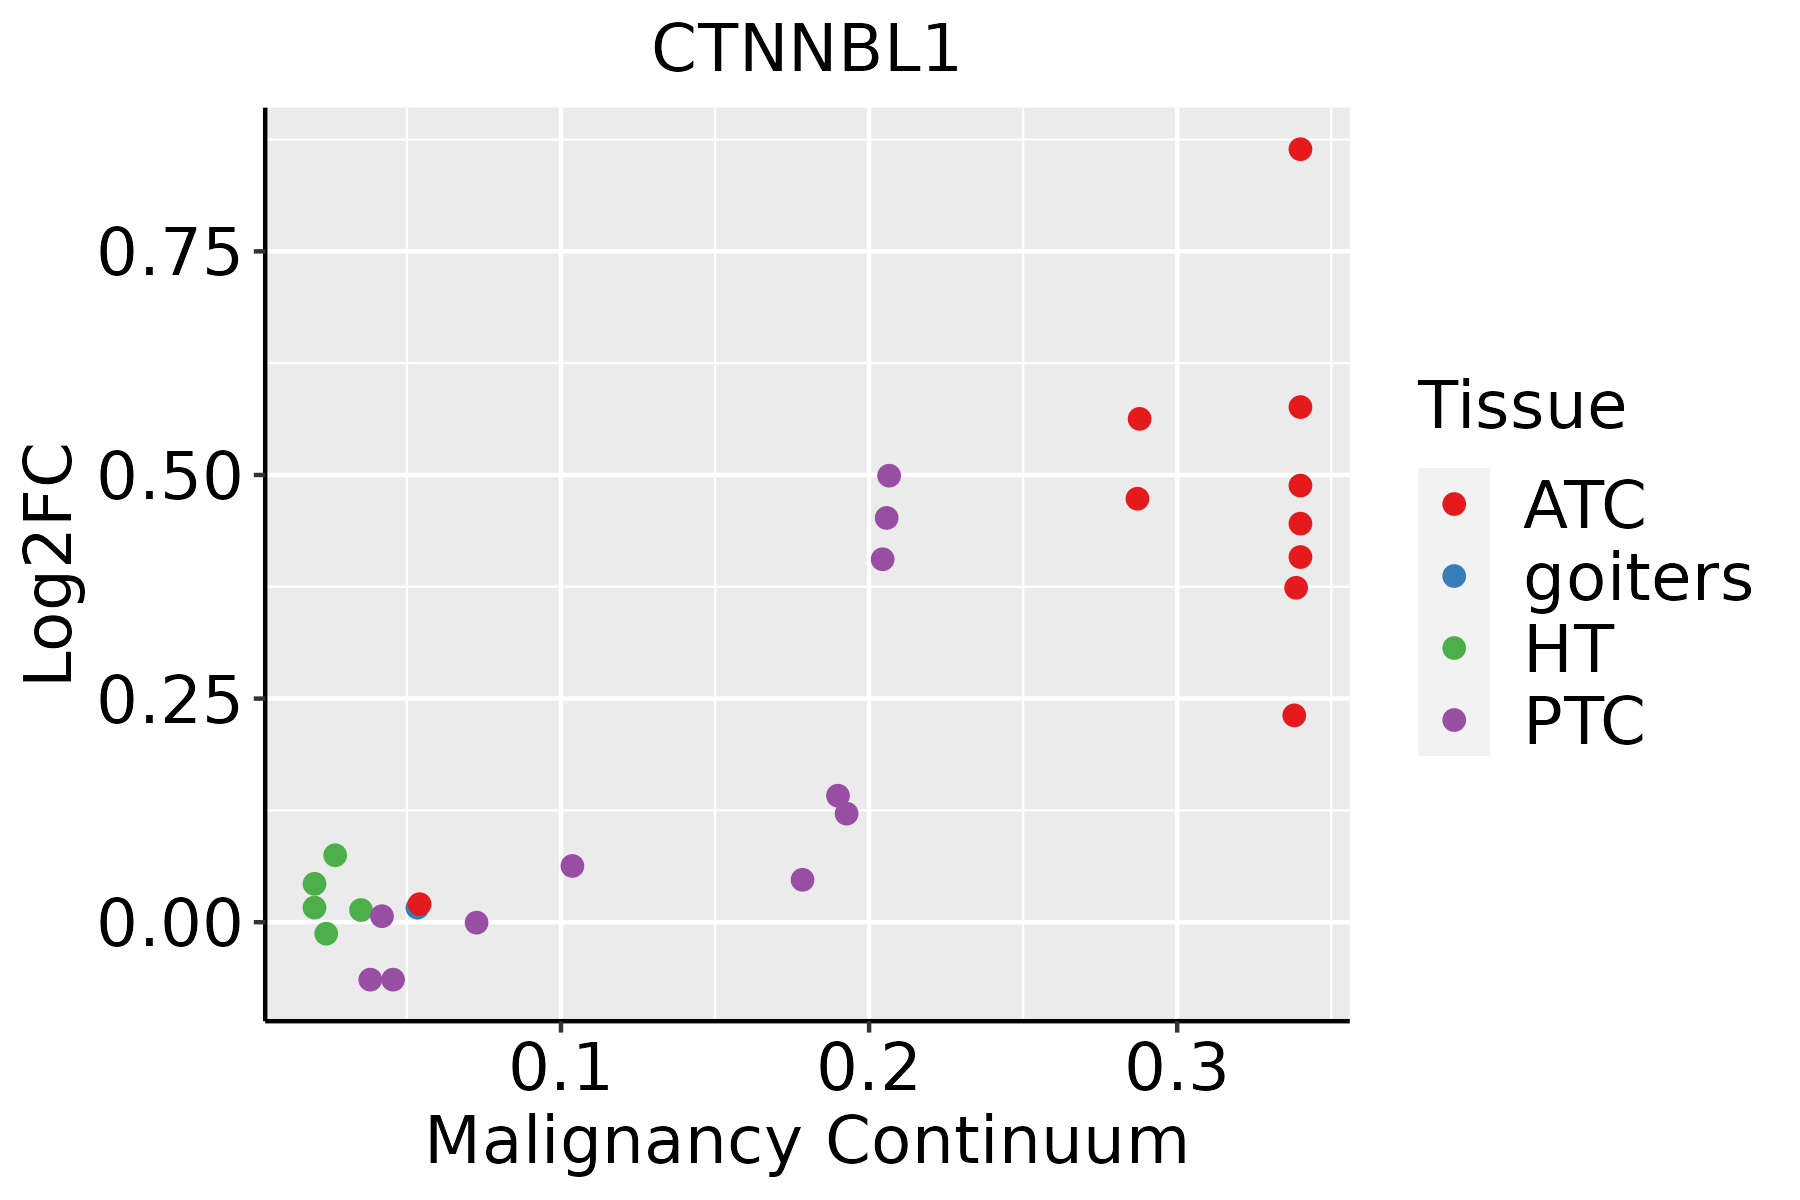 | ATC: Anaplastic thyroid cancer |
| HT: Hashimoto's thyroiditis | ||
| PTC: Papillary thyroid cancer |
| ∗log2FC in expression of this searched gene in stem-like cells from each diseased tissue sample relative to stem-like cells in normal samples in each tissue plotted against the malignancy continuum. Samples are colored based on if they are from different disease stage. |
Top |
Malignant transformation related pathway analysis |
| Find out the enriched GO biological processes and KEGG pathways involved in transition from healthy to precancer to cancer |
| Tissue | Disease Stage | Enriched GO biological Processes |
| Colorectum | AD |  |
| Colorectum | SER |  |
| Colorectum | MSS |  |
| Colorectum | MSI-H |  |
| Colorectum | FAP |  |
| ∗Top 15 enriched GO BP terms are showed in the bar plot of each disease state in each tissue. Each row represents a significant GO biological process which is colored according to the -log10(p.adjust). |
| Page: 1 2 3 4 5 6 7 8 9 |
| GO ID | Tissue | Disease Stage | Description | Gene Ratio | Bg Ratio | pvalue | p.adjust | Count |
| GO:0008380111 | Esophagus | ESCC | RNA splicing | 336/8552 | 434/18723 | 1.74e-42 | 3.67e-39 | 336 |
| GO:00022003 | Esophagus | ESCC | somatic diversification of immune receptors | 49/8552 | 77/18723 | 1.12e-03 | 5.60e-03 | 49 |
| GO:00164452 | Esophagus | ESCC | somatic diversification of immunoglobulins | 43/8552 | 67/18723 | 1.73e-03 | 7.97e-03 | 43 |
| GO:000838022 | Liver | HCC | RNA splicing | 313/7958 | 434/18723 | 1.36e-36 | 1.73e-33 | 313 |
| GO:0002200 | Liver | HCC | somatic diversification of immune receptors | 44/7958 | 77/18723 | 6.70e-03 | 2.72e-02 | 44 |
| GO:0016445 | Liver | HCC | somatic diversification of immunoglobulins | 38/7958 | 67/18723 | 1.32e-02 | 4.73e-02 | 38 |
| GO:000838020 | Oral cavity | OSCC | RNA splicing | 308/7305 | 434/18723 | 2.43e-42 | 7.70e-39 | 308 |
| GO:00022002 | Oral cavity | OSCC | somatic diversification of immune receptors | 40/7305 | 77/18723 | 1.42e-02 | 4.69e-02 | 40 |
| GO:000838025 | Oral cavity | EOLP | RNA splicing | 115/2218 | 434/18723 | 2.24e-17 | 3.04e-14 | 115 |
| GO:00164451 | Oral cavity | EOLP | somatic diversification of immunoglobulins | 16/2218 | 67/18723 | 4.37e-03 | 2.38e-02 | 16 |
| GO:00022001 | Oral cavity | EOLP | somatic diversification of immune receptors | 17/2218 | 77/18723 | 7.79e-03 | 3.72e-02 | 17 |
| GO:0008380112 | Skin | cSCC | RNA splicing | 263/4864 | 434/18723 | 2.45e-53 | 5.13e-50 | 263 |
| GO:0008380113 | Thyroid | PTC | RNA splicing | 273/5968 | 434/18723 | 4.44e-41 | 1.40e-37 | 273 |
| GO:00022004 | Thyroid | PTC | somatic diversification of immune receptors | 35/5968 | 77/18723 | 8.56e-03 | 3.59e-02 | 35 |
| GO:00164453 | Thyroid | PTC | somatic diversification of immunoglobulins | 31/5968 | 67/18723 | 9.51e-03 | 3.91e-02 | 31 |
| GO:000838034 | Thyroid | ATC | RNA splicing | 270/6293 | 434/18723 | 7.50e-35 | 1.19e-31 | 270 |
| Page: 1 |
| Pathway ID | Tissue | Disease Stage | Description | Gene Ratio | Bg Ratio | pvalue | p.adjust | qvalue | Count |
| hsa0304027 | Esophagus | ESCC | Spliceosome | 128/4205 | 217/8465 | 3.31e-03 | 8.79e-03 | 4.50e-03 | 128 |
| hsa0304037 | Esophagus | ESCC | Spliceosome | 128/4205 | 217/8465 | 3.31e-03 | 8.79e-03 | 4.50e-03 | 128 |
| hsa0304022 | Liver | HCC | Spliceosome | 122/4020 | 217/8465 | 5.55e-03 | 1.60e-02 | 8.91e-03 | 122 |
| hsa0304032 | Liver | HCC | Spliceosome | 122/4020 | 217/8465 | 5.55e-03 | 1.60e-02 | 8.91e-03 | 122 |
| hsa0304016 | Oral cavity | OSCC | Spliceosome | 123/3704 | 217/8465 | 7.21e-05 | 2.74e-04 | 1.40e-04 | 123 |
| hsa0304017 | Oral cavity | OSCC | Spliceosome | 123/3704 | 217/8465 | 7.21e-05 | 2.74e-04 | 1.40e-04 | 123 |
| Page: 1 |
Top |
Cell-cell communication analysis |
| Identification of potential cell-cell interactions between two cell types and their ligand-receptor pairs for different disease states |
| Ligand | Receptor | LRpair | Pathway | Tissue | Disease Stage |
| Page: 1 |
Top |
Single-cell gene regulatory network inference analysis |
| Find out the significant the regulons (TFs) and the target genes of each regulon across cell types for different disease states |
| TF | Cell Type | Tissue | Disease Stage | Target Gene | RSS | Regulon Activity |
| ∗The dot plots of a searched regulon are shown for all cell subpopulations in each disease state of each tissue based on the regulon specific score inferred using pySCENIC and by calculating the average expression. |
| Page: 1 |
Top |
Somatic mutation of malignant transformation related genes |
| Annotation of somatic variants for genes involved in malignant transformation |
| Hugo Symbol | Variant Class | Variant Classification | dbSNP RS | HGVSc | HGVSp | HGVSp Short | SWISSPROT | BIOTYPE | SIFT | PolyPhen | Tumor Sample Barcode | Tissue | Histology | Sex | Age | Stage | Therapy Types | Drugs | Outcome |
| CTNNBL1 | SNV | Missense_Mutation | rs760728264 | c.124N>T | p.Arg42Trp | p.R42W | Q8WYA6 | protein_coding | deleterious(0.02) | benign(0.251) | TCGA-A2-A0YD-01 | Breast | breast invasive carcinoma | Female | <65 | I/II | Chemotherapy | cytoxan | SD |
| CTNNBL1 | SNV | Missense_Mutation | rs112045085 | c.55N>T | p.Arg19Trp | p.R19W | Q8WYA6 | protein_coding | tolerated(0.07) | possibly_damaging(0.76) | TCGA-AC-A2BK-01 | Breast | breast invasive carcinoma | Female | >=65 | III/IV | Chemotherapy | cytoxan | CR |
| CTNNBL1 | SNV | Missense_Mutation | c.1021N>A | p.Leu341Ile | p.L341I | Q8WYA6 | protein_coding | tolerated(0.1) | possibly_damaging(0.893) | TCGA-AN-A046-01 | Breast | breast invasive carcinoma | Female | >=65 | I/II | Unknown | Unknown | SD | |
| CTNNBL1 | SNV | Missense_Mutation | c.160N>A | p.Asp54Asn | p.D54N | Q8WYA6 | protein_coding | tolerated(0.26) | benign(0.124) | TCGA-BH-A0HF-01 | Breast | breast invasive carcinoma | Female | >=65 | I/II | Hormone Therapy | arimidex | SD | |
| CTNNBL1 | SNV | Missense_Mutation | c.1327N>C | p.Glu443Gln | p.E443Q | Q8WYA6 | protein_coding | deleterious(0) | probably_damaging(0.994) | TCGA-C5-A1BE-01 | Cervix | cervical & endocervical cancer | Female | <65 | I/II | Chemotherapy | cisplatin | PD | |
| CTNNBL1 | SNV | Missense_Mutation | c.1024N>G | p.Met342Val | p.M342V | Q8WYA6 | protein_coding | deleterious(0) | possibly_damaging(0.665) | TCGA-A6-6780-01 | Colorectum | colon adenocarcinoma | Male | >=65 | I/II | Unknown | Unknown | SD | |
| CTNNBL1 | SNV | Missense_Mutation | c.56G>A | p.Arg19Gln | p.R19Q | Q8WYA6 | protein_coding | tolerated(0.33) | possibly_damaging(0.515) | TCGA-AA-3680-01 | Colorectum | colon adenocarcinoma | Female | >=65 | III/IV | Chemotherapy | folinic | PD | |
| CTNNBL1 | SNV | Missense_Mutation | novel | c.286A>C | p.Asn96His | p.N96H | Q8WYA6 | protein_coding | deleterious(0) | probably_damaging(1) | TCGA-AA-3984-01 | Colorectum | colon adenocarcinoma | Female | <65 | I/II | Unknown | Unknown | SD |
| CTNNBL1 | SNV | Missense_Mutation | rs779142999 | c.86N>A | p.Arg29His | p.R29H | Q8WYA6 | protein_coding | tolerated(0.07) | benign(0.143) | TCGA-AA-A02R-01 | Colorectum | colon adenocarcinoma | Female | >=65 | I/II | Unknown | Unknown | PD |
| CTNNBL1 | SNV | Missense_Mutation | novel | c.933N>T | p.Glu311Asp | p.E311D | Q8WYA6 | protein_coding | deleterious(0.01) | probably_damaging(0.928) | TCGA-CA-6717-01 | Colorectum | colon adenocarcinoma | Male | <65 | I/II | Chemotherapy | oxaliplatin | CR |
| Page: 1 2 3 4 5 6 7 |
Top |
Related drugs of malignant transformation related genes |
| Identification of chemicals and drugs interact with genes involved in malignant transfromation |
| (DGIdb 4.0) |
| Entrez ID | Symbol | Category | Interaction Types | Drug Claim Name | Drug Name | PMIDs |
| 56259 | CTNNBL1 | NA | Beta-acetyldigoxin | ACETYLDIGOXIN | ||
| 56259 | CTNNBL1 | NA | Alpha-acetyldigoxin | CHEMBL112750 |
| Page: 1 |

Copyright 2023-Present -The University of Texas Health Science Center at Houston |