
|
|||||
|
 | |
| |
| |
| |
| |
| |
|
Gene: CTNNBIP1 |
Gene summary for CTNNBIP1 |
| Gene information | Species | Human | Gene symbol | CTNNBIP1 | Gene ID | 56998 |
| Gene name | catenin beta interacting protein 1 | |
| Gene Alias | ICAT | |
| Cytomap | 1p36.22 | |
| Gene Type | protein-coding | GO ID | GO:0000122 | UniProtAcc | A0A024R4D7 |
Top |
Malignant transformation analysis |
| Identification of the aberrant gene expression in precancerous and cancerous lesions by comparing the gene expression of stem-like cells in diseased tissues with normal stem cells |
| Entrez ID | Symbol | Replicates | Species | Organ | Tissue | Adj P-value | Log2FC | Malignancy |
| 56998 | CTNNBIP1 | LZE4T | Human | Esophagus | ESCC | 5.54e-04 | -1.12e-02 | 0.0811 |
| 56998 | CTNNBIP1 | LZE5T | Human | Esophagus | ESCC | 4.45e-03 | 2.62e-01 | 0.0514 |
| 56998 | CTNNBIP1 | LZE20T | Human | Esophagus | ESCC | 1.59e-05 | 4.32e-01 | 0.0662 |
| 56998 | CTNNBIP1 | LZE22T | Human | Esophagus | ESCC | 4.53e-09 | 8.12e-01 | 0.068 |
| 56998 | CTNNBIP1 | LZE24T | Human | Esophagus | ESCC | 8.80e-30 | 9.42e-01 | 0.0596 |
| 56998 | CTNNBIP1 | LZE21T | Human | Esophagus | ESCC | 2.24e-07 | 7.76e-01 | 0.0655 |
| 56998 | CTNNBIP1 | P1T-E | Human | Esophagus | ESCC | 1.69e-09 | 1.00e+00 | 0.0875 |
| 56998 | CTNNBIP1 | P2T-E | Human | Esophagus | ESCC | 3.49e-55 | 1.23e+00 | 0.1177 |
| 56998 | CTNNBIP1 | P4T-E | Human | Esophagus | ESCC | 2.10e-46 | 1.31e+00 | 0.1323 |
| 56998 | CTNNBIP1 | P5T-E | Human | Esophagus | ESCC | 2.97e-25 | 4.92e-01 | 0.1327 |
| 56998 | CTNNBIP1 | P8T-E | Human | Esophagus | ESCC | 4.52e-24 | 5.02e-01 | 0.0889 |
| 56998 | CTNNBIP1 | P9T-E | Human | Esophagus | ESCC | 2.40e-16 | 3.84e-01 | 0.1131 |
| 56998 | CTNNBIP1 | P10T-E | Human | Esophagus | ESCC | 4.81e-25 | 7.00e-01 | 0.116 |
| 56998 | CTNNBIP1 | P11T-E | Human | Esophagus | ESCC | 3.30e-20 | 1.18e+00 | 0.1426 |
| 56998 | CTNNBIP1 | P12T-E | Human | Esophagus | ESCC | 6.81e-33 | 7.69e-01 | 0.1122 |
| 56998 | CTNNBIP1 | P15T-E | Human | Esophagus | ESCC | 1.04e-44 | 1.13e+00 | 0.1149 |
| 56998 | CTNNBIP1 | P16T-E | Human | Esophagus | ESCC | 3.15e-43 | 9.92e-01 | 0.1153 |
| 56998 | CTNNBIP1 | P17T-E | Human | Esophagus | ESCC | 1.79e-18 | 9.63e-01 | 0.1278 |
| 56998 | CTNNBIP1 | P19T-E | Human | Esophagus | ESCC | 1.05e-10 | 1.41e+00 | 0.1662 |
| 56998 | CTNNBIP1 | P20T-E | Human | Esophagus | ESCC | 1.94e-59 | 1.43e+00 | 0.1124 |
| Page: 1 2 3 4 5 6 |
| Tissue | Expression Dynamics | Abbreviation |
| Esophagus | 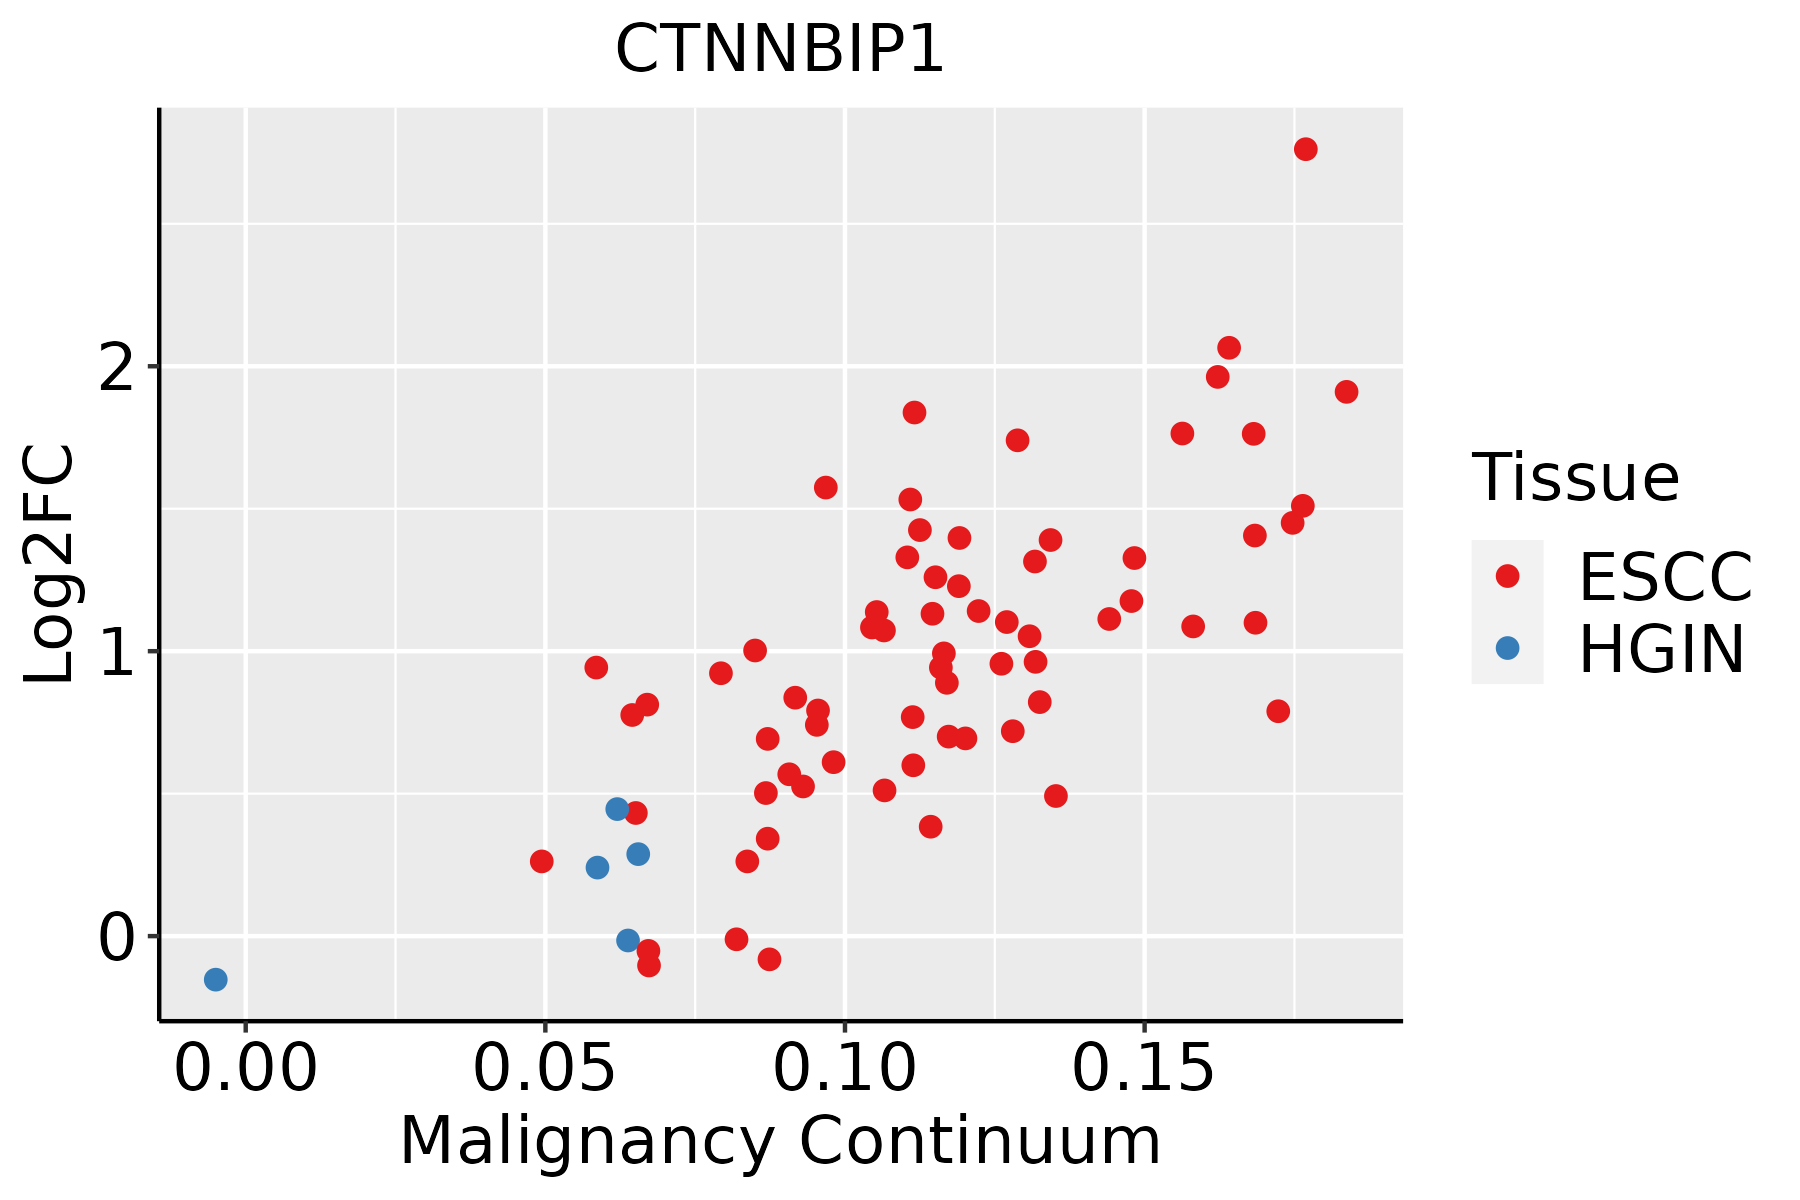 | ESCC: Esophageal squamous cell carcinoma |
| HGIN: High-grade intraepithelial neoplasias | ||
| LGIN: Low-grade intraepithelial neoplasias | ||
| Liver |  | HCC: Hepatocellular carcinoma |
| NAFLD: Non-alcoholic fatty liver disease | ||
| Oral Cavity |  | EOLP: Erosive Oral lichen planus |
| LP: leukoplakia | ||
| NEOLP: Non-erosive oral lichen planus | ||
| OSCC: Oral squamous cell carcinoma | ||
| Skin | 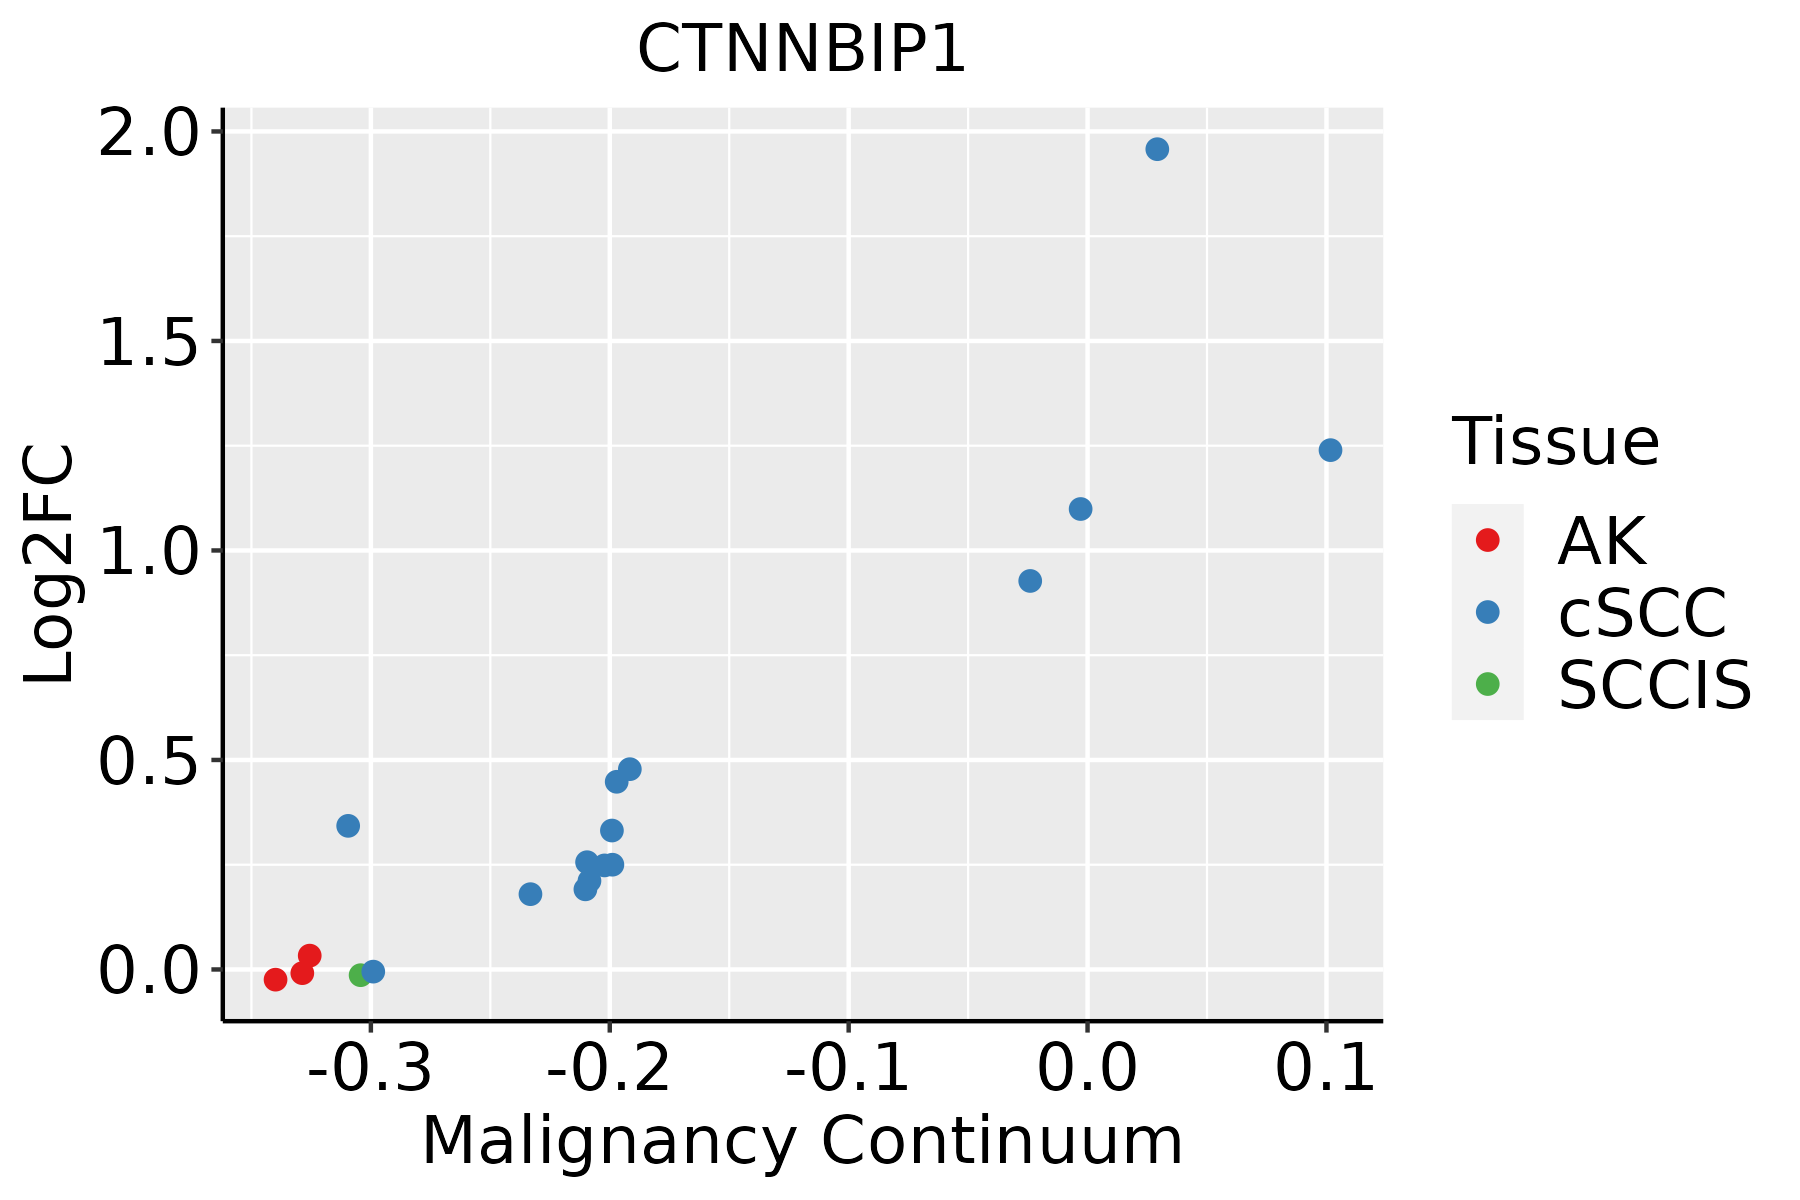 | AK: Actinic keratosis |
| cSCC: Cutaneous squamous cell carcinoma | ||
| SCCIS:squamous cell carcinoma in situ | ||
| Thyroid |  | ATC: Anaplastic thyroid cancer |
| HT: Hashimoto's thyroiditis | ||
| PTC: Papillary thyroid cancer |
| ∗log2FC in expression of this searched gene in stem-like cells from each diseased tissue sample relative to stem-like cells in normal samples in each tissue plotted against the malignancy continuum. Samples are colored based on if they are from different disease stage. |
Top |
Malignant transformation related pathway analysis |
| Find out the enriched GO biological processes and KEGG pathways involved in transition from healthy to precancer to cancer |
| Tissue | Disease Stage | Enriched GO biological Processes |
| Colorectum | AD |  |
| Colorectum | SER |  |
| Colorectum | MSS |  |
| Colorectum | MSI-H |  |
| Colorectum | FAP |  |
| ∗Top 15 enriched GO BP terms are showed in the bar plot of each disease state in each tissue. Each row represents a significant GO biological process which is colored according to the -log10(p.adjust). |
| Page: 1 2 3 4 5 6 7 8 9 |
| GO ID | Tissue | Disease Stage | Description | Gene Ratio | Bg Ratio | pvalue | p.adjust | Count |
| GO:0051098111 | Esophagus | ESCC | regulation of binding | 251/8552 | 363/18723 | 6.73e-20 | 8.46e-18 | 251 |
| GO:0043254111 | Esophagus | ESCC | regulation of protein-containing complex assembly | 278/8552 | 428/18723 | 3.81e-16 | 2.77e-14 | 278 |
| GO:004339320 | Esophagus | ESCC | regulation of protein binding | 135/8552 | 196/18723 | 3.69e-11 | 1.22e-09 | 135 |
| GO:001605517 | Esophagus | ESCC | Wnt signaling pathway | 268/8552 | 444/18723 | 2.32e-10 | 6.58e-09 | 268 |
| GO:019873817 | Esophagus | ESCC | cell-cell signaling by wnt | 269/8552 | 446/18723 | 2.41e-10 | 6.79e-09 | 269 |
| GO:0030099111 | Esophagus | ESCC | myeloid cell differentiation | 232/8552 | 381/18723 | 1.22e-09 | 2.90e-08 | 232 |
| GO:0051101111 | Esophagus | ESCC | regulation of DNA binding | 84/8552 | 118/18723 | 1.64e-08 | 3.21e-07 | 84 |
| GO:0051100111 | Esophagus | ESCC | negative regulation of binding | 109/8552 | 162/18723 | 2.10e-08 | 4.03e-07 | 109 |
| GO:00510908 | Esophagus | ESCC | regulation of DNA-binding transcription factor activity | 252/8552 | 440/18723 | 5.22e-07 | 6.97e-06 | 252 |
| GO:003011117 | Esophagus | ESCC | regulation of Wnt signaling pathway | 194/8552 | 328/18723 | 5.39e-07 | 7.14e-06 | 194 |
| GO:00063673 | Esophagus | ESCC | transcription initiation from RNA polymerase II promoter | 56/8552 | 77/18723 | 1.30e-06 | 1.59e-05 | 56 |
| GO:000164918 | Esophagus | ESCC | osteoblast differentiation | 140/8552 | 229/18723 | 1.63e-06 | 1.95e-05 | 140 |
| GO:000635211 | Esophagus | ESCC | DNA-templated transcription, initiation | 86/8552 | 130/18723 | 1.88e-06 | 2.19e-05 | 86 |
| GO:000257317 | Esophagus | ESCC | myeloid leukocyte differentiation | 128/8552 | 208/18723 | 2.75e-06 | 3.15e-05 | 128 |
| GO:000150317 | Esophagus | ESCC | ossification | 232/8552 | 408/18723 | 3.00e-06 | 3.40e-05 | 232 |
| GO:003209116 | Esophagus | ESCC | negative regulation of protein binding | 65/8552 | 94/18723 | 3.46e-06 | 3.82e-05 | 65 |
| GO:006056210 | Esophagus | ESCC | epithelial tube morphogenesis | 187/8552 | 325/18723 | 9.95e-06 | 9.44e-05 | 187 |
| GO:0031333110 | Esophagus | ESCC | negative regulation of protein-containing complex assembly | 86/8552 | 141/18723 | 1.74e-04 | 1.14e-03 | 86 |
| GO:00433924 | Esophagus | ESCC | negative regulation of DNA binding | 37/8552 | 52/18723 | 1.75e-04 | 1.14e-03 | 37 |
| GO:1903706110 | Esophagus | ESCC | regulation of hemopoiesis | 201/8552 | 367/18723 | 2.60e-04 | 1.58e-03 | 201 |
| Page: 1 2 3 4 5 6 7 8 9 10 11 12 13 |
| Pathway ID | Tissue | Disease Stage | Description | Gene Ratio | Bg Ratio | pvalue | p.adjust | qvalue | Count |
| Page: 1 |
Top |
Cell-cell communication analysis |
| Identification of potential cell-cell interactions between two cell types and their ligand-receptor pairs for different disease states |
| Ligand | Receptor | LRpair | Pathway | Tissue | Disease Stage |
| Page: 1 |
Top |
Single-cell gene regulatory network inference analysis |
| Find out the significant the regulons (TFs) and the target genes of each regulon across cell types for different disease states |
| TF | Cell Type | Tissue | Disease Stage | Target Gene | RSS | Regulon Activity |
| ∗The dot plots of a searched regulon are shown for all cell subpopulations in each disease state of each tissue based on the regulon specific score inferred using pySCENIC and by calculating the average expression. |
| Page: 1 |
Top |
Somatic mutation of malignant transformation related genes |
| Annotation of somatic variants for genes involved in malignant transformation |
| Hugo Symbol | Variant Class | Variant Classification | dbSNP RS | HGVSc | HGVSp | HGVSp Short | SWISSPROT | BIOTYPE | SIFT | PolyPhen | Tumor Sample Barcode | Tissue | Histology | Sex | Age | Stage | Therapy Types | Drugs | Outcome |
| CTNNBIP1 | SNV | Missense_Mutation | novel | c.35N>G | p.Glu12Gly | p.E12G | Q9NSA3 | protein_coding | deleterious(0.01) | benign(0.078) | TCGA-A5-A0G2-01 | Endometrium | uterine corpus endometrioid carcinoma | Female | <65 | III/IV | Unknown | Unknown | SD |
| CTNNBIP1 | SNV | Missense_Mutation | novel | c.191N>T | p.Ala64Val | p.A64V | Q9NSA3 | protein_coding | deleterious(0.03) | benign(0) | TCGA-AX-A1C5-01 | Endometrium | uterine corpus endometrioid carcinoma | Female | <65 | III/IV | Unspecific | Carboplatin | SD |
| CTNNBIP1 | SNV | Missense_Mutation | novel | c.199N>A | p.Val67Met | p.V67M | Q9NSA3 | protein_coding | tolerated(0.09) | benign(0.115) | TCGA-AX-A3G8-01 | Endometrium | uterine corpus endometrioid carcinoma | Female | >=65 | I/II | Unknown | Unknown | SD |
| CTNNBIP1 | SNV | Missense_Mutation | c.203N>C | p.Val68Ala | p.V68A | Q9NSA3 | protein_coding | deleterious(0) | benign(0.018) | TCGA-BR-6452-01 | Stomach | stomach adenocarcinoma | Female | >=65 | I/II | Unknown | Unknown | SD | |
| CTNNBIP1 | SNV | Missense_Mutation | novel | c.241N>G | p.Gln81Glu | p.Q81E | Q9NSA3 | protein_coding | deleterious_low_confidence(0.02) | possibly_damaging(0.523) | TCGA-VQ-A8DZ-01 | Stomach | stomach adenocarcinoma | Male | >=65 | III/IV | Chemotherapy | fluorouracil | PD |
| Page: 1 |
Top |
Related drugs of malignant transformation related genes |
| Identification of chemicals and drugs interact with genes involved in malignant transfromation |
| (DGIdb 4.0) |
| Entrez ID | Symbol | Category | Interaction Types | Drug Claim Name | Drug Name | PMIDs |
| Page: 1 |

Copyright 2023-Present -The University of Texas Health Science Center at Houston |