
|
|||||
|
 | |
| |
| |
| |
| |
| |
|
Gene: CTNNAL1 |
Gene summary for CTNNAL1 |
| Gene information | Species | Human | Gene symbol | CTNNAL1 | Gene ID | 8727 |
| Gene name | catenin alpha like 1 | |
| Gene Alias | ACRP | |
| Cytomap | 9q31.3 | |
| Gene Type | protein-coding | GO ID | GO:0007154 | UniProtAcc | B3KMX6 |
Top |
Malignant transformation analysis |
| Identification of the aberrant gene expression in precancerous and cancerous lesions by comparing the gene expression of stem-like cells in diseased tissues with normal stem cells |
| Entrez ID | Symbol | Replicates | Species | Organ | Tissue | Adj P-value | Log2FC | Malignancy |
| 8727 | CTNNAL1 | LZE7T | Human | Esophagus | ESCC | 2.91e-04 | 3.16e-01 | 0.0667 |
| 8727 | CTNNAL1 | LZE8T | Human | Esophagus | ESCC | 1.34e-03 | -2.25e-01 | 0.067 |
| 8727 | CTNNAL1 | LZE20T | Human | Esophagus | ESCC | 2.31e-02 | -3.09e-01 | 0.0662 |
| 8727 | CTNNAL1 | LZE24T | Human | Esophagus | ESCC | 7.02e-06 | -9.75e-02 | 0.0596 |
| 8727 | CTNNAL1 | P2T-E | Human | Esophagus | ESCC | 2.00e-37 | 1.03e+00 | 0.1177 |
| 8727 | CTNNAL1 | P4T-E | Human | Esophagus | ESCC | 6.01e-10 | 5.13e-01 | 0.1323 |
| 8727 | CTNNAL1 | P5T-E | Human | Esophagus | ESCC | 6.83e-07 | -1.42e-01 | 0.1327 |
| 8727 | CTNNAL1 | P8T-E | Human | Esophagus | ESCC | 4.87e-08 | 1.28e-01 | 0.0889 |
| 8727 | CTNNAL1 | P9T-E | Human | Esophagus | ESCC | 6.84e-09 | 3.69e-01 | 0.1131 |
| 8727 | CTNNAL1 | P10T-E | Human | Esophagus | ESCC | 3.28e-27 | 6.67e-01 | 0.116 |
| 8727 | CTNNAL1 | P11T-E | Human | Esophagus | ESCC | 2.62e-18 | 1.14e+00 | 0.1426 |
| 8727 | CTNNAL1 | P15T-E | Human | Esophagus | ESCC | 3.07e-15 | 8.22e-01 | 0.1149 |
| 8727 | CTNNAL1 | P16T-E | Human | Esophagus | ESCC | 1.26e-16 | 1.77e-01 | 0.1153 |
| 8727 | CTNNAL1 | P17T-E | Human | Esophagus | ESCC | 1.13e-06 | 6.76e-01 | 0.1278 |
| 8727 | CTNNAL1 | P19T-E | Human | Esophagus | ESCC | 4.03e-03 | 7.61e-01 | 0.1662 |
| 8727 | CTNNAL1 | P20T-E | Human | Esophagus | ESCC | 8.53e-05 | 1.48e-01 | 0.1124 |
| 8727 | CTNNAL1 | P21T-E | Human | Esophagus | ESCC | 5.05e-41 | 1.08e+00 | 0.1617 |
| 8727 | CTNNAL1 | P22T-E | Human | Esophagus | ESCC | 7.43e-04 | 4.77e-02 | 0.1236 |
| 8727 | CTNNAL1 | P23T-E | Human | Esophagus | ESCC | 8.85e-03 | 5.56e-02 | 0.108 |
| 8727 | CTNNAL1 | P24T-E | Human | Esophagus | ESCC | 3.52e-20 | 7.45e-01 | 0.1287 |
| Page: 1 2 3 4 5 6 |
| Tissue | Expression Dynamics | Abbreviation |
| Esophagus |  | ESCC: Esophageal squamous cell carcinoma |
| HGIN: High-grade intraepithelial neoplasias | ||
| LGIN: Low-grade intraepithelial neoplasias | ||
| Liver | 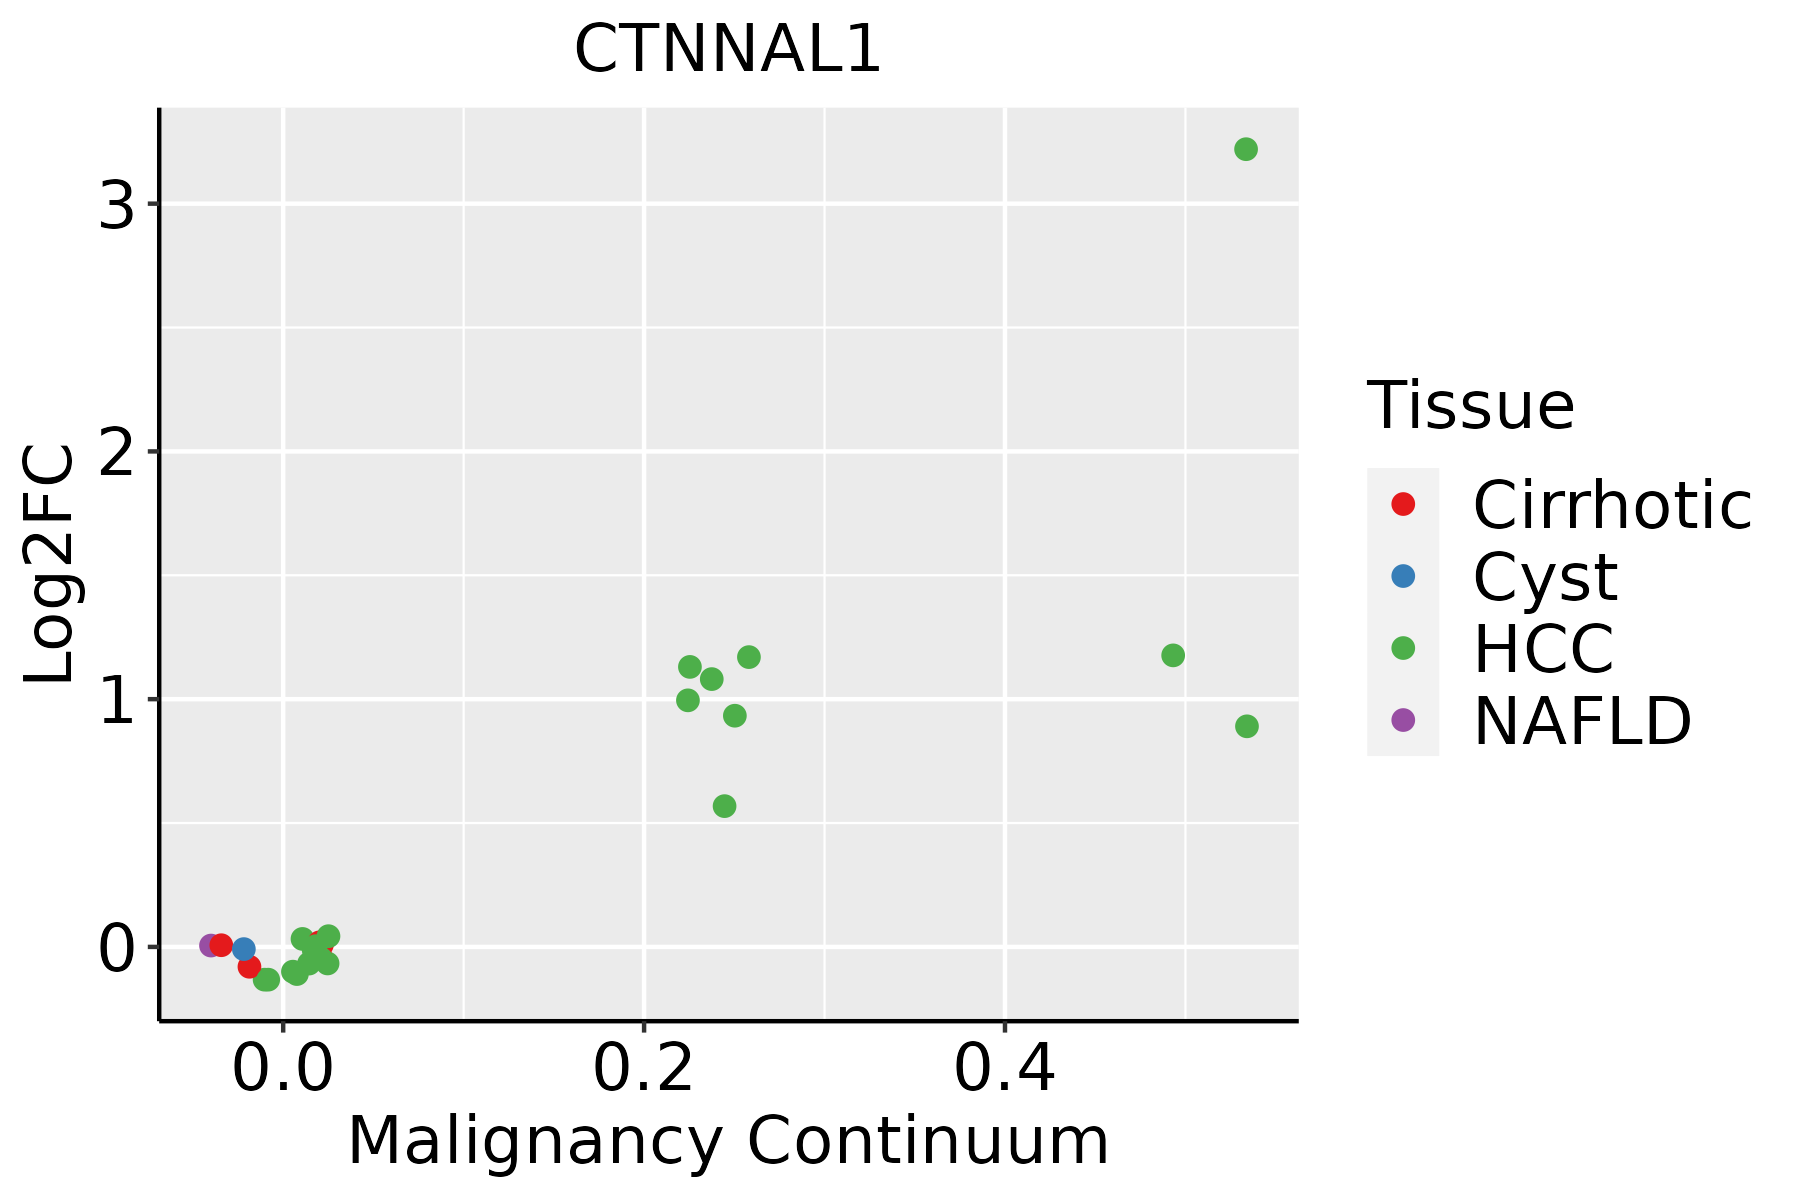 | HCC: Hepatocellular carcinoma |
| NAFLD: Non-alcoholic fatty liver disease | ||
| Oral Cavity | 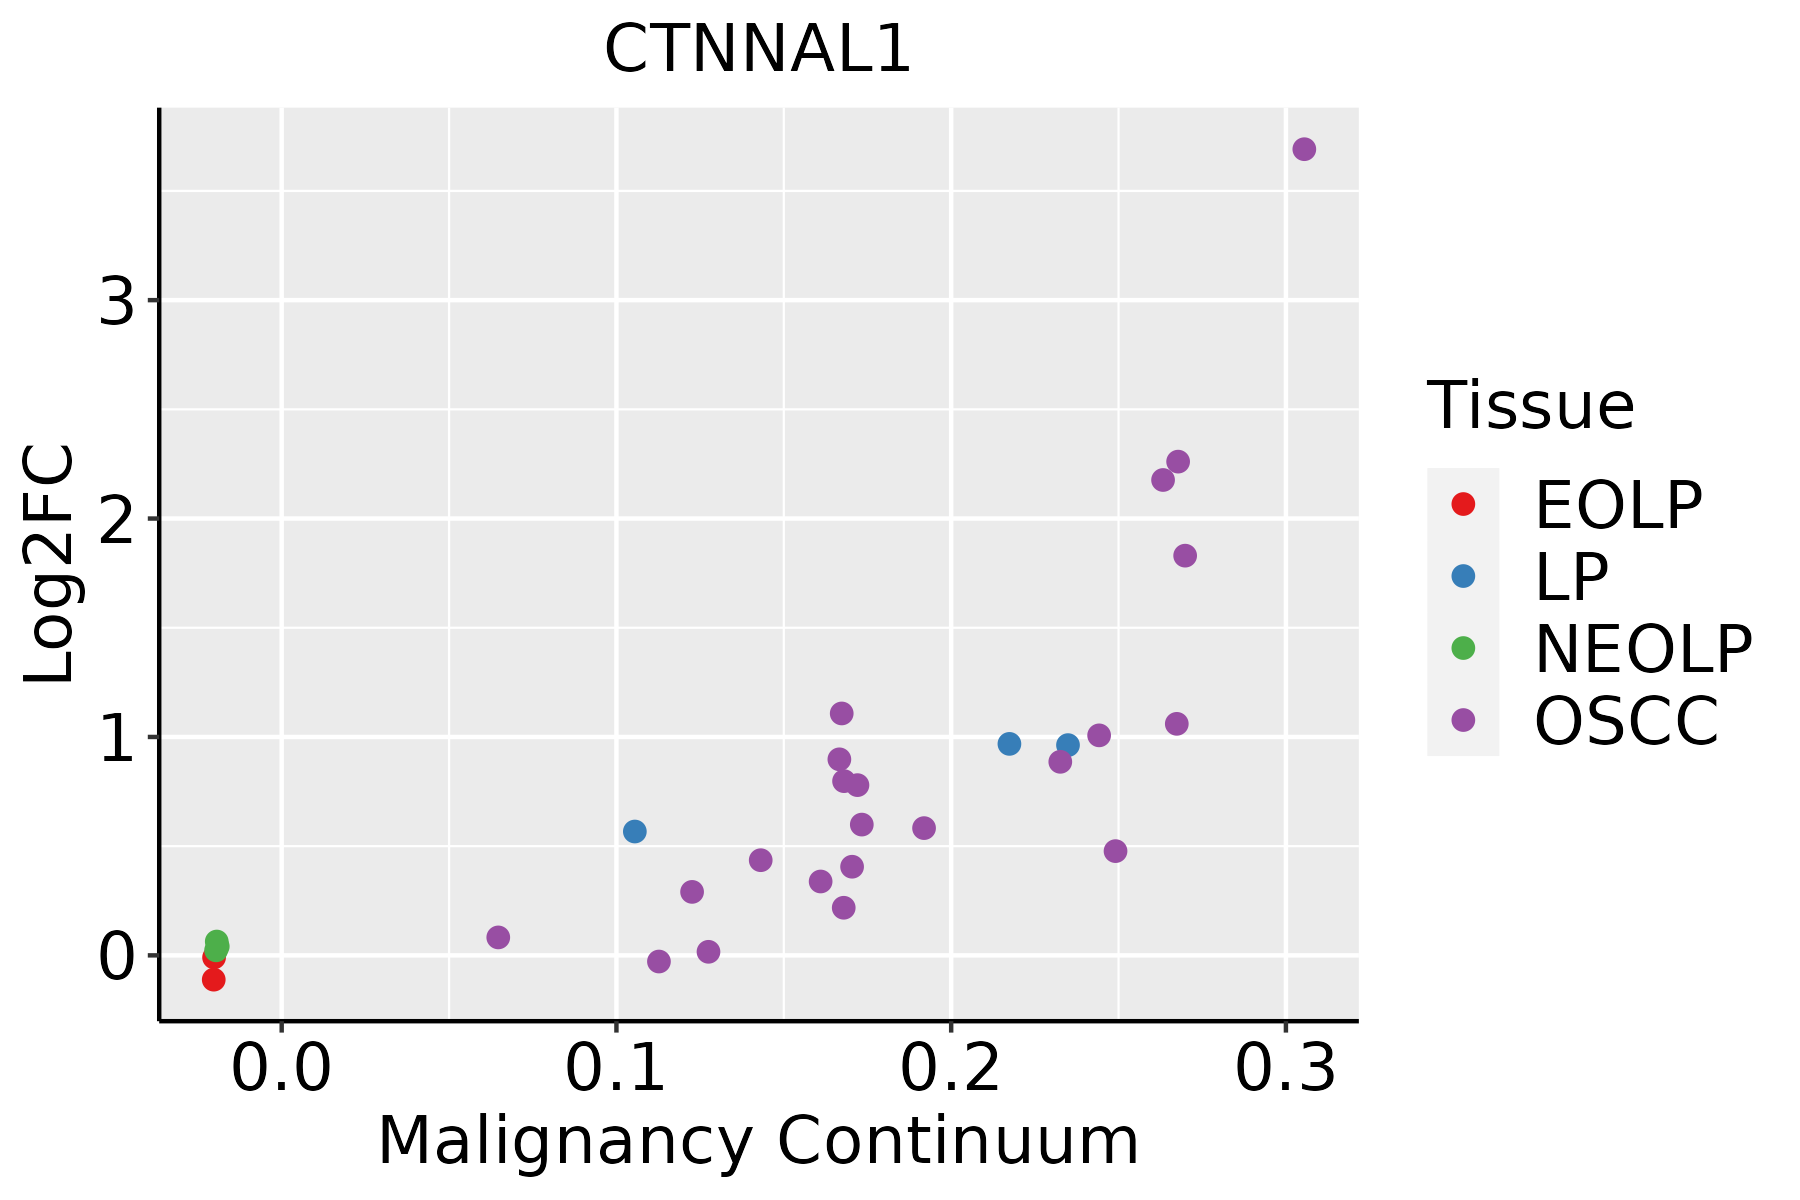 | EOLP: Erosive Oral lichen planus |
| LP: leukoplakia | ||
| NEOLP: Non-erosive oral lichen planus | ||
| OSCC: Oral squamous cell carcinoma | ||
| Prostate | 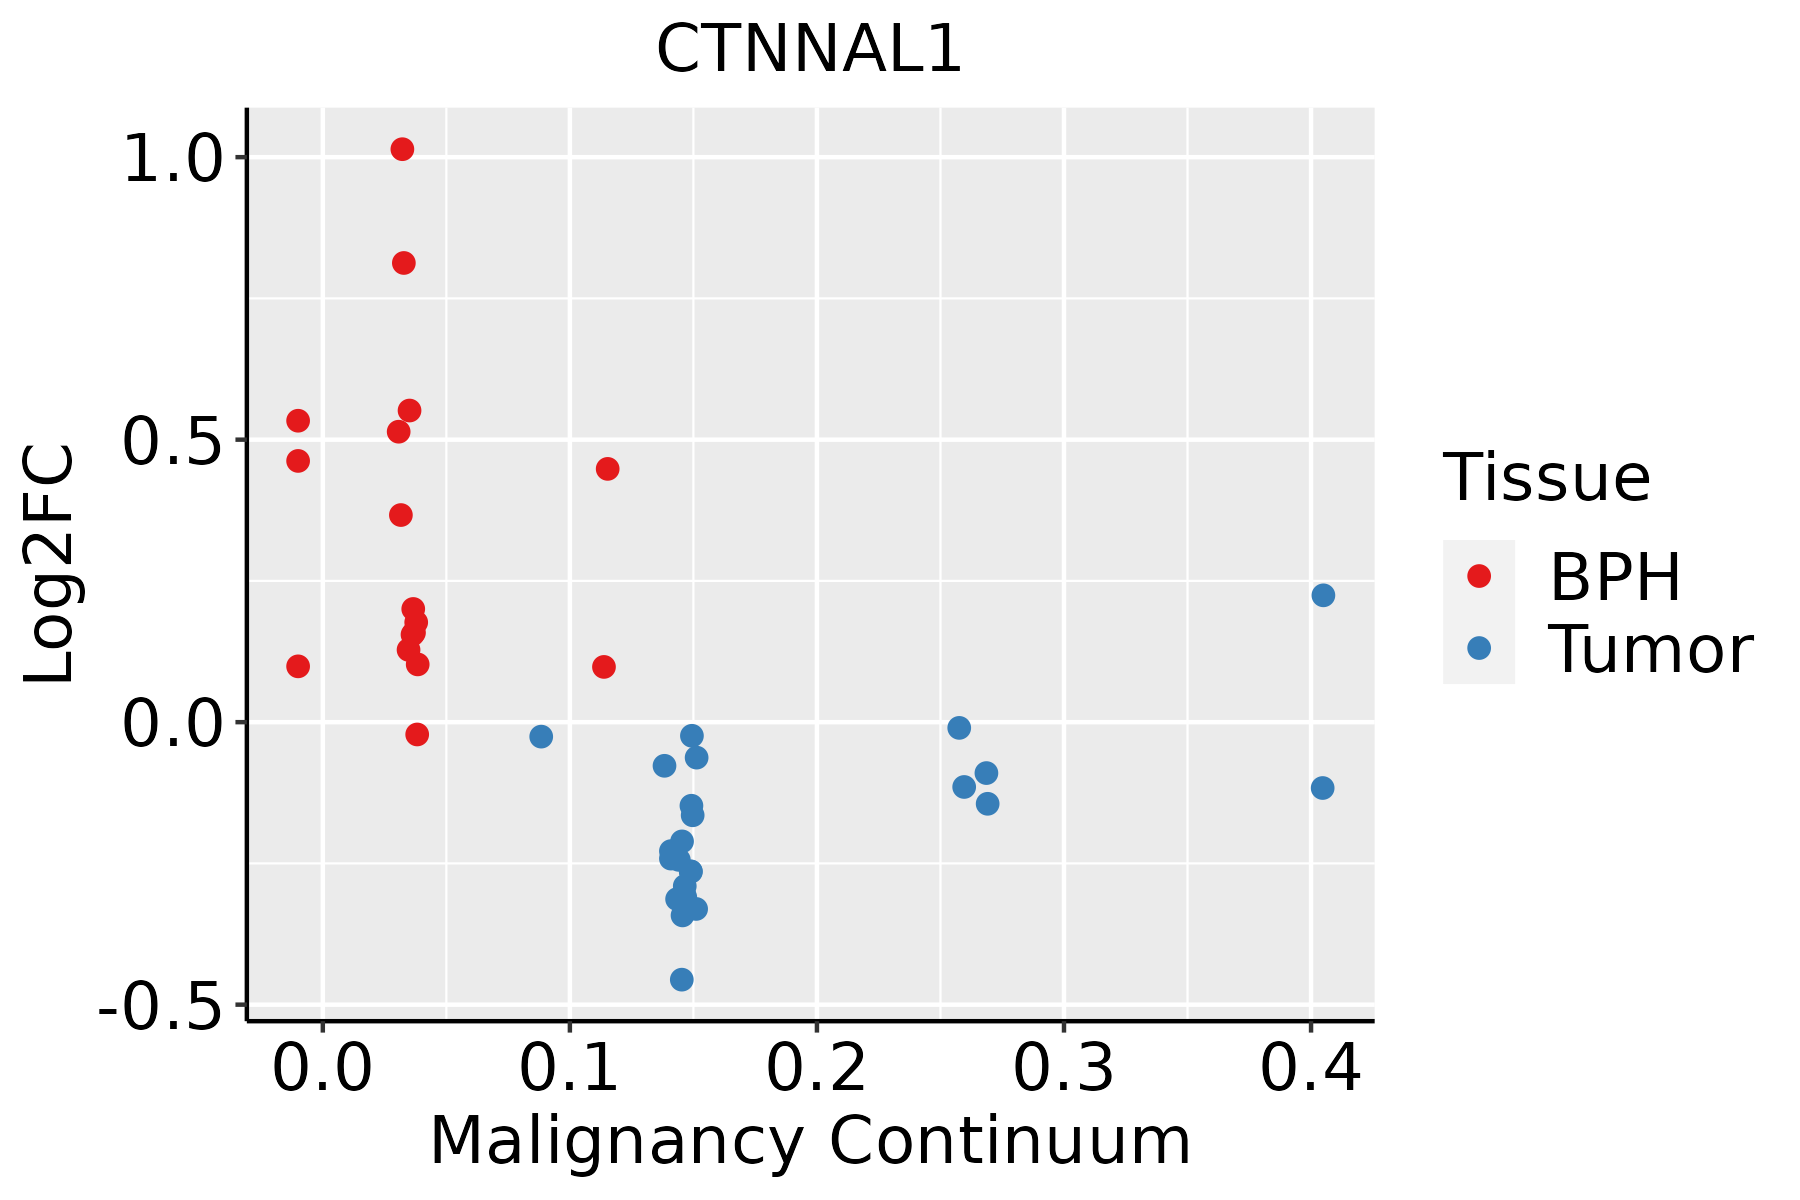 | BPH: Benign Prostatic Hyperplasia |
| Skin | 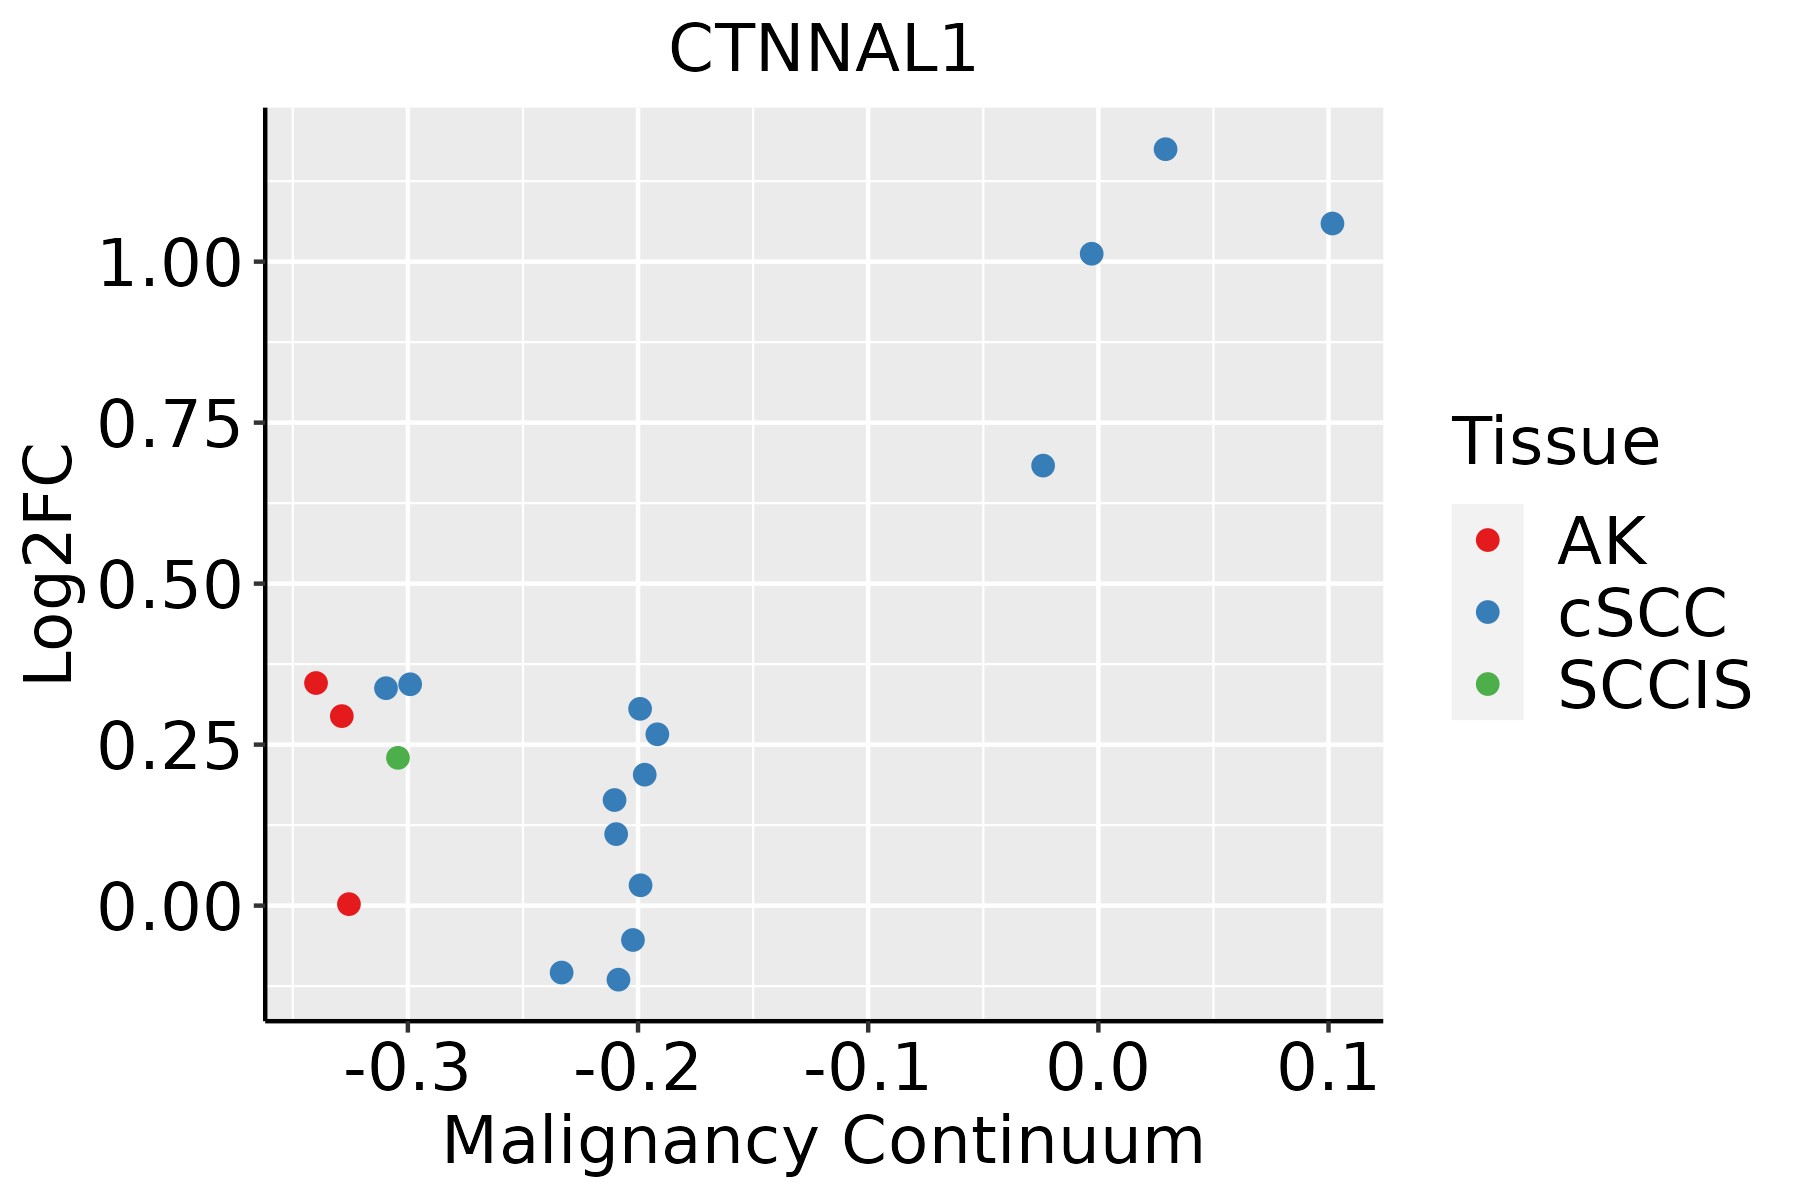 | AK: Actinic keratosis |
| cSCC: Cutaneous squamous cell carcinoma | ||
| SCCIS:squamous cell carcinoma in situ | ||
| Thyroid |  | ATC: Anaplastic thyroid cancer |
| HT: Hashimoto's thyroiditis | ||
| PTC: Papillary thyroid cancer |
| ∗log2FC in expression of this searched gene in stem-like cells from each diseased tissue sample relative to stem-like cells in normal samples in each tissue plotted against the malignancy continuum. Samples are colored based on if they are from different disease stage. |
Top |
Malignant transformation related pathway analysis |
| Find out the enriched GO biological processes and KEGG pathways involved in transition from healthy to precancer to cancer |
| Tissue | Disease Stage | Enriched GO biological Processes |
| Colorectum | AD |  |
| Colorectum | SER |  |
| Colorectum | MSS |  |
| Colorectum | MSI-H |  |
| Colorectum | FAP |  |
| ∗Top 15 enriched GO BP terms are showed in the bar plot of each disease state in each tissue. Each row represents a significant GO biological process which is colored according to the -log10(p.adjust). |
| Page: 1 2 3 4 5 6 7 8 9 |
| GO ID | Tissue | Disease Stage | Description | Gene Ratio | Bg Ratio | pvalue | p.adjust | Count |
| GO:000726510 | Esophagus | ESCC | Ras protein signal transduction | 201/8552 | 337/18723 | 1.44e-07 | 2.30e-06 | 201 |
| GO:000726610 | Esophagus | ESCC | Rho protein signal transduction | 81/8552 | 137/18723 | 1.03e-03 | 5.20e-03 | 81 |
| GO:000726521 | Liver | HCC | Ras protein signal transduction | 187/7958 | 337/18723 | 8.89e-07 | 1.35e-05 | 187 |
| GO:000726621 | Liver | HCC | Rho protein signal transduction | 76/7958 | 137/18723 | 1.46e-03 | 7.75e-03 | 76 |
| GO:00072659 | Oral cavity | OSCC | Ras protein signal transduction | 185/7305 | 337/18723 | 1.95e-09 | 4.60e-08 | 185 |
| GO:00072669 | Oral cavity | OSCC | Rho protein signal transduction | 76/7305 | 137/18723 | 6.64e-05 | 5.37e-04 | 76 |
| GO:00072658 | Prostate | BPH | Ras protein signal transduction | 101/3107 | 337/18723 | 5.64e-10 | 2.79e-08 | 101 |
| GO:00072668 | Prostate | BPH | Rho protein signal transduction | 39/3107 | 137/18723 | 3.37e-04 | 2.53e-03 | 39 |
| GO:000726514 | Prostate | Tumor | Ras protein signal transduction | 101/3246 | 337/18723 | 6.29e-09 | 2.44e-07 | 101 |
| GO:000726614 | Prostate | Tumor | Rho protein signal transduction | 39/3246 | 137/18723 | 8.18e-04 | 5.53e-03 | 39 |
| GO:000726516 | Skin | AK | Ras protein signal transduction | 68/1910 | 337/18723 | 2.83e-08 | 1.57e-06 | 68 |
| GO:000726616 | Skin | AK | Rho protein signal transduction | 31/1910 | 137/18723 | 1.60e-05 | 3.09e-04 | 31 |
| GO:000726523 | Skin | cSCC | Ras protein signal transduction | 132/4864 | 337/18723 | 6.17e-08 | 1.57e-06 | 132 |
| GO:000726617 | Skin | cSCC | Rho protein signal transduction | 51/4864 | 137/18723 | 2.38e-03 | 1.38e-02 | 51 |
| GO:000726518 | Thyroid | HT | Ras protein signal transduction | 35/1272 | 337/18723 | 8.17e-03 | 4.76e-02 | 35 |
| GO:000726519 | Thyroid | PTC | Ras protein signal transduction | 162/5968 | 337/18723 | 3.16e-10 | 1.02e-08 | 162 |
| GO:000726618 | Thyroid | PTC | Rho protein signal transduction | 68/5968 | 137/18723 | 1.09e-05 | 1.21e-04 | 68 |
| GO:000726524 | Thyroid | ATC | Ras protein signal transduction | 172/6293 | 337/18723 | 2.25e-11 | 7.96e-10 | 172 |
| GO:000726619 | Thyroid | ATC | Rho protein signal transduction | 73/6293 | 137/18723 | 1.58e-06 | 1.93e-05 | 73 |
| Page: 1 |
| Pathway ID | Tissue | Disease Stage | Description | Gene Ratio | Bg Ratio | pvalue | p.adjust | qvalue | Count |
| Page: 1 |
Top |
Cell-cell communication analysis |
| Identification of potential cell-cell interactions between two cell types and their ligand-receptor pairs for different disease states |
| Ligand | Receptor | LRpair | Pathway | Tissue | Disease Stage |
| Page: 1 |
Top |
Single-cell gene regulatory network inference analysis |
| Find out the significant the regulons (TFs) and the target genes of each regulon across cell types for different disease states |
| TF | Cell Type | Tissue | Disease Stage | Target Gene | RSS | Regulon Activity |
| ∗The dot plots of a searched regulon are shown for all cell subpopulations in each disease state of each tissue based on the regulon specific score inferred using pySCENIC and by calculating the average expression. |
| Page: 1 |
Top |
Somatic mutation of malignant transformation related genes |
| Annotation of somatic variants for genes involved in malignant transformation |
| Hugo Symbol | Variant Class | Variant Classification | dbSNP RS | HGVSc | HGVSp | HGVSp Short | SWISSPROT | BIOTYPE | SIFT | PolyPhen | Tumor Sample Barcode | Tissue | Histology | Sex | Age | Stage | Therapy Types | Drugs | Outcome |
| CTNNAL1 | SNV | Missense_Mutation | c.1202C>A | p.Ala401Glu | p.A401E | Q9UBT7 | protein_coding | deleterious(0) | probably_damaging(0.999) | TCGA-E2-A15K-06 | Breast | breast invasive carcinoma | Female | <65 | I/II | Chemotherapy | adriamycin | SD | |
| CTNNAL1 | SNV | Missense_Mutation | c.124N>G | p.Leu42Val | p.L42V | Q9UBT7 | protein_coding | tolerated(1) | benign(0.003) | TCGA-E9-A243-01 | Breast | breast invasive carcinoma | Female | <65 | I/II | Chemotherapy | 5-fluorouracil | PD | |
| CTNNAL1 | SNV | Missense_Mutation | c.1317N>T | p.Lys439Asn | p.K439N | Q9UBT7 | protein_coding | deleterious(0.01) | probably_damaging(0.918) | TCGA-E9-A24A-01 | Breast | breast invasive carcinoma | Female | >=65 | I/II | Hormone Therapy | tamoxiphen | SD | |
| CTNNAL1 | SNV | Missense_Mutation | c.1583G>A | p.Gly528Glu | p.G528E | Q9UBT7 | protein_coding | deleterious(0) | probably_damaging(0.941) | TCGA-GM-A2D9-01 | Breast | breast invasive carcinoma | Female | >=65 | I/II | Hormone Therapy | arimidex | SD | |
| CTNNAL1 | deletion | Frame_Shift_Del | novel | c.786delT | p.Phe262LeufsTer4 | p.F262Lfs*4 | Q9UBT7 | protein_coding | TCGA-EW-A2FV-01 | Breast | breast invasive carcinoma | Female | <65 | III/IV | Chemotherapy | docetaxel | SD | ||
| CTNNAL1 | deletion | Frame_Shift_Del | novel | c.344delC | p.Ala115GlufsTer6 | p.A115Efs*6 | Q9UBT7 | protein_coding | TCGA-EW-A2FV-01 | Breast | breast invasive carcinoma | Female | <65 | III/IV | Chemotherapy | docetaxel | SD | ||
| CTNNAL1 | SNV | Missense_Mutation | novel | c.781N>A | p.Val261Ile | p.V261I | Q9UBT7 | protein_coding | deleterious(0) | probably_damaging(0.994) | TCGA-2W-A8YY-01 | Cervix | cervical & endocervical cancer | Female | <65 | I/II | Chemotherapy | cisplatin | CR |
| CTNNAL1 | SNV | Missense_Mutation | rs774871628 | c.820N>C | p.Glu274Gln | p.E274Q | Q9UBT7 | protein_coding | tolerated(0.29) | probably_damaging(0.961) | TCGA-C5-A1BL-01 | Cervix | cervical & endocervical cancer | Female | <65 | I/II | Unknown | Unknown | SD |
| CTNNAL1 | SNV | Missense_Mutation | c.886N>T | p.Ile296Phe | p.I296F | Q9UBT7 | protein_coding | tolerated(0.07) | probably_damaging(0.998) | TCGA-AA-3833-01 | Colorectum | colon adenocarcinoma | Female | <65 | I/II | Unknown | Unknown | SD | |
| CTNNAL1 | SNV | Missense_Mutation | rs749689146 | c.1817C>T | p.Ser606Phe | p.S606F | Q9UBT7 | protein_coding | deleterious(0) | possibly_damaging(0.899) | TCGA-AA-A010-01 | Colorectum | colon adenocarcinoma | Female | <65 | I/II | Chemotherapy | folinic | CR |
| Page: 1 2 3 4 5 6 7 8 |
Top |
Related drugs of malignant transformation related genes |
| Identification of chemicals and drugs interact with genes involved in malignant transfromation |
| (DGIdb 4.0) |
| Entrez ID | Symbol | Category | Interaction Types | Drug Claim Name | Drug Name | PMIDs |
| Page: 1 |

Copyright 2023-Present -The University of Texas Health Science Center at Houston |