| GO ID | Tissue | Disease Stage | Description | Gene Ratio | Bg Ratio | pvalue | p.adjust | Count |
| GO:0007015 | Colorectum | AD | actin filament organization | 167/3918 | 442/18723 | 1.65e-16 | 7.94e-14 | 167 |
| GO:0032535 | Colorectum | AD | regulation of cellular component size | 142/3918 | 383/18723 | 1.74e-13 | 3.41e-11 | 142 |
| GO:1902903 | Colorectum | AD | regulation of supramolecular fiber organization | 139/3918 | 383/18723 | 2.01e-12 | 3.19e-10 | 139 |
| GO:0032970 | Colorectum | AD | regulation of actin filament-based process | 142/3918 | 397/18723 | 4.05e-12 | 5.90e-10 | 142 |
| GO:0110053 | Colorectum | AD | regulation of actin filament organization | 108/3918 | 278/18723 | 5.02e-12 | 6.98e-10 | 108 |
| GO:0008154 | Colorectum | AD | actin polymerization or depolymerization | 90/3918 | 218/18723 | 6.14e-12 | 8.23e-10 | 90 |
| GO:0032271 | Colorectum | AD | regulation of protein polymerization | 94/3918 | 233/18723 | 1.01e-11 | 1.29e-09 | 94 |
| GO:0030041 | Colorectum | AD | actin filament polymerization | 81/3918 | 191/18723 | 1.35e-11 | 1.69e-09 | 81 |
| GO:0051258 | Colorectum | AD | protein polymerization | 112/3918 | 297/18723 | 1.85e-11 | 2.27e-09 | 112 |
| GO:0043254 | Colorectum | AD | regulation of protein-containing complex assembly | 148/3918 | 428/18723 | 2.64e-11 | 3.18e-09 | 148 |
| GO:0008064 | Colorectum | AD | regulation of actin polymerization or depolymerization | 79/3918 | 188/18723 | 4.17e-11 | 4.74e-09 | 79 |
| GO:0030833 | Colorectum | AD | regulation of actin filament polymerization | 74/3918 | 172/18723 | 4.50e-11 | 5.03e-09 | 74 |
| GO:0030832 | Colorectum | AD | regulation of actin filament length | 79/3918 | 189/18723 | 5.71e-11 | 6.27e-09 | 79 |
| GO:1902905 | Colorectum | AD | positive regulation of supramolecular fiber organization | 85/3918 | 209/18723 | 5.95e-11 | 6.33e-09 | 85 |
| GO:0032956 | Colorectum | AD | regulation of actin cytoskeleton organization | 127/3918 | 358/18723 | 1.03e-10 | 1.04e-08 | 127 |
| GO:0051495 | Colorectum | AD | positive regulation of cytoskeleton organization | 89/3918 | 226/18723 | 1.61e-10 | 1.56e-08 | 89 |
| GO:0032273 | Colorectum | AD | positive regulation of protein polymerization | 62/3918 | 138/18723 | 1.94e-10 | 1.76e-08 | 62 |
| GO:0031334 | Colorectum | AD | positive regulation of protein-containing complex assembly | 91/3918 | 237/18723 | 4.78e-10 | 3.99e-08 | 91 |
| GO:0030838 | Colorectum | AD | positive regulation of actin filament polymerization | 48/3918 | 99/18723 | 9.21e-10 | 7.03e-08 | 48 |
| GO:0010639 | Colorectum | AD | negative regulation of organelle organization | 114/3918 | 348/18723 | 1.41e-07 | 6.49e-06 | 114 |
| Pathway ID | Tissue | Disease Stage | Description | Gene Ratio | Bg Ratio | pvalue | p.adjust | qvalue | Count |
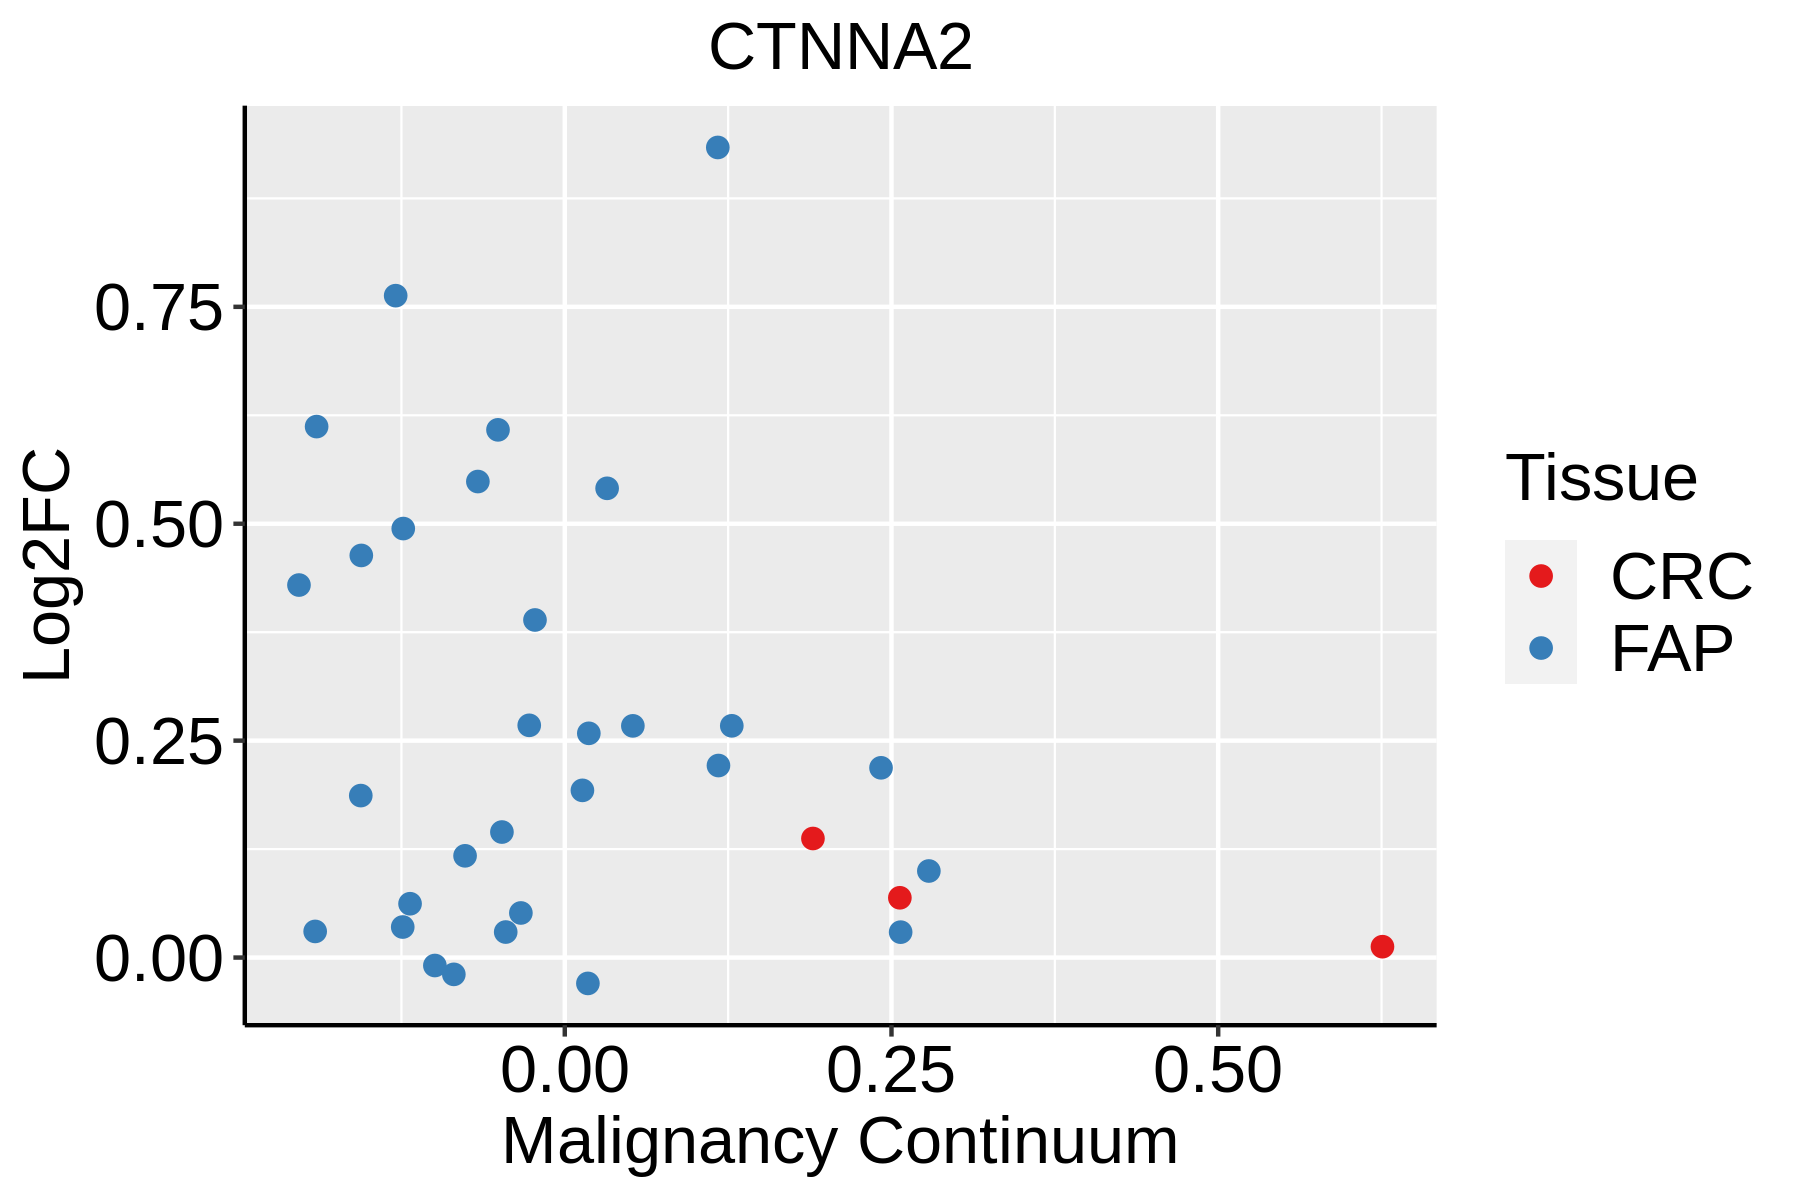
| hsa05100 | Colorectum | AD | Bacterial invasion of epithelial cells | 44/2092 | 77/8465 | 1.13e-09 | 2.22e-08 | 1.42e-08 | 44 |
| hsa04520 | Colorectum | AD | Adherens junction | 50/2092 | 93/8465 | 1.52e-09 | 2.83e-08 | 1.81e-08 | 50 |
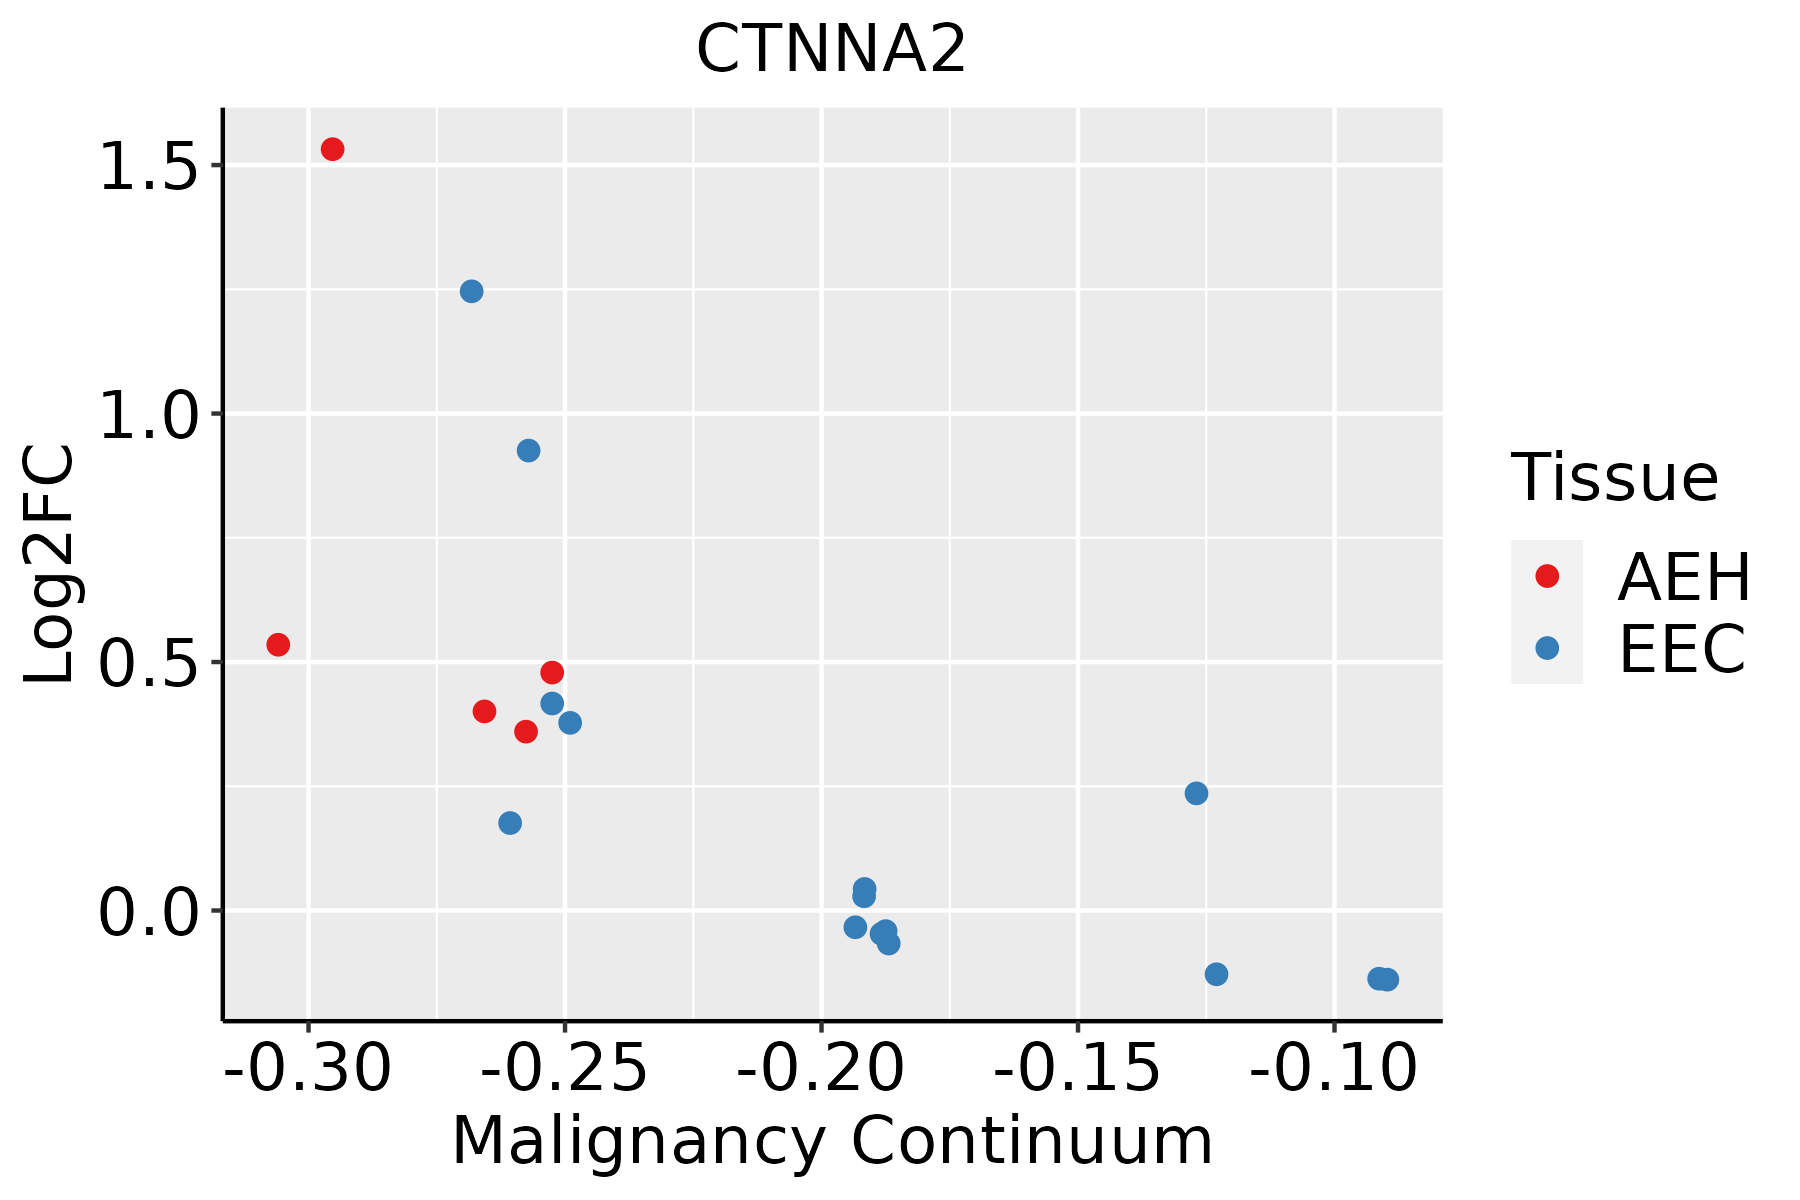
| hsa05213 | Colorectum | AD | Endometrial cancer | 29/2092 | 58/8465 | 2.69e-05 | 2.57e-04 | 1.64e-04 | 29 |
| hsa04670 | Colorectum | AD | Leukocyte transendothelial migration | 41/2092 | 114/8465 | 4.60e-03 | 2.20e-02 | 1.40e-02 | 41 |
| hsa051001 | Colorectum | AD | Bacterial invasion of epithelial cells | 44/2092 | 77/8465 | 1.13e-09 | 2.22e-08 | 1.42e-08 | 44 |
| hsa045201 | Colorectum | AD | Adherens junction | 50/2092 | 93/8465 | 1.52e-09 | 2.83e-08 | 1.81e-08 | 50 |
| hsa052131 | Colorectum | AD | Endometrial cancer | 29/2092 | 58/8465 | 2.69e-05 | 2.57e-04 | 1.64e-04 | 29 |
| hsa046701 | Colorectum | AD | Leukocyte transendothelial migration | 41/2092 | 114/8465 | 4.60e-03 | 2.20e-02 | 1.40e-02 | 41 |
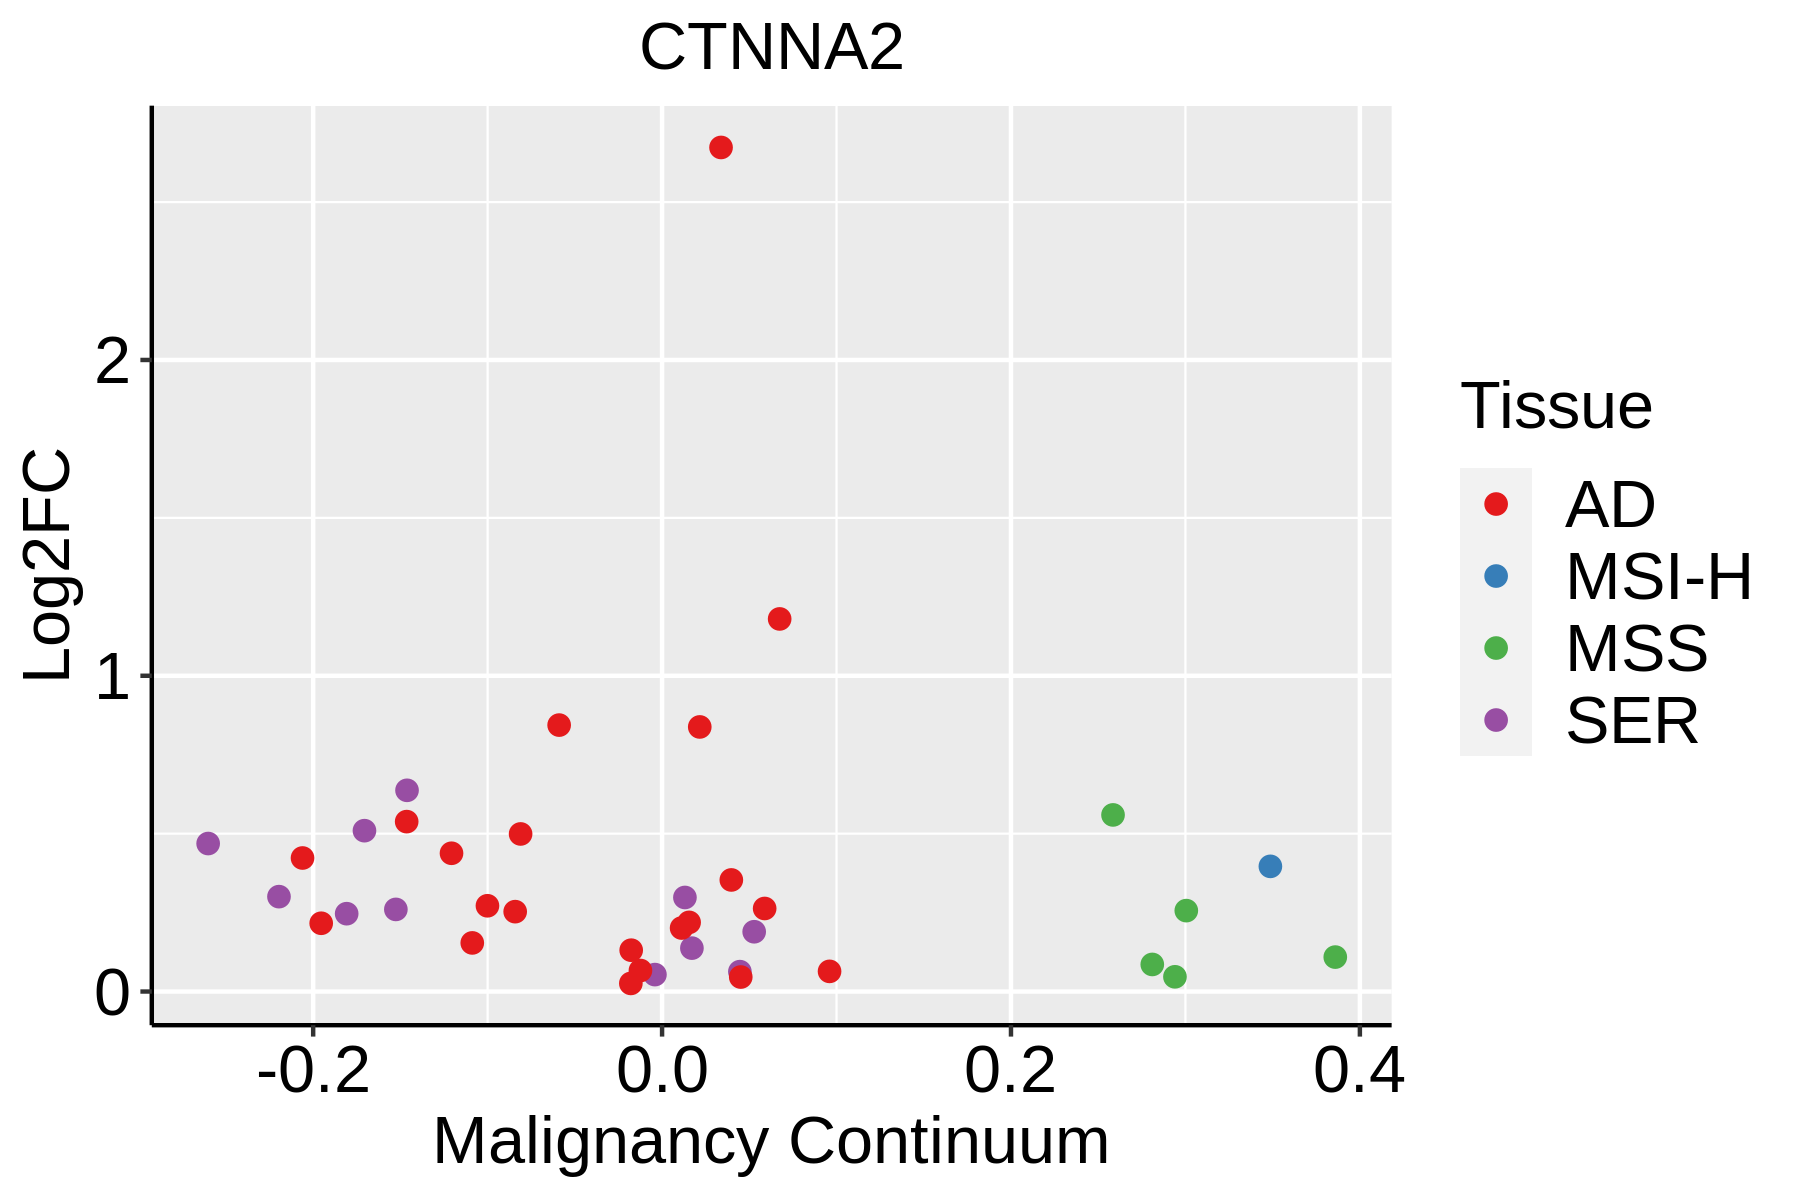
| hsa051002 | Colorectum | SER | Bacterial invasion of epithelial cells | 36/1580 | 77/8465 | 1.56e-08 | 3.45e-07 | 2.50e-07 | 36 |
| hsa045202 | Colorectum | SER | Adherens junction | 37/1580 | 93/8465 | 1.54e-06 | 2.35e-05 | 1.71e-05 | 37 |
| hsa046702 | Colorectum | SER | Leukocyte transendothelial migration | 37/1580 | 114/8465 | 2.77e-04 | 2.56e-03 | 1.86e-03 | 37 |
| hsa052132 | Colorectum | SER | Endometrial cancer | 20/1580 | 58/8465 | 3.05e-03 | 2.11e-02 | 1.53e-02 | 20 |
| hsa051003 | Colorectum | SER | Bacterial invasion of epithelial cells | 36/1580 | 77/8465 | 1.56e-08 | 3.45e-07 | 2.50e-07 | 36 |
| hsa045203 | Colorectum | SER | Adherens junction | 37/1580 | 93/8465 | 1.54e-06 | 2.35e-05 | 1.71e-05 | 37 |
| hsa046703 | Colorectum | SER | Leukocyte transendothelial migration | 37/1580 | 114/8465 | 2.77e-04 | 2.56e-03 | 1.86e-03 | 37 |
| hsa052133 | Colorectum | SER | Endometrial cancer | 20/1580 | 58/8465 | 3.05e-03 | 2.11e-02 | 1.53e-02 | 20 |
| hsa045204 | Colorectum | MSS | Adherens junction | 42/1875 | 93/8465 | 6.18e-07 | 9.01e-06 | 5.52e-06 | 42 |
| hsa051004 | Colorectum | MSS | Bacterial invasion of epithelial cells | 36/1875 | 77/8465 | 1.41e-06 | 1.82e-05 | 1.11e-05 | 36 |
| hsa052134 | Colorectum | MSS | Endometrial cancer | 27/1875 | 58/8465 | 3.18e-05 | 3.23e-04 | 1.98e-04 | 27 |
| hsa04390 | Colorectum | MSS | Hippo signaling pathway | 48/1875 | 157/8465 | 8.32e-03 | 3.10e-02 | 1.90e-02 | 48 |
| Hugo Symbol | Variant Class | Variant Classification | dbSNP RS | HGVSc | HGVSp | HGVSp Short | SWISSPROT | BIOTYPE | SIFT | PolyPhen | Tumor Sample Barcode | Tissue | Histology | Sex | Age | Stage | Therapy Types | Drugs | Outcome |
| CTNNA2 | SNV | Missense_Mutation | rs778479901 | c.1756G>A | p.Ala586Thr | p.A586T | P26232 | protein_coding | tolerated(0.53) | benign(0.079) | TCGA-A2-A0YM-01 | Breast | breast invasive carcinoma | Female | >=65 | I/II | Unknown | Unknown | SD |
| CTNNA2 | SNV | Missense_Mutation | | c.902N>T | p.Pro301Leu | p.P301L | P26232 | protein_coding | deleterious(0) | probably_damaging(0.956) | TCGA-A8-A07P-01 | Breast | breast invasive carcinoma | Female | >=65 | I/II | Chemotherapy | 5-fluorouracil | SD |
| CTNNA2 | SNV | Missense_Mutation | | c.1498G>C | p.Val500Leu | p.V500L | P26232 | protein_coding | tolerated(0.14) | benign(0.275) | TCGA-AO-A1KR-01 | Breast | breast invasive carcinoma | Female | <65 | I/II | Chemotherapy | cyclophosphamide | SD |
| CTNNA2 | SNV | Missense_Mutation | | c.2261N>T | p.Arg754Leu | p.R754L | P26232 | protein_coding | deleterious(0) | possibly_damaging(0.787) | TCGA-AR-A1AJ-01 | Breast | breast invasive carcinoma | Female | >=65 | I/II | Unknown | Unknown | SD |
| CTNNA2 | SNV | Missense_Mutation | rs529691509 | c.2792N>A | p.Arg931Gln | p.R931Q | P26232 | protein_coding | deleterious(0.04) | probably_damaging(0.957) | TCGA-AR-A5QN-01 | Breast | breast invasive carcinoma | Female | >=65 | III/IV | Chemotherapy | taxotere | SD |
| CTNNA2 | SNV | Missense_Mutation | | c.441G>A | p.Met147Ile | p.M147I | P26232 | protein_coding | tolerated(0.31) | benign(0.003) | TCGA-B6-A408-01 | Breast | breast invasive carcinoma | Female | <65 | III/IV | Chemotherapy | cyclophosphamide | SD |
| CTNNA2 | SNV | Missense_Mutation | | c.1081N>T | p.Pro361Ser | p.P361S | P26232 | protein_coding | tolerated(0.74) | benign(0.045) | TCGA-BH-A0BP-01 | Breast | breast invasive carcinoma | Female | >=65 | I/II | Unknown | Unknown | SD |
| CTNNA2 | SNV | Missense_Mutation | | c.1451N>C | p.Val484Ala | p.V484A | P26232 | protein_coding | tolerated(0.77) | benign(0.017) | TCGA-D8-A1JK-01 | Breast | breast invasive carcinoma | Female | >=65 | I/II | Unknown | Unknown | SD |
| CTNNA2 | SNV | Missense_Mutation | | c.578N>T | p.Arg193Ile | p.R193I | P26232 | protein_coding | deleterious(0) | probably_damaging(0.998) | TCGA-E2-A10C-01 | Breast | breast invasive carcinoma | Female | <65 | I/II | Chemotherapy | cytoxan | SD |
| CTNNA2 | SNV | Missense_Mutation | rs529691509 | c.2792G>A | p.Arg931Gln | p.R931Q | P26232 | protein_coding | deleterious(0.04) | probably_damaging(0.957) | TCGA-E9-A1R0-01 | Breast | breast invasive carcinoma | Female | <65 | I/II | Chemotherapy | cyclophosphamide | SD |