| Tissue | Expression Dynamics | Abbreviation |
| Cervix | 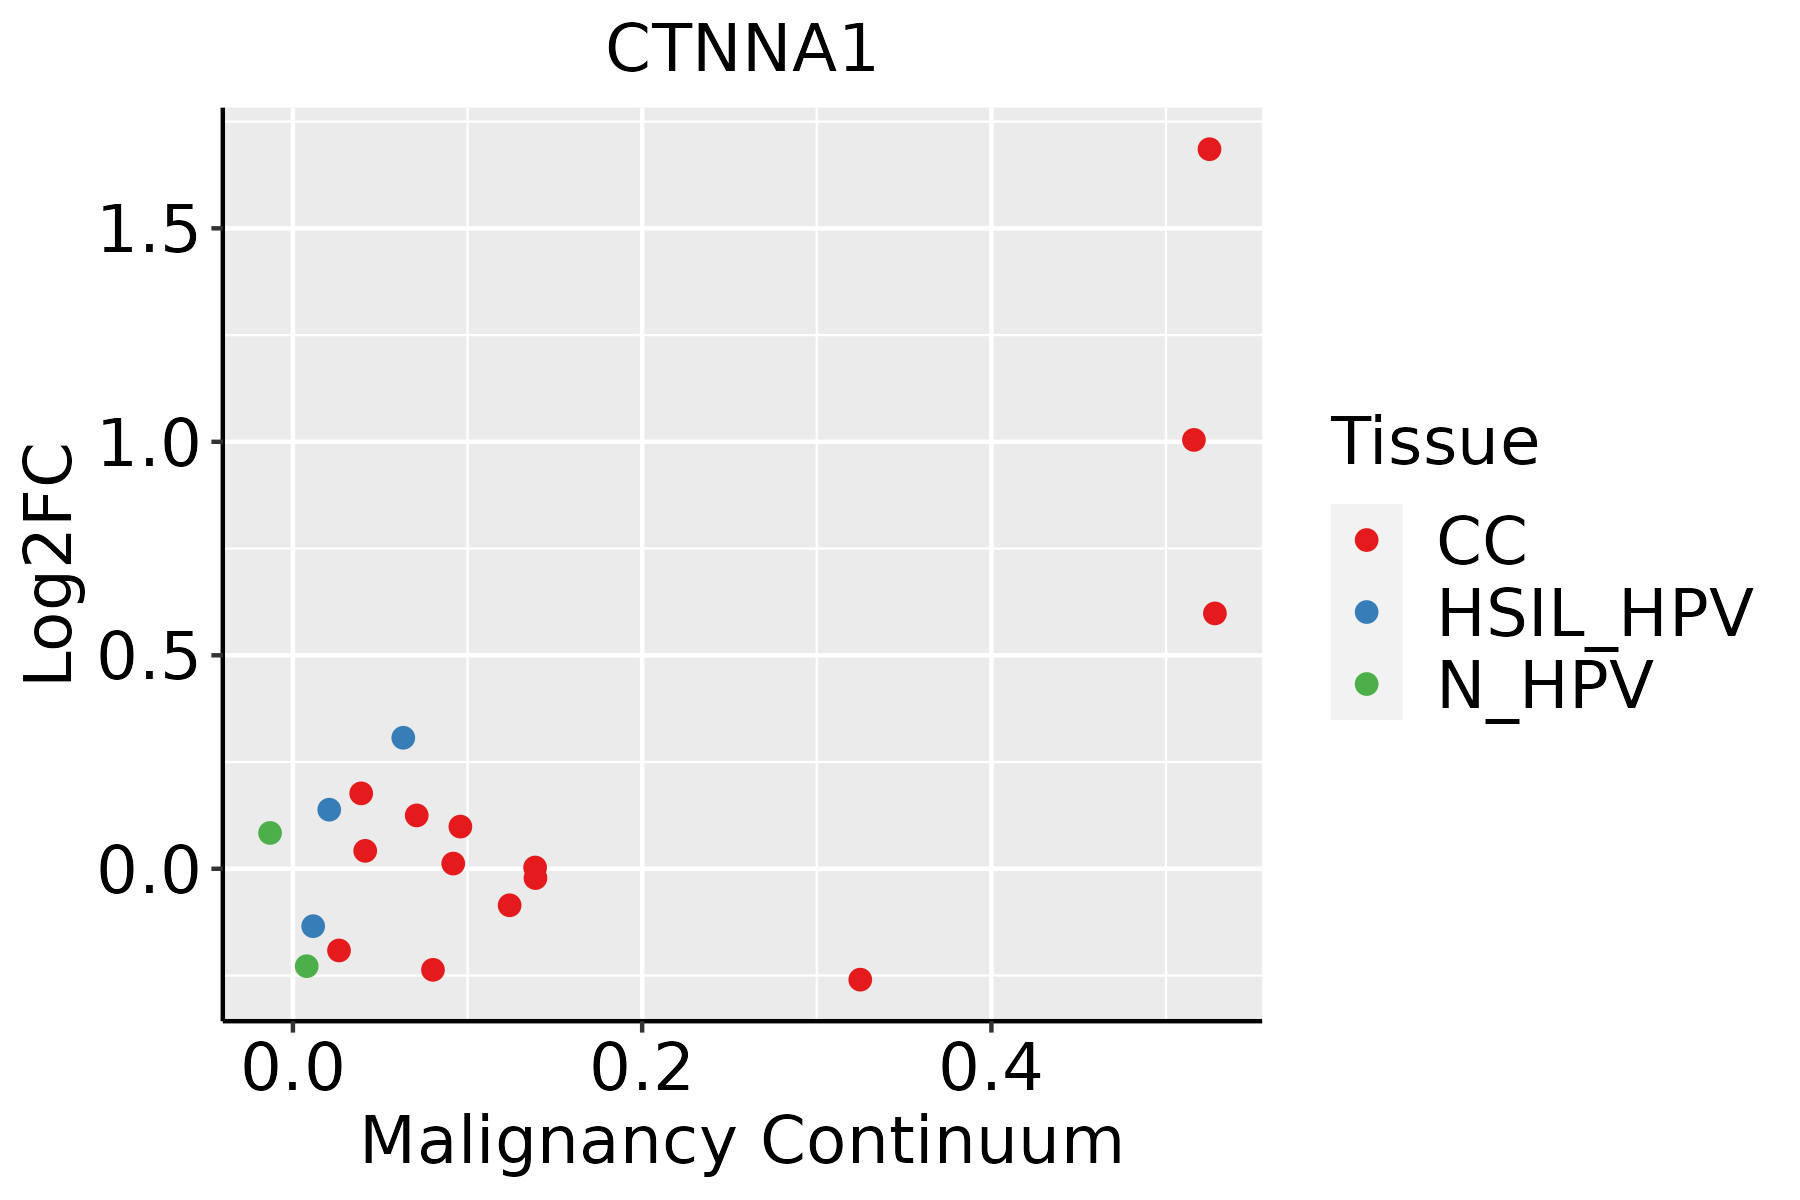 | CC: Cervix cancer |
| HSIL_HPV: HPV-infected high-grade squamous intraepithelial lesions |
| N_HPV: HPV-infected normal cervix |
| Colorectum (GSE201348) |  | FAP: Familial adenomatous polyposis |
| CRC: Colorectal cancer |
| Colorectum (HTA11) |  | AD: Adenomas |
| SER: Sessile serrated lesions |
| MSI-H: Microsatellite-high colorectal cancer |
| MSS: Microsatellite stable colorectal cancer |
| Endometrium | 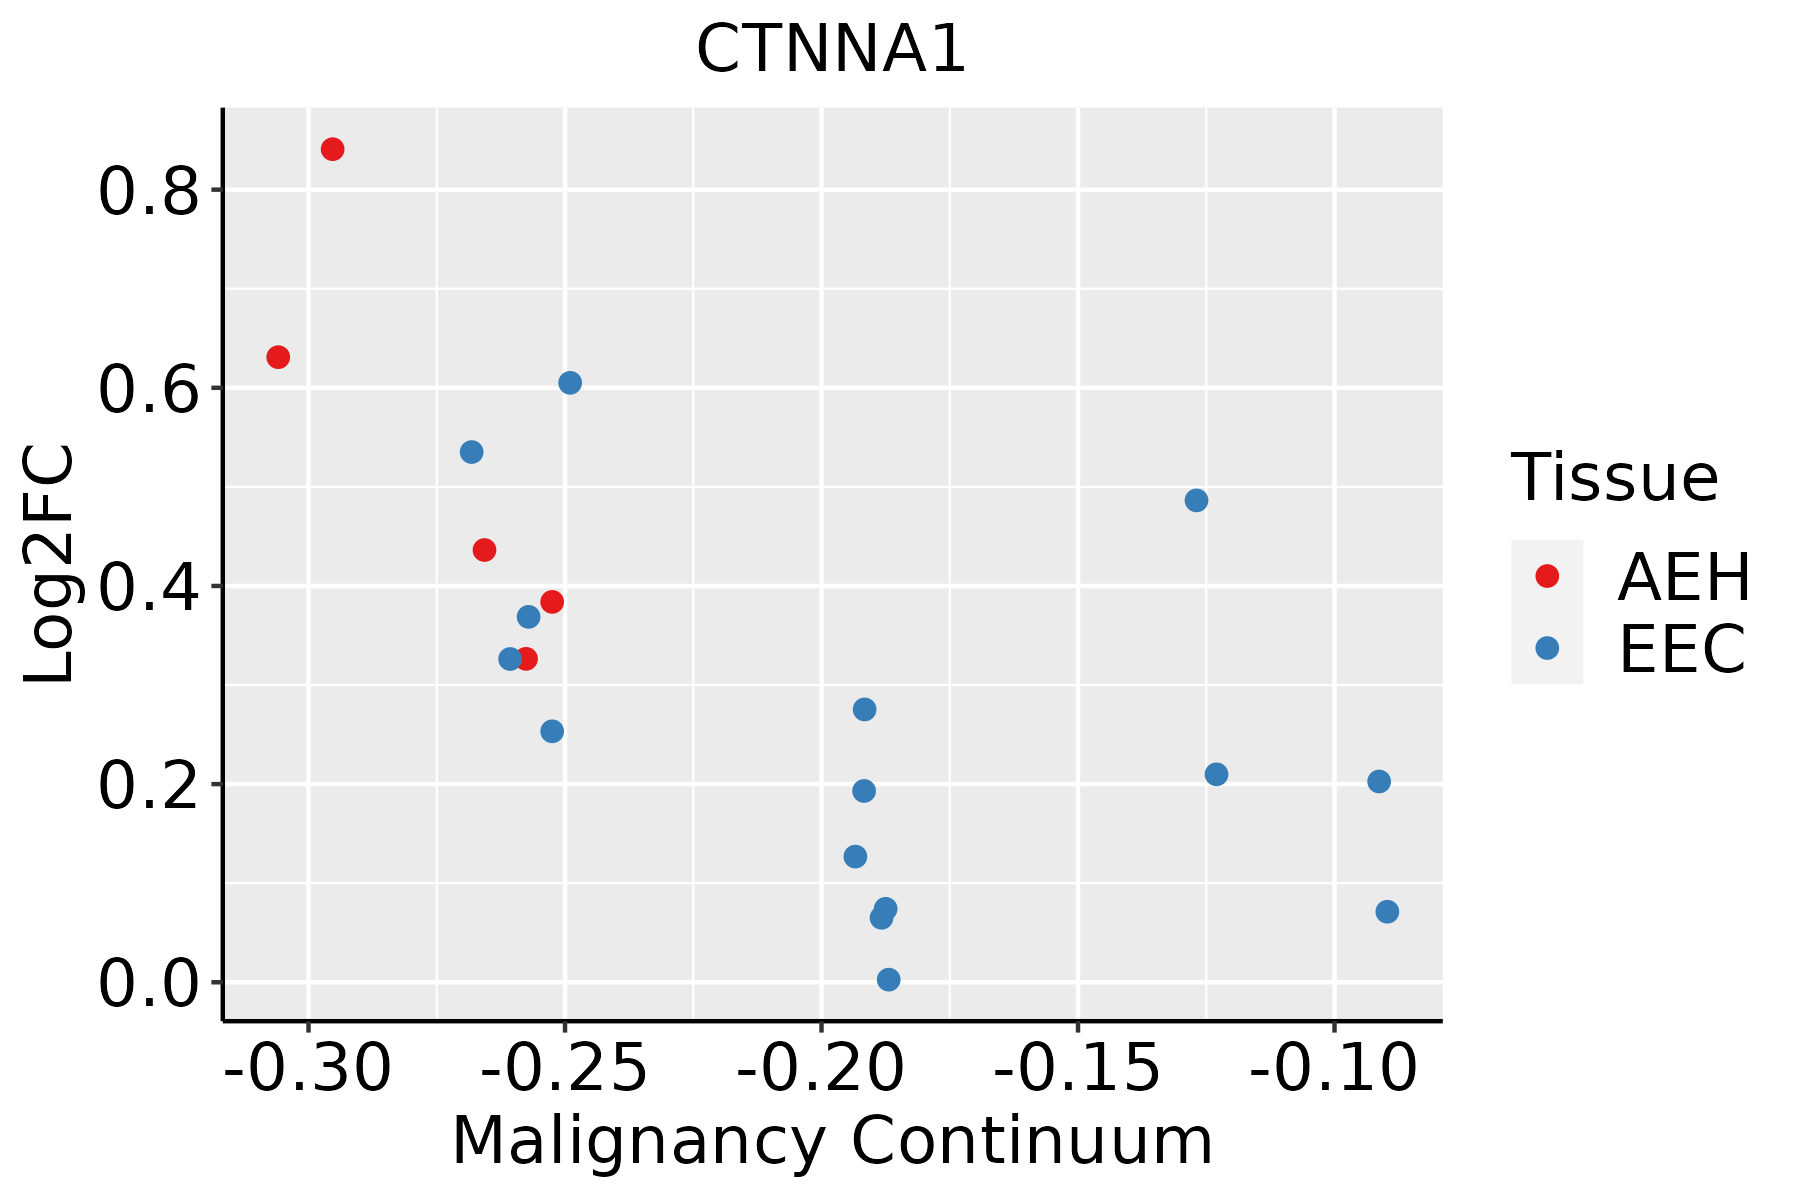 | AEH: Atypical endometrial hyperplasia |
| EEC: Endometrioid Cancer |
| Esophagus |  | ESCC: Esophageal squamous cell carcinoma |
| HGIN: High-grade intraepithelial neoplasias |
| LGIN: Low-grade intraepithelial neoplasias |
| Liver | 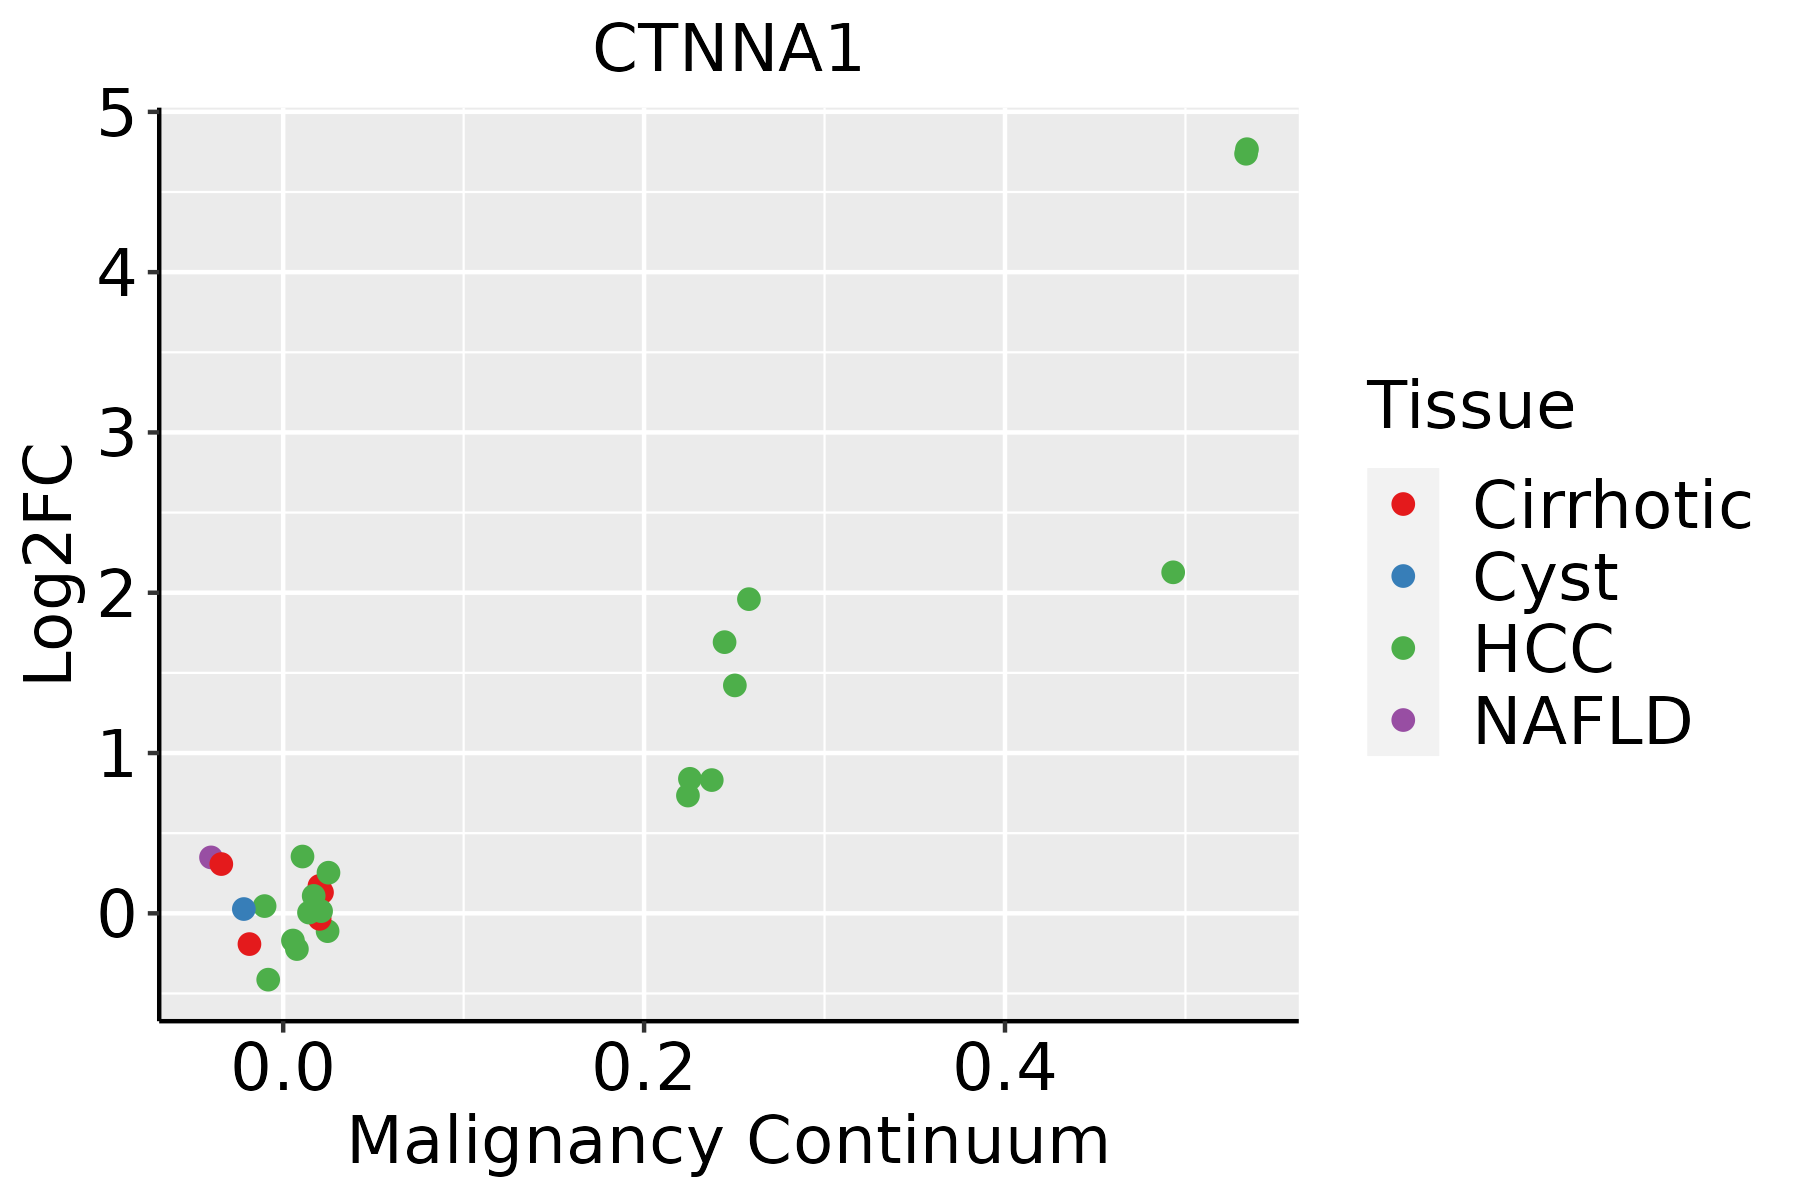 | HCC: Hepatocellular carcinoma |
| NAFLD: Non-alcoholic fatty liver disease |
| Lung | 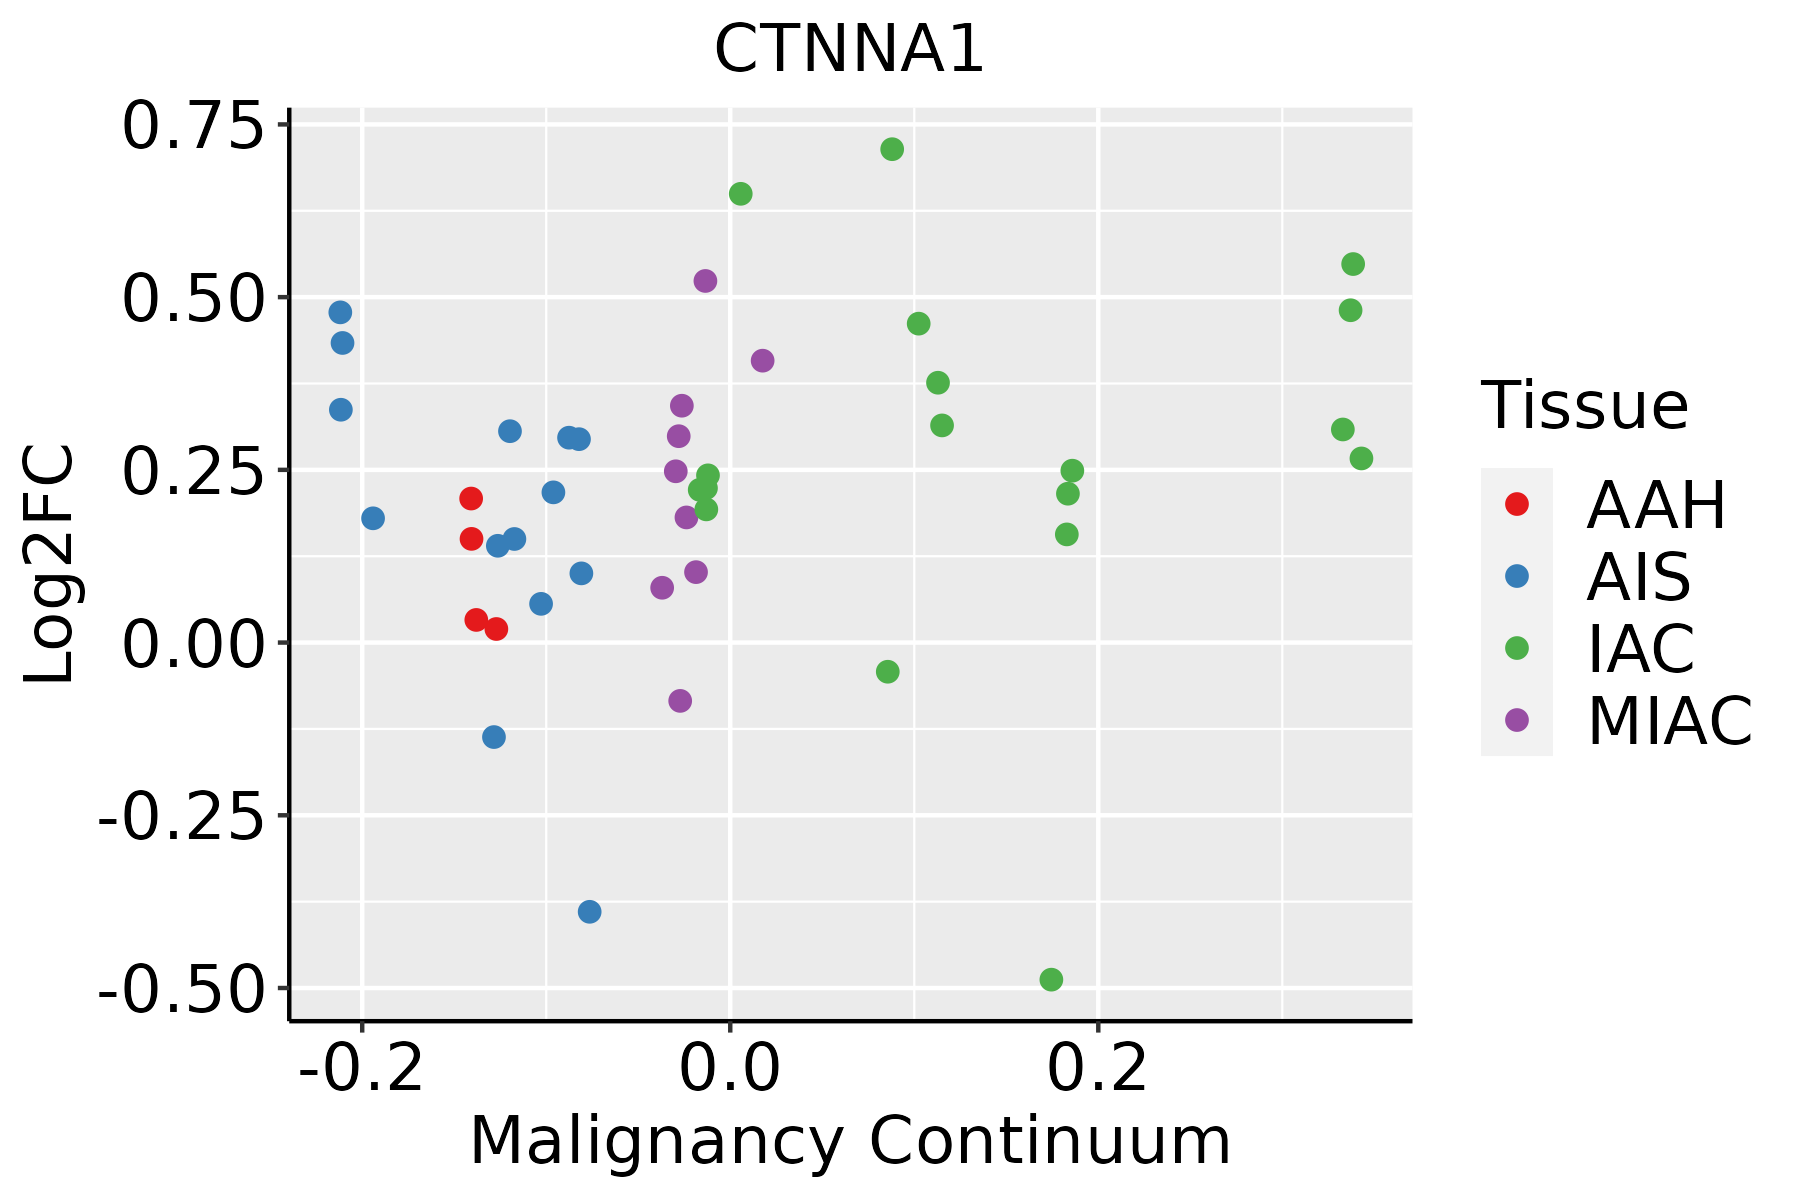 | AAH: Atypical adenomatous hyperplasia |
| AIS: Adenocarcinoma in situ |
| IAC: Invasive lung adenocarcinoma |
| MIA: Minimally invasive adenocarcinoma |
| Oral Cavity | 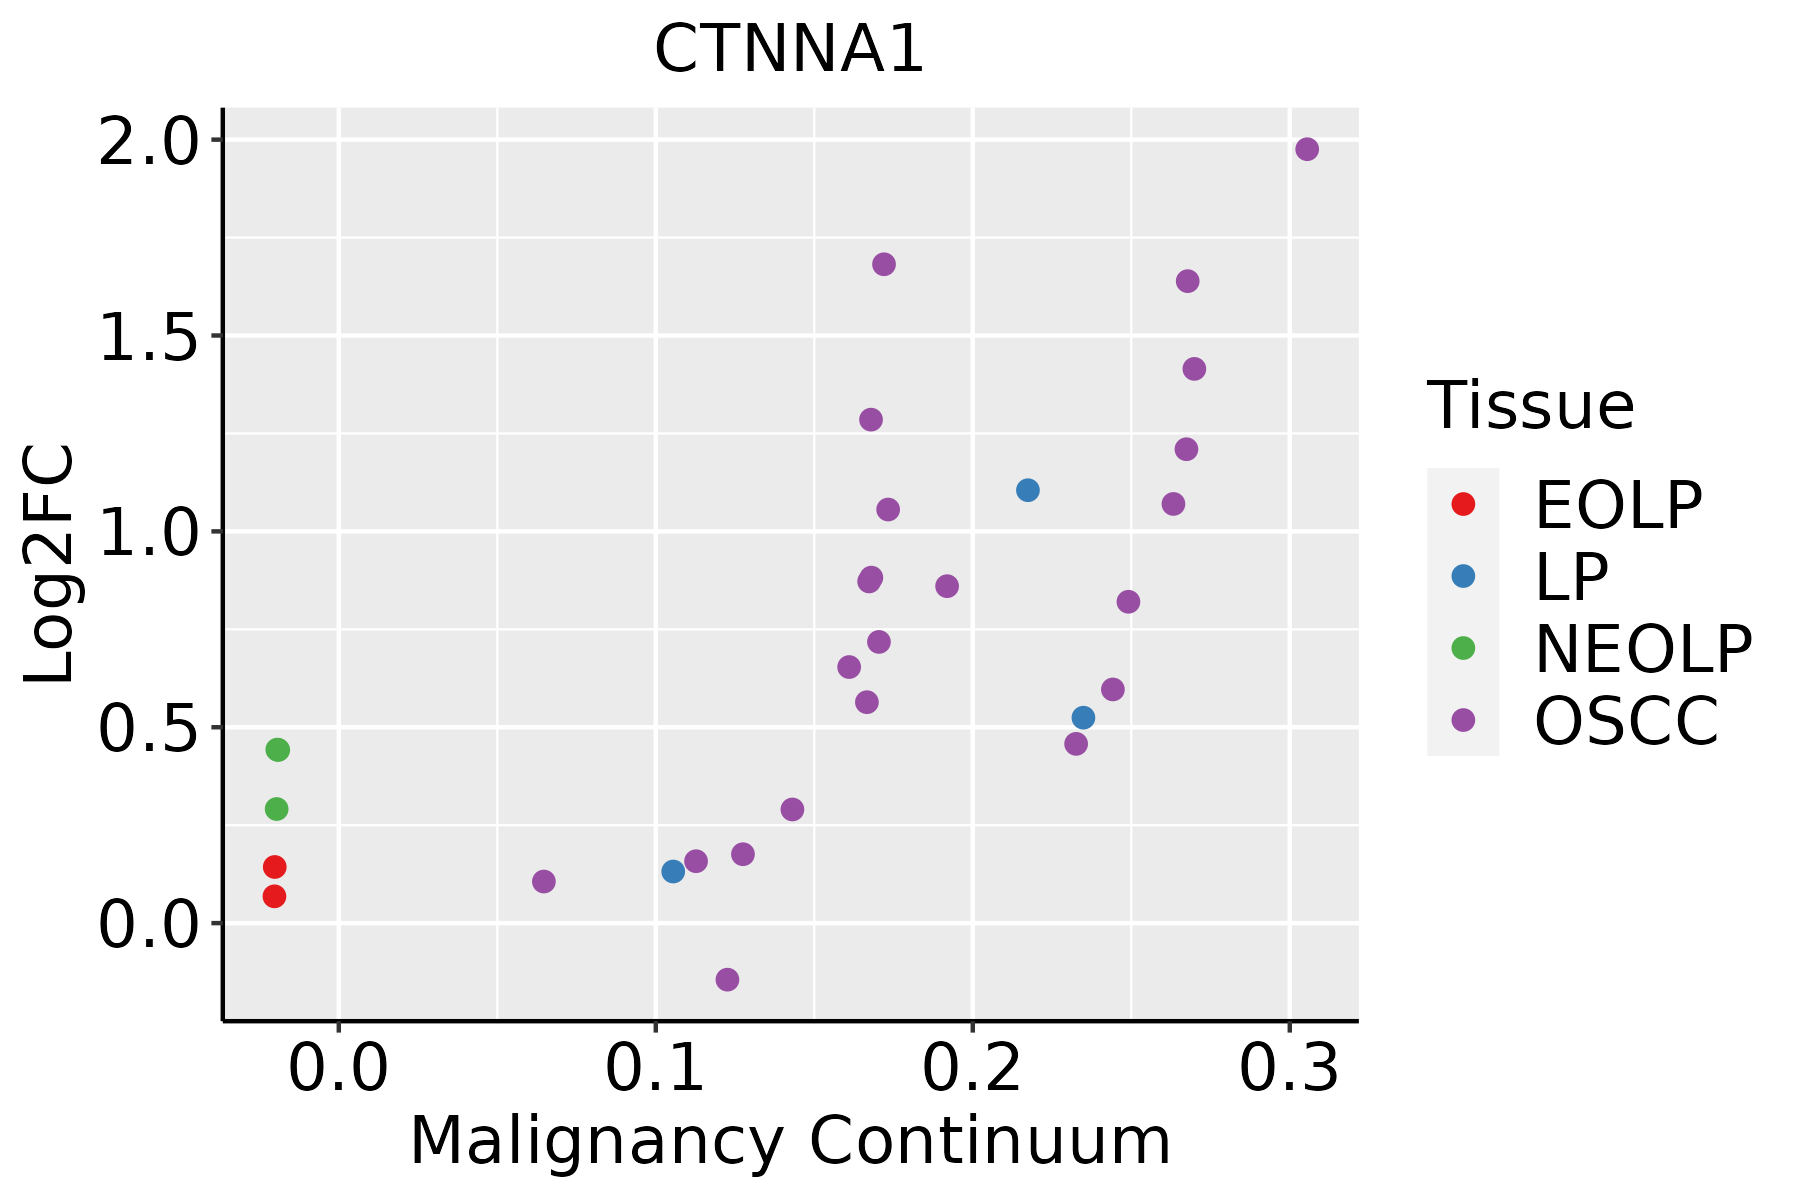 | EOLP: Erosive Oral lichen planus |
| LP: leukoplakia |
| NEOLP: Non-erosive oral lichen planus |
| OSCC: Oral squamous cell carcinoma |
| Prostate | 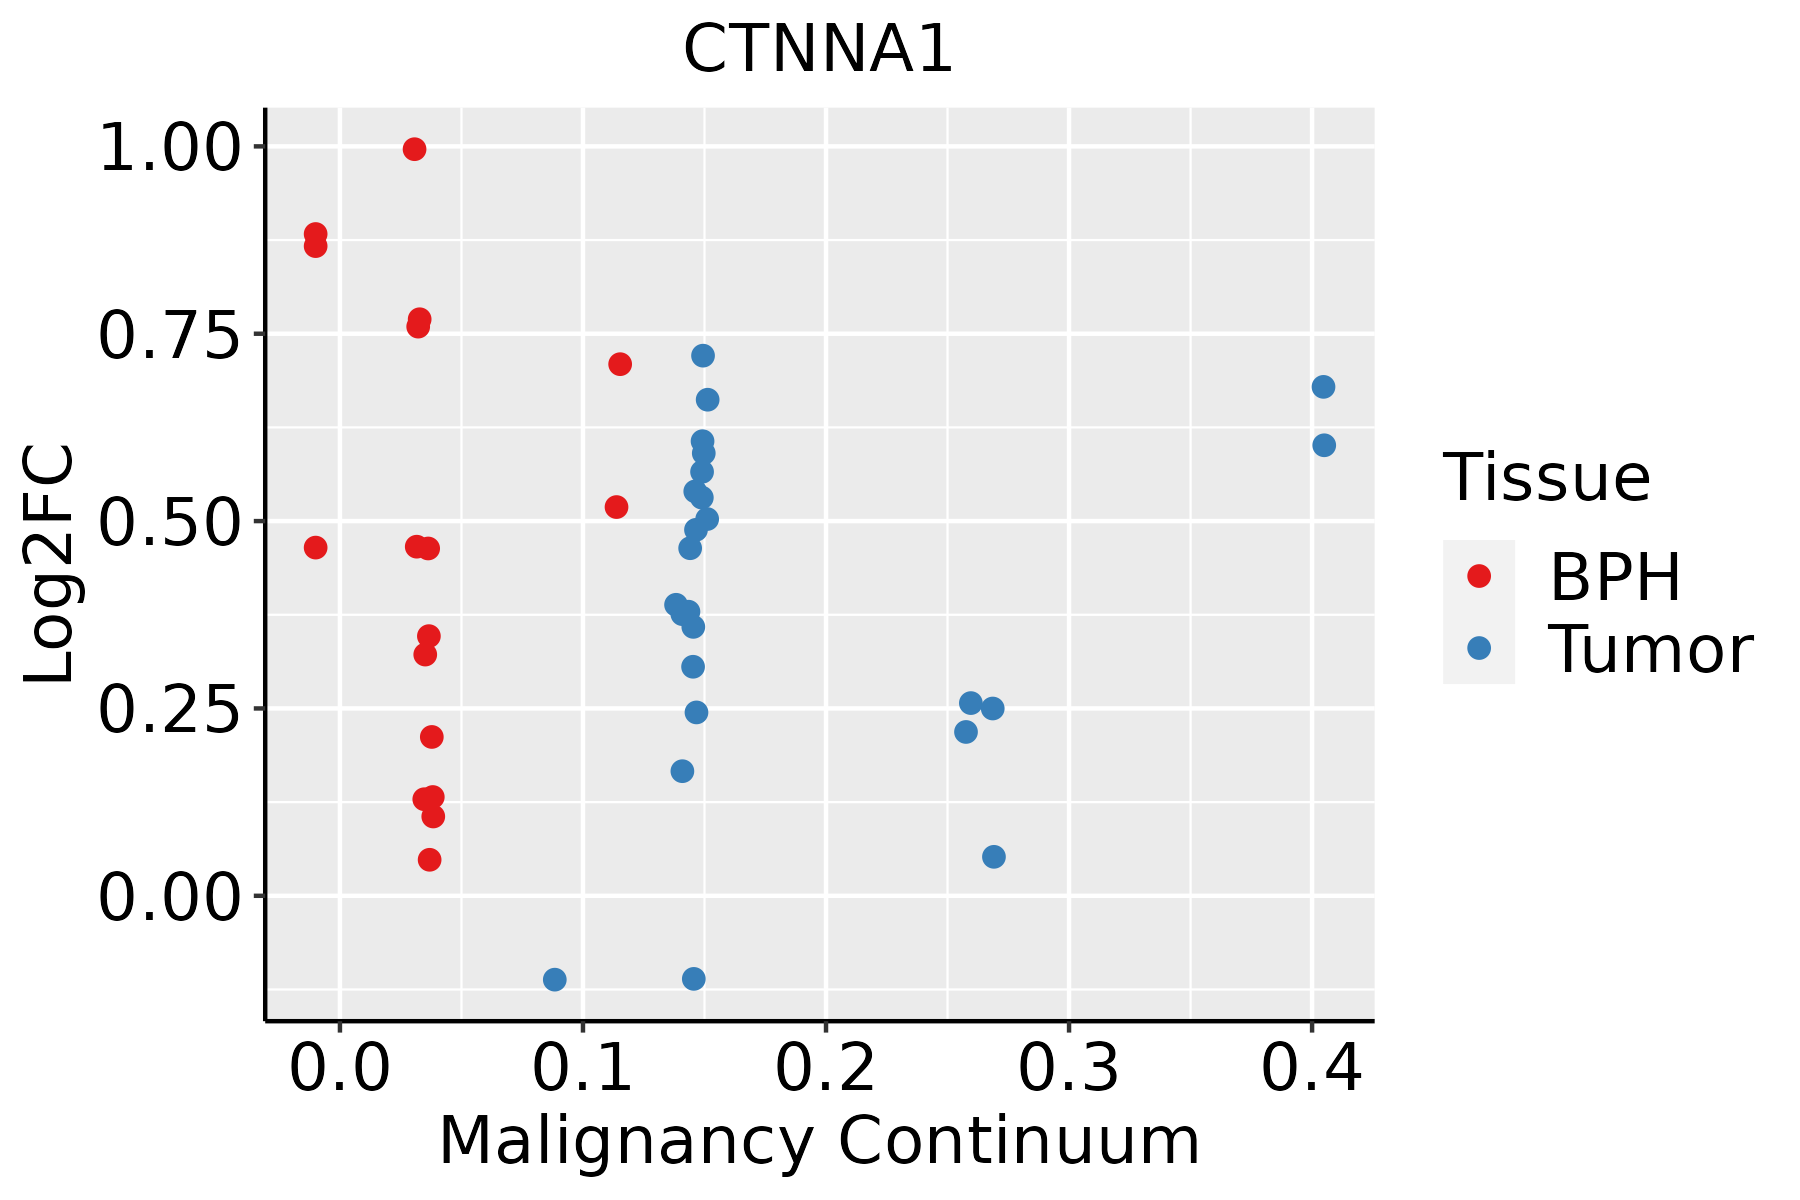 | BPH: Benign Prostatic Hyperplasia |
| Skin |  | AK: Actinic keratosis |
| cSCC: Cutaneous squamous cell carcinoma |
| SCCIS:squamous cell carcinoma in situ |
| Thyroid | 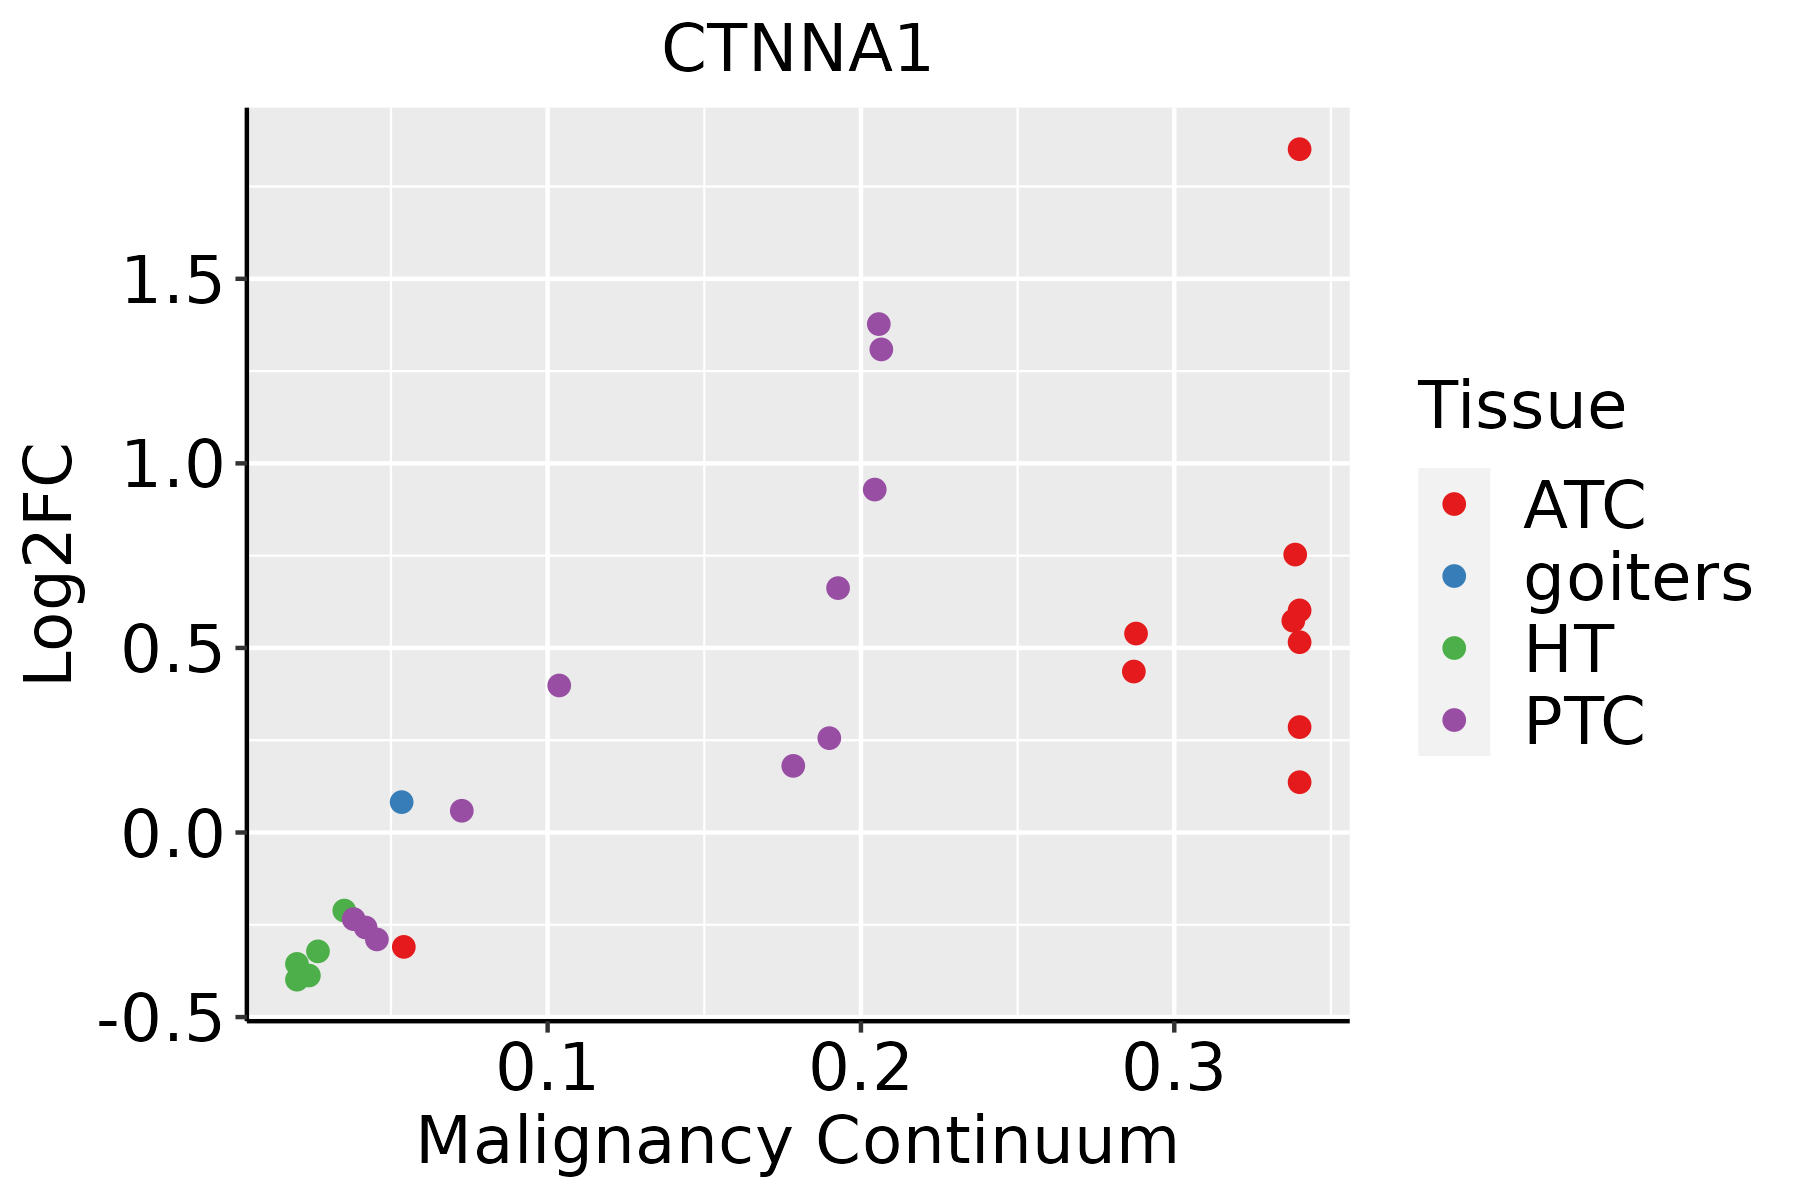 | ATC: Anaplastic thyroid cancer |
| HT: Hashimoto's thyroiditis |
| PTC: Papillary thyroid cancer |
| GO ID | Tissue | Disease Stage | Description | Gene Ratio | Bg Ratio | pvalue | p.adjust | Count |
| GO:200123310 | Cervix | CC | regulation of apoptotic signaling pathway | 96/2311 | 356/18723 | 4.08e-14 | 3.05e-11 | 96 |
| GO:000701510 | Cervix | CC | actin filament organization | 109/2311 | 442/18723 | 4.92e-13 | 2.45e-10 | 109 |
| GO:00071639 | Cervix | CC | establishment or maintenance of cell polarity | 63/2311 | 218/18723 | 4.25e-11 | 8.76e-09 | 63 |
| GO:00452169 | Cervix | CC | cell-cell junction organization | 53/2311 | 200/18723 | 3.83e-08 | 2.53e-06 | 53 |
| GO:00345048 | Cervix | CC | protein localization to nucleus | 68/2311 | 290/18723 | 9.91e-08 | 5.25e-06 | 68 |
| GO:00072295 | Cervix | CC | integrin-mediated signaling pathway | 34/2311 | 107/18723 | 1.01e-07 | 5.25e-06 | 34 |
| GO:200123410 | Cervix | CC | negative regulation of apoptotic signaling pathway | 56/2311 | 224/18723 | 1.39e-07 | 6.70e-06 | 56 |
| GO:20012357 | Cervix | CC | positive regulation of apoptotic signaling pathway | 37/2311 | 126/18723 | 2.70e-07 | 1.12e-05 | 37 |
| GO:00075689 | Cervix | CC | aging | 75/2311 | 339/18723 | 2.75e-07 | 1.13e-05 | 75 |
| GO:00343298 | Cervix | CC | cell junction assembly | 88/2311 | 420/18723 | 3.42e-07 | 1.38e-05 | 88 |
| GO:00614588 | Cervix | CC | reproductive system development | 87/2311 | 427/18723 | 1.37e-06 | 4.55e-05 | 87 |
| GO:00070439 | Cervix | CC | cell-cell junction assembly | 39/2311 | 146/18723 | 1.86e-06 | 5.94e-05 | 39 |
| GO:00486088 | Cervix | CC | reproductive structure development | 86/2311 | 424/18723 | 1.90e-06 | 5.97e-05 | 86 |
| GO:009719110 | Cervix | CC | extrinsic apoptotic signaling pathway | 52/2311 | 219/18723 | 2.06e-06 | 6.34e-05 | 52 |
| GO:00432978 | Cervix | CC | apical junction assembly | 24/2311 | 78/18723 | 1.36e-05 | 2.73e-04 | 24 |
| GO:00310996 | Cervix | CC | regeneration | 46/2311 | 198/18723 | 1.43e-05 | 2.84e-04 | 46 |
| GO:00615647 | Cervix | CC | axon development | 89/2311 | 467/18723 | 1.71e-05 | 3.27e-04 | 89 |
| GO:00512713 | Cervix | CC | negative regulation of cellular component movement | 73/2311 | 367/18723 | 2.22e-05 | 3.95e-04 | 73 |
| GO:200123610 | Cervix | CC | regulation of extrinsic apoptotic signaling pathway | 37/2311 | 151/18723 | 2.80e-05 | 4.65e-04 | 37 |
| GO:00400133 | Cervix | CC | negative regulation of locomotion | 76/2311 | 391/18723 | 3.47e-05 | 5.60e-04 | 76 |
| Pathway ID | Tissue | Disease Stage | Description | Gene Ratio | Bg Ratio | pvalue | p.adjust | qvalue | Count |
| hsa0452020 | Cervix | CC | Adherens junction | 33/1267 | 93/8465 | 6.99e-07 | 7.31e-06 | 4.32e-06 | 33 |
| hsa0467020 | Cervix | CC | Leukocyte transendothelial migration | 36/1267 | 114/8465 | 5.22e-06 | 4.83e-05 | 2.86e-05 | 36 |
| hsa043908 | Cervix | CC | Hippo signaling pathway | 40/1267 | 157/8465 | 3.64e-04 | 1.82e-03 | 1.07e-03 | 40 |
| hsa0510020 | Cervix | CC | Bacterial invasion of epithelial cells | 23/1267 | 77/8465 | 6.25e-04 | 2.93e-03 | 1.73e-03 | 23 |
| hsa0521310 | Cervix | CC | Endometrial cancer | 18/1267 | 58/8465 | 1.46e-03 | 6.30e-03 | 3.73e-03 | 18 |
| hsa04520110 | Cervix | CC | Adherens junction | 33/1267 | 93/8465 | 6.99e-07 | 7.31e-06 | 4.32e-06 | 33 |
| hsa04670110 | Cervix | CC | Leukocyte transendothelial migration | 36/1267 | 114/8465 | 5.22e-06 | 4.83e-05 | 2.86e-05 | 36 |
| hsa0439013 | Cervix | CC | Hippo signaling pathway | 40/1267 | 157/8465 | 3.64e-04 | 1.82e-03 | 1.07e-03 | 40 |
| hsa05100110 | Cervix | CC | Bacterial invasion of epithelial cells | 23/1267 | 77/8465 | 6.25e-04 | 2.93e-03 | 1.73e-03 | 23 |
| hsa0521313 | Cervix | CC | Endometrial cancer | 18/1267 | 58/8465 | 1.46e-03 | 6.30e-03 | 3.73e-03 | 18 |
| hsa0467025 | Cervix | HSIL_HPV | Leukocyte transendothelial migration | 16/459 | 114/8465 | 4.04e-04 | 3.49e-03 | 2.82e-03 | 16 |
| hsa054127 | Cervix | HSIL_HPV | Arrhythmogenic right ventricular cardiomyopathy | 10/459 | 77/8465 | 8.34e-03 | 4.70e-02 | 3.80e-02 | 10 |
| hsa0467035 | Cervix | HSIL_HPV | Leukocyte transendothelial migration | 16/459 | 114/8465 | 4.04e-04 | 3.49e-03 | 2.82e-03 | 16 |
| hsa0541212 | Cervix | HSIL_HPV | Arrhythmogenic right ventricular cardiomyopathy | 10/459 | 77/8465 | 8.34e-03 | 4.70e-02 | 3.80e-02 | 10 |
| hsa0510025 | Cervix | N_HPV | Bacterial invasion of epithelial cells | 10/349 | 77/8465 | 1.17e-03 | 7.93e-03 | 6.20e-03 | 10 |
| hsa0467045 | Cervix | N_HPV | Leukocyte transendothelial migration | 12/349 | 114/8465 | 2.50e-03 | 1.45e-02 | 1.13e-02 | 12 |
| hsa0510035 | Cervix | N_HPV | Bacterial invasion of epithelial cells | 10/349 | 77/8465 | 1.17e-03 | 7.93e-03 | 6.20e-03 | 10 |
| hsa0467055 | Cervix | N_HPV | Leukocyte transendothelial migration | 12/349 | 114/8465 | 2.50e-03 | 1.45e-02 | 1.13e-02 | 12 |
| hsa05100 | Colorectum | AD | Bacterial invasion of epithelial cells | 44/2092 | 77/8465 | 1.13e-09 | 2.22e-08 | 1.42e-08 | 44 |
| hsa04520 | Colorectum | AD | Adherens junction | 50/2092 | 93/8465 | 1.52e-09 | 2.83e-08 | 1.81e-08 | 50 |
| Hugo Symbol | Variant Class | Variant Classification | dbSNP RS | HGVSc | HGVSp | HGVSp Short | SWISSPROT | BIOTYPE | SIFT | PolyPhen | Tumor Sample Barcode | Tissue | Histology | Sex | Age | Stage | Therapy Types | Drugs | Outcome |
| CTNNA1 | SNV | Missense_Mutation | rs781520852 | c.160N>T | p.Arg54Cys | p.R54C | P35221 | protein_coding | tolerated(0.07) | possibly_damaging(0.873) | TCGA-AC-A3TM-01 | Breast | breast invasive carcinoma | Female | <65 | III/IV | Chemotherapy | cytoxan | CR |
| CTNNA1 | SNV | Missense_Mutation | | c.1294G>C | p.Glu432Gln | p.E432Q | P35221 | protein_coding | tolerated(0.07) | benign(0.405) | TCGA-AN-A0XW-01 | Breast | breast invasive carcinoma | Female | <65 | III/IV | Unknown | Unknown | SD |
| CTNNA1 | SNV | Missense_Mutation | | c.1673C>T | p.Ser558Leu | p.S558L | P35221 | protein_coding | deleterious(0) | benign(0.295) | TCGA-BH-A18U-01 | Breast | breast invasive carcinoma | Female | >=65 | III/IV | Unknown | Unknown | SD |
| CTNNA1 | insertion | Nonsense_Mutation | novel | c.451_452insAACAAATAAAAGAATGAATGATCTCCATCT | p.Leu151delinsGlnGlnIleLysGluTerMetIleSerIlePhe | p.L151delinsQQIKE*MISIF | P35221 | protein_coding | | | TCGA-A2-A0CP-01 | Breast | breast invasive carcinoma | Female | <65 | I/II | Chemotherapy | cytoxan | SD |
| CTNNA1 | SNV | Missense_Mutation | | c.2350G>A | p.Ala784Thr | p.A784T | P35221 | protein_coding | tolerated(0.41) | benign(0.131) | TCGA-2W-A8YY-01 | Cervix | cervical & endocervical cancer | Female | <65 | I/II | Chemotherapy | cisplatin | CR |
| CTNNA1 | SNV | Missense_Mutation | novel | c.2411G>A | p.Gly804Asp | p.G804D | P35221 | protein_coding | deleterious(0.01) | possibly_damaging(0.756) | TCGA-EA-A410-01 | Cervix | cervical & endocervical cancer | Female | <65 | I/II | Unknown | Unknown | SD |
| CTNNA1 | SNV | Missense_Mutation | | c.1939N>C | p.Asp647His | p.D647H | P35221 | protein_coding | deleterious(0.01) | probably_damaging(0.95) | TCGA-EK-A2RA-01 | Cervix | cervical & endocervical cancer | Female | >=65 | I/II | Unknown | Unknown | SD |
| CTNNA1 | SNV | Missense_Mutation | novel | c.2163N>C | p.Met721Ile | p.M721I | P35221 | protein_coding | deleterious(0.04) | possibly_damaging(0.516) | TCGA-HM-A4S6-01 | Cervix | cervical & endocervical cancer | Female | <65 | III/IV | Chemotherapy | cisplatin | CR |
| CTNNA1 | SNV | Missense_Mutation | novel | c.1027G>A | p.Ala343Thr | p.A343T | P35221 | protein_coding | deleterious(0.02) | benign(0.12) | TCGA-5M-AAT6-01 | Colorectum | colon adenocarcinoma | Female | <65 | III/IV | Unknown | Unknown | PD |
| CTNNA1 | SNV | Missense_Mutation | | c.2397N>T | p.Glu799Asp | p.E799D | P35221 | protein_coding | tolerated(0.88) | benign(0.071) | TCGA-A6-6780-01 | Colorectum | colon adenocarcinoma | Male | >=65 | I/II | Unknown | Unknown | SD |


