
|
|||||
|
 | |
| |
| |
| |
| |
| |
|
Gene: CTLA4 |
Gene summary for CTLA4 |
| Gene information | Species | Human | Gene symbol | CTLA4 | Gene ID | 1493 |
| Gene name | cytotoxic T-lymphocyte associated protein 4 | |
| Gene Alias | ALPS5 | |
| Cytomap | 2q33.2 | |
| Gene Type | protein-coding | GO ID | GO:0001775 | UniProtAcc | P16410 |
Top |
Malignant transformation analysis |
| Identification of the aberrant gene expression in precancerous and cancerous lesions by comparing the gene expression of stem-like cells in diseased tissues with normal stem cells |
| Entrez ID | Symbol | Replicates | Species | Organ | Tissue | Adj P-value | Log2FC | Malignancy |
| 1493 | CTLA4 | LZE4T | Human | Esophagus | ESCC | 1.22e-03 | 4.03e-01 | 0.0811 |
| 1493 | CTLA4 | LZE7T | Human | Esophagus | ESCC | 2.24e-06 | 7.21e-01 | 0.0667 |
| 1493 | CTLA4 | LZE6T | Human | Esophagus | ESCC | 7.38e-05 | 6.47e-01 | 0.0845 |
| 1493 | CTLA4 | P16T-E | Human | Esophagus | ESCC | 2.13e-16 | 4.45e-01 | 0.1153 |
| Page: 1 |
| Tissue | Expression Dynamics | Abbreviation |
| Esophagus | 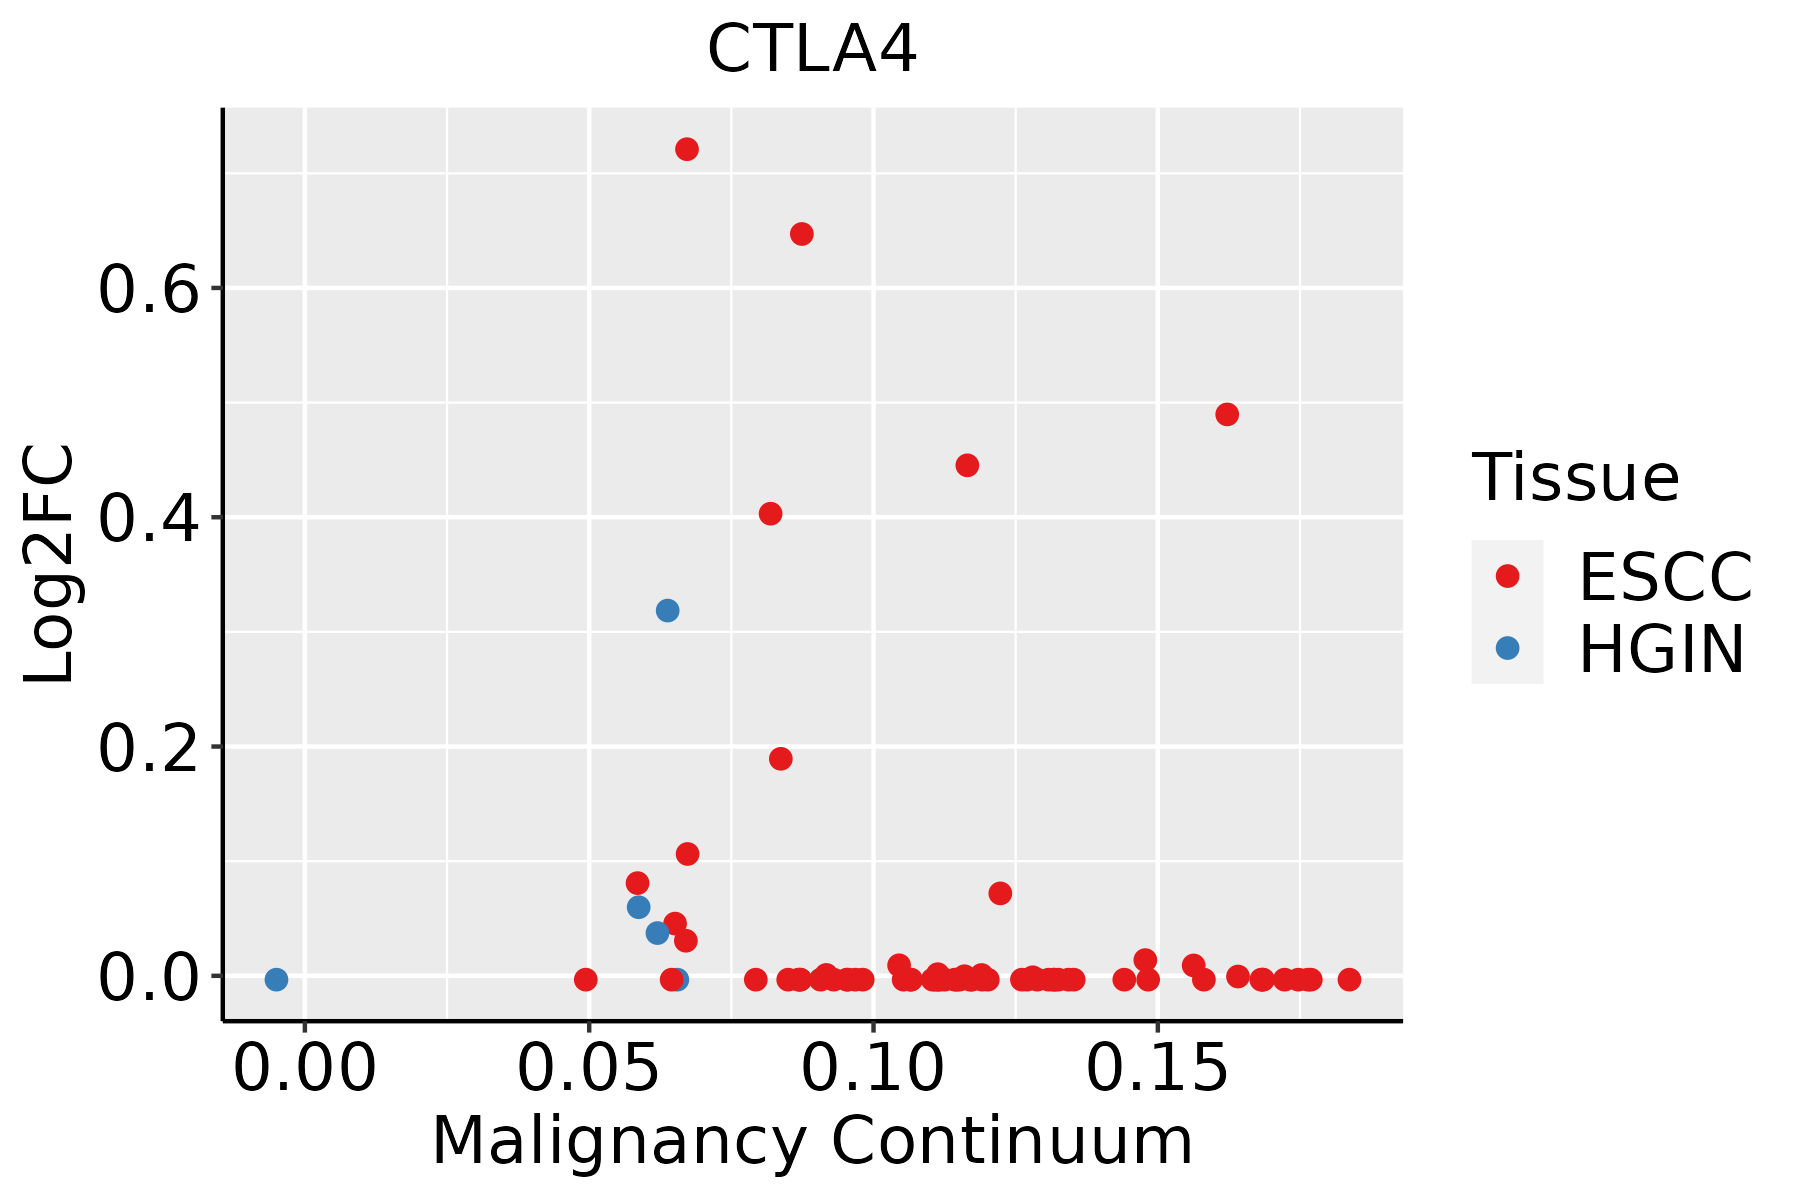 | ESCC: Esophageal squamous cell carcinoma |
| HGIN: High-grade intraepithelial neoplasias | ||
| LGIN: Low-grade intraepithelial neoplasias |
| ∗log2FC in expression of this searched gene in stem-like cells from each diseased tissue sample relative to stem-like cells in normal samples in each tissue plotted against the malignancy continuum. Samples are colored based on if they are from different disease stage. |
Top |
Malignant transformation related pathway analysis |
| Find out the enriched GO biological processes and KEGG pathways involved in transition from healthy to precancer to cancer |
| Tissue | Disease Stage | Enriched GO biological Processes |
| Colorectum | AD |  |
| Colorectum | SER |  |
| Colorectum | MSS |  |
| Colorectum | MSI-H |  |
| Colorectum | FAP |  |
| ∗Top 15 enriched GO BP terms are showed in the bar plot of each disease state in each tissue. Each row represents a significant GO biological process which is colored according to the -log10(p.adjust). |
| Page: 1 2 3 4 5 6 7 8 9 |
| GO ID | Tissue | Disease Stage | Description | Gene Ratio | Bg Ratio | pvalue | p.adjust | Count |
| GO:1903706110 | Esophagus | ESCC | regulation of hemopoiesis | 201/8552 | 367/18723 | 2.60e-04 | 1.58e-03 | 201 |
| GO:00507775 | Esophagus | ESCC | negative regulation of immune response | 112/8552 | 194/18723 | 4.67e-04 | 2.62e-03 | 112 |
| GO:002240720 | Esophagus | ESCC | regulation of cell-cell adhesion | 239/8552 | 448/18723 | 5.88e-04 | 3.19e-03 | 239 |
| GO:000268316 | Esophagus | ESCC | negative regulation of immune system process | 231/8552 | 434/18723 | 8.48e-04 | 4.36e-03 | 231 |
| GO:004211018 | Esophagus | ESCC | T cell activation | 256/8552 | 487/18723 | 1.18e-03 | 5.87e-03 | 256 |
| GO:19031317 | Esophagus | ESCC | mononuclear cell differentiation | 226/8552 | 426/18723 | 1.20e-03 | 5.88e-03 | 226 |
| GO:00508528 | Esophagus | ESCC | T cell receptor signaling pathway | 73/8552 | 123/18723 | 1.54e-03 | 7.24e-03 | 73 |
| GO:190210510 | Esophagus | ESCC | regulation of leukocyte differentiation | 152/8552 | 279/18723 | 1.82e-03 | 8.35e-03 | 152 |
| GO:00302176 | Esophagus | ESCC | T cell differentiation | 137/8552 | 257/18723 | 8.09e-03 | 2.87e-02 | 137 |
| GO:000715918 | Esophagus | ESCC | leukocyte cell-cell adhesion | 192/8552 | 371/18723 | 1.03e-02 | 3.51e-02 | 192 |
| GO:190303717 | Esophagus | ESCC | regulation of leukocyte cell-cell adhesion | 174/8552 | 336/18723 | 1.36e-02 | 4.43e-02 | 174 |
| GO:00300984 | Esophagus | ESCC | lymphocyte differentiation | 192/8552 | 374/18723 | 1.52e-02 | 4.93e-02 | 192 |
| Page: 1 |
| Pathway ID | Tissue | Disease Stage | Description | Gene Ratio | Bg Ratio | pvalue | p.adjust | qvalue | Count |
| hsa0532320 | Esophagus | ESCC | Rheumatoid arthritis | 59/4205 | 93/8465 | 4.98e-03 | 1.27e-02 | 6.52e-03 | 59 |
| hsa046607 | Esophagus | ESCC | T cell receptor signaling pathway | 63/4205 | 104/8465 | 1.60e-02 | 3.60e-02 | 1.84e-02 | 63 |
| hsa05323110 | Esophagus | ESCC | Rheumatoid arthritis | 59/4205 | 93/8465 | 4.98e-03 | 1.27e-02 | 6.52e-03 | 59 |
| hsa0466013 | Esophagus | ESCC | T cell receptor signaling pathway | 63/4205 | 104/8465 | 1.60e-02 | 3.60e-02 | 1.84e-02 | 63 |
| Page: 1 |
Top |
Cell-cell communication analysis |
| Identification of potential cell-cell interactions between two cell types and their ligand-receptor pairs for different disease states |
| Ligand | Receptor | LRpair | Pathway | Tissue | Disease Stage |
| CD86 | CTLA4 | CD86_CTLA4 | CD86 | Breast | DCIS |
| ICOSLG | CTLA4 | ICOSL_CTLA4 | ICOS | Breast | DCIS |
| CD86 | CTLA4 | CD86_CTLA4 | CD86 | Breast | Healthy |
| CD86 | CTLA4 | CD86_CTLA4 | CD86 | Breast | IDC |
| CD86 | CTLA4 | CD86_CTLA4 | CD86 | Cervix | ADJ |
| CD86 | CTLA4 | CD86_CTLA4 | CD86 | Cervix | CC |
| CD86 | CTLA4 | CD86_CTLA4 | CD86 | Cervix | Precancer |
| CD86 | CTLA4 | CD86_CTLA4 | CD86 | CRC | AD |
| CD86 | CTLA4 | CD86_CTLA4 | CD86 | CRC | MSI-H |
| CD86 | CTLA4 | CD86_CTLA4 | CD86 | CRC | SER |
| CD86 | CTLA4 | CD86_CTLA4 | CD86 | Endometrium | ADJ |
| CD86 | CTLA4 | CD86_CTLA4 | CD86 | Endometrium | AEH |
| CD86 | CTLA4 | CD86_CTLA4 | CD86 | Endometrium | EEC |
| CD86 | CTLA4 | CD86_CTLA4 | CD86 | GC | ADJ |
| CD80 | CTLA4 | CD80_CTLA4 | CD80 | GC | ADJ |
| CD86 | CTLA4 | CD86_CTLA4 | CD86 | GC | GC |
| CD80 | CTLA4 | CD80_CTLA4 | CD80 | GC | GC |
| CD86 | CTLA4 | CD86_CTLA4 | CD86 | HNSCC | ADJ |
| ICOSLG | CTLA4 | ICOSL_CTLA4 | ICOS | HNSCC | ADJ |
| CD86 | CTLA4 | CD86_CTLA4 | CD86 | HNSCC | Healthy |
| Page: 1 |
Top |
Single-cell gene regulatory network inference analysis |
| Find out the significant the regulons (TFs) and the target genes of each regulon across cell types for different disease states |
| TF | Cell Type | Tissue | Disease Stage | Target Gene | RSS | Regulon Activity |
| ∗The dot plots of a searched regulon are shown for all cell subpopulations in each disease state of each tissue based on the regulon specific score inferred using pySCENIC and by calculating the average expression. |
| Page: 1 |
Top |
Somatic mutation of malignant transformation related genes |
| Annotation of somatic variants for genes involved in malignant transformation |
| Hugo Symbol | Variant Class | Variant Classification | dbSNP RS | HGVSc | HGVSp | HGVSp Short | SWISSPROT | BIOTYPE | SIFT | PolyPhen | Tumor Sample Barcode | Tissue | Histology | Sex | Age | Stage | Therapy Types | Drugs | Outcome |
| CTLA4 | SNV | Missense_Mutation | c.586N>G | p.Leu196Val | p.L196V | P16410 | protein_coding | deleterious(0.01) | probably_damaging(0.996) | TCGA-BH-A0AW-01 | Breast | breast invasive carcinoma | Female | <65 | I/II | Chemotherapy | carboplatin | SD | |
| CTLA4 | SNV | Missense_Mutation | novel | c.410C>T | p.Pro137Leu | p.P137L | P16410 | protein_coding | deleterious(0) | probably_damaging(1) | TCGA-E9-A2JS-01 | Breast | breast invasive carcinoma | Female | >=65 | I/II | Chemotherapy | cyclophosphamide | PD |
| CTLA4 | SNV | Missense_Mutation | c.331C>G | p.Gln111Glu | p.Q111E | P16410 | protein_coding | tolerated(0.12) | benign(0.005) | TCGA-HM-A4S6-01 | Cervix | cervical & endocervical cancer | Female | <65 | III/IV | Chemotherapy | cisplatin | CR | |
| CTLA4 | SNV | Missense_Mutation | c.197N>A | p.Ala66Asp | p.A66D | P16410 | protein_coding | deleterious(0) | benign(0.399) | TCGA-AA-A02J-01 | Colorectum | colon adenocarcinoma | Female | >=65 | III/IV | Unknown | Unknown | PD | |
| CTLA4 | SNV | Missense_Mutation | novel | c.515N>T | p.Ser172Leu | p.S172L | P16410 | protein_coding | tolerated(0.11) | benign(0.014) | TCGA-AZ-4315-01 | Colorectum | colon adenocarcinoma | Male | <65 | I/II | Unknown | Unknown | SD |
| CTLA4 | SNV | Missense_Mutation | novel | c.573N>T | p.Lys191Asn | p.K191N | P16410 | protein_coding | deleterious(0) | possibly_damaging(0.783) | TCGA-AG-A002-01 | Colorectum | rectum adenocarcinoma | Male | <65 | I/II | Unknown | Unknown | SD |
| CTLA4 | SNV | Missense_Mutation | novel | c.554N>A | p.Ser185Tyr | p.S185Y | P16410 | protein_coding | deleterious(0.04) | possibly_damaging(0.726) | TCGA-AJ-A5DW-01 | Endometrium | uterine corpus endometrioid carcinoma | Female | <65 | I/II | Unknown | Unknown | SD |
| CTLA4 | SNV | Missense_Mutation | c.161N>T | p.Ala54Val | p.A54V | P16410 | protein_coding | tolerated(0.07) | probably_damaging(0.999) | TCGA-AP-A051-01 | Endometrium | uterine corpus endometrioid carcinoma | Female | >=65 | I/II | Unknown | Unknown | SD | |
| CTLA4 | SNV | Missense_Mutation | novel | c.515N>T | p.Ser172Leu | p.S172L | P16410 | protein_coding | tolerated(0.11) | benign(0.014) | TCGA-AP-A1E0-01 | Endometrium | uterine corpus endometrioid carcinoma | Female | <65 | III/IV | Chemotherapy | paclitaxel | SD |
| CTLA4 | SNV | Missense_Mutation | novel | c.430G>T | p.Gly144Cys | p.G144C | P16410 | protein_coding | deleterious(0) | probably_damaging(1) | TCGA-AX-A2HC-01 | Endometrium | uterine corpus endometrioid carcinoma | Female | <65 | III/IV | Chemotherapy | paclitaxel | PD |
| Page: 1 2 3 4 |
Top |
Related drugs of malignant transformation related genes |
| Identification of chemicals and drugs interact with genes involved in malignant transfromation |
| (DGIdb 4.0) |
| Entrez ID | Symbol | Category | Interaction Types | Drug Claim Name | Drug Name | PMIDs |
| 1493 | CTLA4 | EXTERNAL SIDE OF PLASMA MEMBRANE, CLINICALLY ACTIONABLE, DRUGGABLE GENOME | antibody | TREMELIMUMAB | TREMELIMUMAB | |
| 1493 | CTLA4 | EXTERNAL SIDE OF PLASMA MEMBRANE, CLINICALLY ACTIONABLE, DRUGGABLE GENOME | Antiinflammatory agents, non-steroids | 28750137 | ||
| 1493 | CTLA4 | EXTERNAL SIDE OF PLASMA MEMBRANE, CLINICALLY ACTIONABLE, DRUGGABLE GENOME | AGEN1884 | ZALIFRELIMAB | ||
| 1493 | CTLA4 | EXTERNAL SIDE OF PLASMA MEMBRANE, CLINICALLY ACTIONABLE, DRUGGABLE GENOME | WORTMANNIN | WORTMANNIN | 10464177 | |
| 1493 | CTLA4 | EXTERNAL SIDE OF PLASMA MEMBRANE, CLINICALLY ACTIONABLE, DRUGGABLE GENOME | Tumor necrosis factor alpha (TNF-alpha) inhibitors | 26194362 | ||
| 1493 | CTLA4 | EXTERNAL SIDE OF PLASMA MEMBRANE, CLINICALLY ACTIONABLE, DRUGGABLE GENOME | CTLA4-IG | ABATACEPT | 9758890 | |
| 1493 | CTLA4 | EXTERNAL SIDE OF PLASMA MEMBRANE, CLINICALLY ACTIONABLE, DRUGGABLE GENOME | antibody | 178103470 | IPILIMUMAB | |
| 1493 | CTLA4 | EXTERNAL SIDE OF PLASMA MEMBRANE, CLINICALLY ACTIONABLE, DRUGGABLE GENOME | BLEOMYCIN | BLEOMYCIN | 11489978 | |
| 1493 | CTLA4 | EXTERNAL SIDE OF PLASMA MEMBRANE, CLINICALLY ACTIONABLE, DRUGGABLE GENOME | TRemelimumab + MEDI0562 | |||
| 1493 | CTLA4 | EXTERNAL SIDE OF PLASMA MEMBRANE, CLINICALLY ACTIONABLE, DRUGGABLE GENOME | PMA | 10777098,8946678 |
| Page: 1 2 3 4 |

Copyright 2023-Present -The University of Texas Health Science Center at Houston |