Schematic overview of the cellular and molecular mechanisms involved in the cancer progression, including the proposed cellular and molecular mechanisms in cancer cells trajectory. AT1: alveolar type 1 cells; AT2: alveolar type 2 cells; AAH: atypical adenomatous hyperplasia; AIS: adenocarcinoma in situ; MIA: minimally invasive adenocarcinoma; IA: invasive adenocarcinoma; EMT: epithelial-mesenchymal transition

Home

Download

Statistics

Help

Contact

Center for Computational Systems Medicine
leaf

Gene summary

leaf

Malignant transformation analysis

leaf

Malignant transformation related pathway analysis

leaf

Cell-cell communication analysis

leaf

Single-cell gene regulatory network inference analysis

leaf

Somatic mutation of malignant transformation related genes

leaf

Related drugs of malignant transformation related genes

Gene: CTDSPL2

Gene summary for CTDSPL2

check button Gene summary.

Gene informationSpeciesHuman
Gene symbol

CTDSPL2

Gene ID

51496

Gene nameCTD small phosphatase like 2
Gene AliasHSPC058
Cytomap15q15.3-q21.1
Gene Typeprotein-coding
GO ID

GO:0006464

UniProtAcc

A0A024R5Q8


Top

Malignant transformation analysis

check button Identification of the aberrant gene expression in precancerous and cancerous lesions by comparing the gene expression of stem-like cells in diseased tissues with normal stem cells
check button Malignant transformation involving gene list.
Entrez IDSymbolReplicatesSpeciesOrganTissueAdj P-valueLog2FCMalignancy
51496CTDSPL2CCI_2HumanCervixCC2.31e-066.48e-010.5249
51496CTDSPL2CCI_3HumanCervixCC1.50e-045.14e-010.516
51496CTDSPL2LZE2THumanEsophagusESCC9.58e-034.25e-010.082
51496CTDSPL2LZE4THumanEsophagusESCC4.65e-092.00e-010.0811
51496CTDSPL2LZE7THumanEsophagusESCC1.02e-022.12e-010.0667
51496CTDSPL2LZE8THumanEsophagusESCC1.64e-032.17e-010.067
51496CTDSPL2LZE20THumanEsophagusESCC1.47e-036.40e-020.0662
51496CTDSPL2LZE24THumanEsophagusESCC5.81e-091.96e-010.0596
51496CTDSPL2P1T-EHumanEsophagusESCC3.68e-124.06e-010.0875
51496CTDSPL2P2T-EHumanEsophagusESCC7.63e-263.01e-010.1177
51496CTDSPL2P4T-EHumanEsophagusESCC5.95e-203.86e-010.1323
51496CTDSPL2P5T-EHumanEsophagusESCC2.02e-142.56e-010.1327
51496CTDSPL2P8T-EHumanEsophagusESCC1.73e-214.84e-010.0889
51496CTDSPL2P9T-EHumanEsophagusESCC4.29e-142.55e-010.1131
51496CTDSPL2P10T-EHumanEsophagusESCC9.24e-305.26e-010.116
51496CTDSPL2P11T-EHumanEsophagusESCC4.01e-051.77e-010.1426
51496CTDSPL2P12T-EHumanEsophagusESCC1.80e-193.92e-010.1122
51496CTDSPL2P15T-EHumanEsophagusESCC1.17e-204.41e-010.1149
51496CTDSPL2P16T-EHumanEsophagusESCC1.12e-213.39e-010.1153
51496CTDSPL2P19T-EHumanEsophagusESCC1.42e-094.02e-010.1662
Page: 1 2 3 4 5 

check button Transcriptomic changes along malignancy continuum.
TissueExpression DynamicsAbbreviation
CervixThe image shows the transcriptomic changes along malignancy continuum.log2FC in expression of this searched gene in stem-like cells from each diseased tissue sample relative to stem-like cells in normal samples in each tissue plotted against the malignancy continuum. Samples are colored based on if they are from different disease stage.CC: Cervix cancer
HSIL_HPV: HPV-infected high-grade squamous intraepithelial lesions
N_HPV: HPV-infected normal cervix
EsophagusThe image shows the transcriptomic changes along malignancy continuum.log2FC in expression of this searched gene in stem-like cells from each diseased tissue sample relative to stem-like cells in normal samples in each tissue plotted against the malignancy continuum. Samples are colored based on if they are from different disease stage.
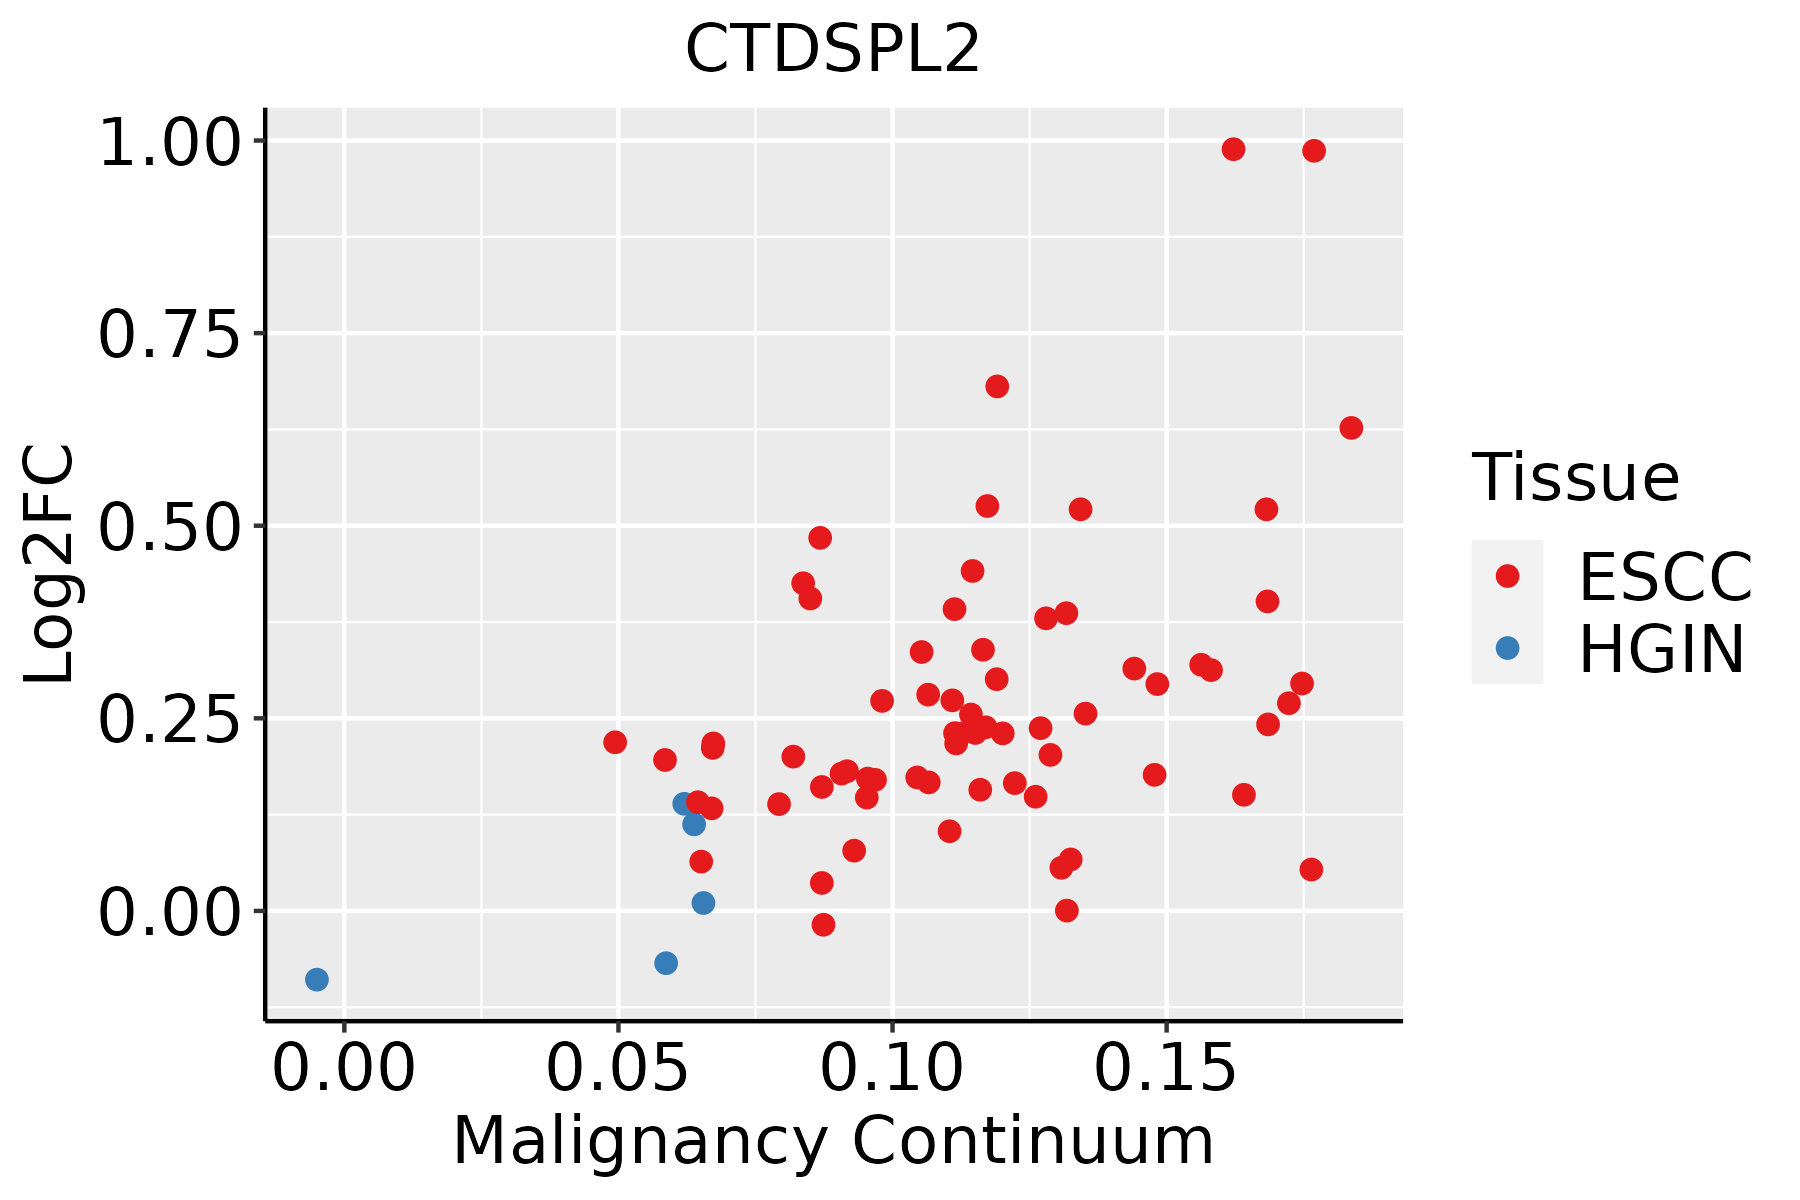
ESCC: Esophageal squamous cell carcinoma
HGIN: High-grade intraepithelial neoplasias
LGIN: Low-grade intraepithelial neoplasias
LiverThe image shows the transcriptomic changes along malignancy continuum.log2FC in expression of this searched gene in stem-like cells from each diseased tissue sample relative to stem-like cells in normal samples in each tissue plotted against the malignancy continuum. Samples are colored based on if they are from different disease stage.
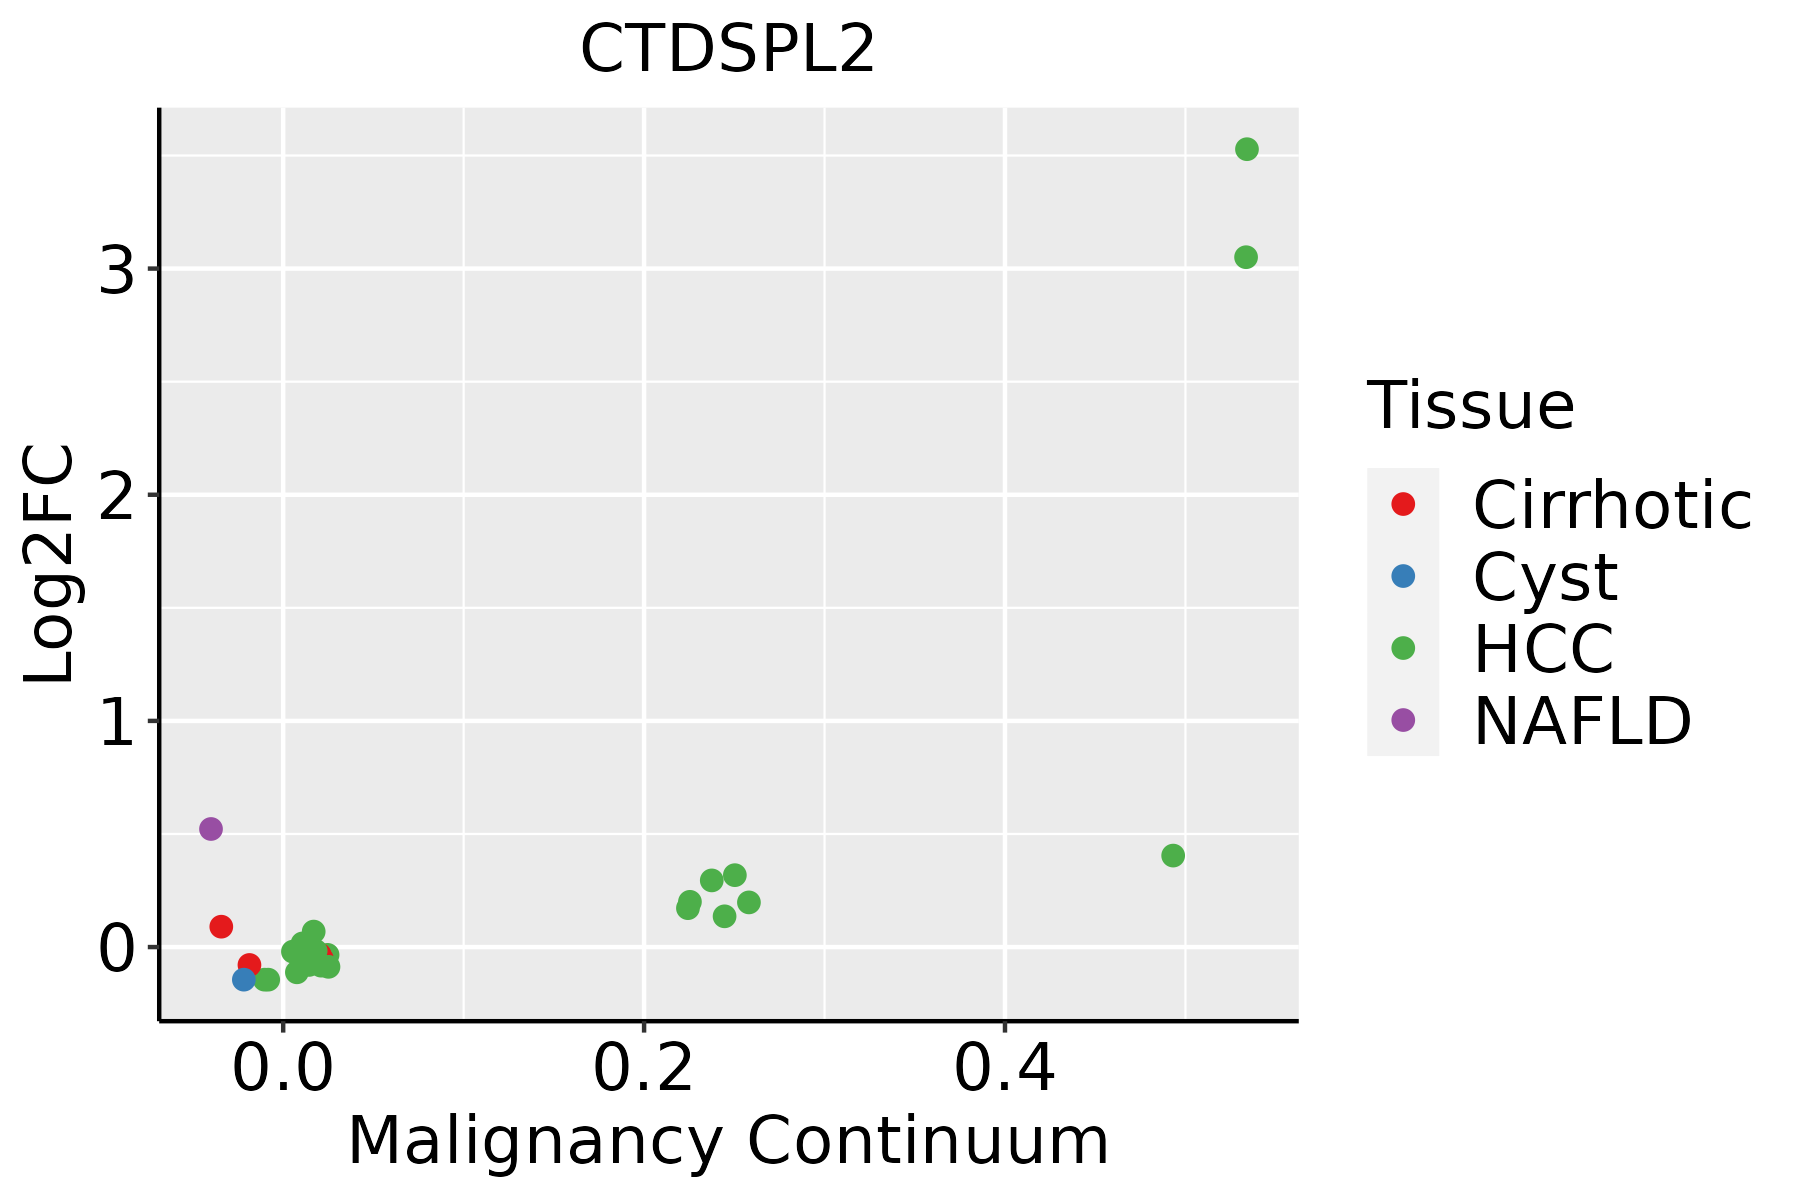
HCC: Hepatocellular carcinoma
NAFLD: Non-alcoholic fatty liver disease
Oral CavityThe image shows the transcriptomic changes along malignancy continuum.log2FC in expression of this searched gene in stem-like cells from each diseased tissue sample relative to stem-like cells in normal samples in each tissue plotted against the malignancy continuum. Samples are colored based on if they are from different disease stage.EOLP: Erosive Oral lichen planus
LP: leukoplakia
NEOLP: Non-erosive oral lichen planus
OSCC: Oral squamous cell carcinoma
ThyroidThe image shows the transcriptomic changes along malignancy continuum.log2FC in expression of this searched gene in stem-like cells from each diseased tissue sample relative to stem-like cells in normal samples in each tissue plotted against the malignancy continuum. Samples are colored based on if they are from different disease stage.ATC: Anaplastic thyroid cancer
HT: Hashimoto's thyroiditis
PTC: Papillary thyroid cancer
∗log2FC in expression of this searched gene in stem-like cells from each diseased tissue sample relative to stem-like cells in normal samples in each tissue plotted against the malignancy continuum. Samples are colored based on if they are from different disease stage.

Top

Malignant transformation related pathway analysis

check buttonFind out the enriched GO biological processes and KEGG pathways involved in transition from healthy to precancer to cancer
check button Figure of enriched GO biological processes.
TissueDisease StageEnriched GO biological Processes
ColorectumADGO analysis - Figure of enriched GO biological processes: Top 15 enriched GO BP terms are showed in the bar plot of each disease state in each tissue. Each row represents a significant GO biological process which is colored according to the -log10(p.adjust).
ColorectumSERGO analysis - Figure of enriched GO biological processes: Top 15 enriched GO BP terms are showed in the bar plot of each disease state in each tissue. Each row represents a significant GO biological process which is colored according to the -log10(p.adjust).
ColorectumMSSGO analysis - Figure of enriched GO biological processes: Top 15 enriched GO BP terms are showed in the bar plot of each disease state in each tissue. Each row represents a significant GO biological process which is colored according to the -log10(p.adjust).
ColorectumMSI-HGO analysis - Figure of enriched GO biological processes: Top 15 enriched GO BP terms are showed in the bar plot of each disease state in each tissue. Each row represents a significant GO biological process which is colored according to the -log10(p.adjust).
ColorectumFAPGO analysis - Figure of enriched GO biological processes: Top 15 enriched GO BP terms are showed in the bar plot of each disease state in each tissue. Each row represents a significant GO biological process which is colored according to the -log10(p.adjust).
∗Top 15 enriched GO BP terms are showed in the bar plot of each disease state in each tissue. Each row represents a significant GO biological process which is colored according to the -log10(p.adjust).
Page: 1 2 3 4 5 6 7 8 9 

check button Enriched GO biological processes.
GO IDTissueDisease StageDescriptionGene RatioBg Ratiopvaluep.adjustCount
GO:005122210CervixCCpositive regulation of protein transport72/2311303/187232.36e-081.70e-0672
GO:00069139CervixCCnucleocytoplasmic transport71/2311301/187234.04e-082.54e-0671
GO:00511699CervixCCnuclear transport71/2311301/187234.04e-082.54e-0671
GO:190495110CervixCCpositive regulation of establishment of protein localization73/2311319/187239.69e-085.25e-0673
GO:00468229CervixCCregulation of nucleocytoplasmic transport31/2311106/187232.68e-067.87e-0531
GO:00903167CervixCCpositive regulation of intracellular protein transport41/2311160/187233.24e-068.80e-0541
GO:00323868CervixCCregulation of intracellular transport71/2311337/187233.70e-069.74e-0571
GO:00331579CervixCCregulation of intracellular protein transport52/2311229/187238.16e-061.88e-0452
GO:00064708CervixCCprotein dephosphorylation60/2311281/187231.33e-052.68e-0460
GO:00511689CervixCCnuclear export38/2311154/187231.86e-053.46e-0438
GO:00323889CervixCCpositive regulation of intracellular transport46/2311202/187232.45e-054.24e-0446
GO:00468248CervixCCpositive regulation of nucleocytoplasmic transport19/231162/187231.11e-041.40e-0319
GO:00468259CervixCCregulation of protein export from nucleus12/231130/187231.23e-041.53e-0312
GO:00071786CervixCCtransmembrane receptor protein serine/threonine kinase signaling pathway67/2311355/187232.39e-042.67e-0367
GO:00066116CervixCCprotein export from nucleus17/231157/187233.61e-043.75e-0317
GO:00163117CervixCCdephosphorylation73/2311417/187231.23e-039.87e-0373
GO:0006913110EsophagusESCCnucleocytoplasmic transport230/8552301/187236.04e-282.02e-25230
GO:0051169110EsophagusESCCnuclear transport230/8552301/187236.04e-282.02e-25230
GO:003238618EsophagusESCCregulation of intracellular transport243/8552337/187233.20e-237.25e-21243
GO:0051168110EsophagusESCCnuclear export126/8552154/187231.88e-202.65e-18126
Page: 1 2 3 4 5 6 7 8 9 

check button Enriched KEGG pathways.
Pathway IDTissueDisease StageDescriptionGene RatioBg Ratiopvaluep.adjustqvalueCount
Page: 1 

Top

Cell-cell communication analysis

check buttonIdentification of potential cell-cell interactions between two cell types and their ligand-receptor pairs for different disease states
LigandReceptorLRpairPathwayTissueDisease Stage
Page: 1 

Top

Single-cell gene regulatory network inference analysis

check buttonFind out the significant the regulons (TFs) and the target genes of each regulon across cell types for different disease states
TFCell TypeTissueDisease StageTarget GeneRSSRegulon Activity
∗The dot plots of a searched regulon are shown for all cell subpopulations in each disease state of each tissue based on the regulon specific score inferred using pySCENIC and by calculating the average expression.
Page: 1 

Top

Somatic mutation of malignant transformation related genes

check buttonAnnotation of somatic variants for genes involved in malignant transformation
Hugo SymbolVariant ClassVariant ClassificationdbSNP RSHGVScHGVSpHGVSp ShortSWISSPROTBIOTYPESIFTPolyPhenTumor Sample BarcodeTissueHistologySexAgeStageTherapy TypesDrugsOutcome
CTDSPL2SNVMissense_Mutationnovelc.164T>Gp.Phe55Cysp.F55CQ05D32protein_codingdeleterious_low_confidence(0)possibly_damaging(0.817)TCGA-AN-A046-01Breastbreast invasive carcinomaFemale>=65I/IIUnknownUnknownSD
CTDSPL2SNVMissense_Mutationnovelc.670C>Tp.Arg224Cysp.R224CQ05D32protein_codingtolerated(0.11)possibly_damaging(0.446)TCGA-AN-A046-01Breastbreast invasive carcinomaFemale>=65I/IIUnknownUnknownSD
CTDSPL2deletionFrame_Shift_Delnovelc.371_381delNNNNNNNNNNNp.Lys125Terp.K125*Q05D32protein_codingTCGA-PE-A5DC-01Breastbreast invasive carcinomaFemale>=65III/IVUnknownUnknownSD
CTDSPL2SNVMissense_Mutationc.1210N>Cp.Asp404Hisp.D404HQ05D32protein_codingdeleterious(0)probably_damaging(1)TCGA-C5-A1BI-01Cervixcervical & endocervical cancerFemale<65III/IVChemotherapycisplatinSD
CTDSPL2SNVMissense_Mutationc.1210G>Tp.Asp404Tyrp.D404YQ05D32protein_codingdeleterious(0)probably_damaging(1)TCGA-C5-A8YQ-01Cervixcervical & endocervical cancerFemale>=65I/IIChemotherapycisplatinPD
CTDSPL2SNVMissense_Mutationnovelc.488N>Tp.Ser163Leup.S163LQ05D32protein_codingdeleterious(0.02)probably_damaging(0.946)TCGA-ZJ-AAXD-01Cervixcervical & endocervical cancerFemale<65III/IVUnknownUnknownSD
CTDSPL2SNVMissense_Mutationc.220A>Cp.Ile74Leup.I74LQ05D32protein_codingtolerated_low_confidence(0.49)benign(0)TCGA-AA-3510-01Colorectumcolon adenocarcinomaMale>=65I/IIUnknownUnknownSD
CTDSPL2SNVMissense_Mutationc.155N>Ap.Ile52Asnp.I52NQ05D32protein_codingdeleterious_low_confidence(0)probably_damaging(0.997)TCGA-AA-A022-01Colorectumcolon adenocarcinomaFemale>=65I/IIUnknownUnknownSD
CTDSPL2SNVMissense_Mutationc.56N>Ap.Arg19Hisp.R19HQ05D32protein_codingtolerated_low_confidence(0.18)benign(0.005)TCGA-CA-6717-01Colorectumcolon adenocarcinomaMale<65I/IIChemotherapyoxaliplatinCR
CTDSPL2SNVMissense_Mutationc.1117N>Tp.Arg373Trpp.R373WQ05D32protein_codingdeleterious(0)probably_damaging(1)TCGA-AG-4001-01Colorectumrectum adenocarcinomaFemale>=65I/IIUnknownUnknownSD
Page: 1 2 3 4 5 

Top

Related drugs of malignant transformation related genes

check buttonIdentification of chemicals and drugs interact with genes involved in malignant transfromation
(DGIdb 4.0)
Entrez IDSymbolCategoryInteraction TypesDrug Claim NameDrug NamePMIDs
Page: 1