
|
|||||
|
 | |
| |
| |
| |
| |
| |
|
Gene: CTDSP1 |
Gene summary for CTDSP1 |
| Gene information | Species | Human | Gene symbol | CTDSP1 | Gene ID | 58190 |
| Gene name | CTD small phosphatase 1 | |
| Gene Alias | NIF3 | |
| Cytomap | 2q35 | |
| Gene Type | protein-coding | GO ID | GO:0000082 | UniProtAcc | Q9GZU7 |
Top |
Malignant transformation analysis |
| Identification of the aberrant gene expression in precancerous and cancerous lesions by comparing the gene expression of stem-like cells in diseased tissues with normal stem cells |
| Entrez ID | Symbol | Replicates | Species | Organ | Tissue | Adj P-value | Log2FC | Malignancy |
| 58190 | CTDSP1 | HTA11_3410_2000001011 | Human | Colorectum | AD | 6.21e-05 | 2.37e-01 | 0.0155 |
| 58190 | CTDSP1 | HTA11_2487_2000001011 | Human | Colorectum | SER | 3.38e-16 | 7.13e-01 | -0.1808 |
| 58190 | CTDSP1 | HTA11_1938_2000001011 | Human | Colorectum | AD | 6.55e-10 | 5.70e-01 | -0.0811 |
| 58190 | CTDSP1 | HTA11_347_2000001011 | Human | Colorectum | AD | 3.41e-14 | 5.01e-01 | -0.1954 |
| 58190 | CTDSP1 | HTA11_411_2000001011 | Human | Colorectum | SER | 1.39e-04 | 8.41e-01 | -0.2602 |
| 58190 | CTDSP1 | HTA11_2112_2000001011 | Human | Colorectum | SER | 1.51e-04 | 6.42e-01 | -0.2196 |
| 58190 | CTDSP1 | HTA11_3361_2000001011 | Human | Colorectum | AD | 1.21e-06 | 4.76e-01 | -0.1207 |
| 58190 | CTDSP1 | HTA11_83_2000001011 | Human | Colorectum | SER | 9.39e-04 | 4.76e-01 | -0.1526 |
| 58190 | CTDSP1 | HTA11_696_2000001011 | Human | Colorectum | AD | 1.86e-23 | 5.54e-01 | -0.1464 |
| 58190 | CTDSP1 | HTA11_866_2000001011 | Human | Colorectum | AD | 1.12e-09 | 3.75e-01 | -0.1001 |
| 58190 | CTDSP1 | HTA11_1391_2000001011 | Human | Colorectum | AD | 2.20e-14 | 5.37e-01 | -0.059 |
| 58190 | CTDSP1 | HTA11_2992_2000001011 | Human | Colorectum | SER | 2.72e-06 | 6.61e-01 | -0.1706 |
| 58190 | CTDSP1 | HTA11_5212_2000001011 | Human | Colorectum | AD | 7.05e-04 | 5.97e-01 | -0.2061 |
| 58190 | CTDSP1 | HTA11_546_2000001011 | Human | Colorectum | AD | 7.10e-05 | 4.91e-01 | -0.0842 |
| 58190 | CTDSP1 | HTA11_866_3004761011 | Human | Colorectum | AD | 2.86e-07 | 3.56e-01 | 0.096 |
| 58190 | CTDSP1 | HTA11_10623_2000001011 | Human | Colorectum | AD | 2.34e-03 | 4.14e-01 | -0.0177 |
| 58190 | CTDSP1 | HTA11_6801_2000001011 | Human | Colorectum | SER | 3.94e-06 | 6.49e-01 | 0.0171 |
| 58190 | CTDSP1 | HTA11_10711_2000001011 | Human | Colorectum | AD | 4.12e-07 | 4.04e-01 | 0.0338 |
| 58190 | CTDSP1 | HTA11_7696_3000711011 | Human | Colorectum | AD | 4.89e-20 | 5.48e-01 | 0.0674 |
| 58190 | CTDSP1 | HTA11_6818_2000001021 | Human | Colorectum | AD | 1.84e-04 | 3.41e-01 | 0.0588 |
| Page: 1 2 3 4 5 6 7 |
| Tissue | Expression Dynamics | Abbreviation |
| Colorectum (GSE201348) |  | FAP: Familial adenomatous polyposis |
| CRC: Colorectal cancer | ||
| Colorectum (HTA11) |  | AD: Adenomas |
| SER: Sessile serrated lesions | ||
| MSI-H: Microsatellite-high colorectal cancer | ||
| MSS: Microsatellite stable colorectal cancer | ||
| Esophagus | 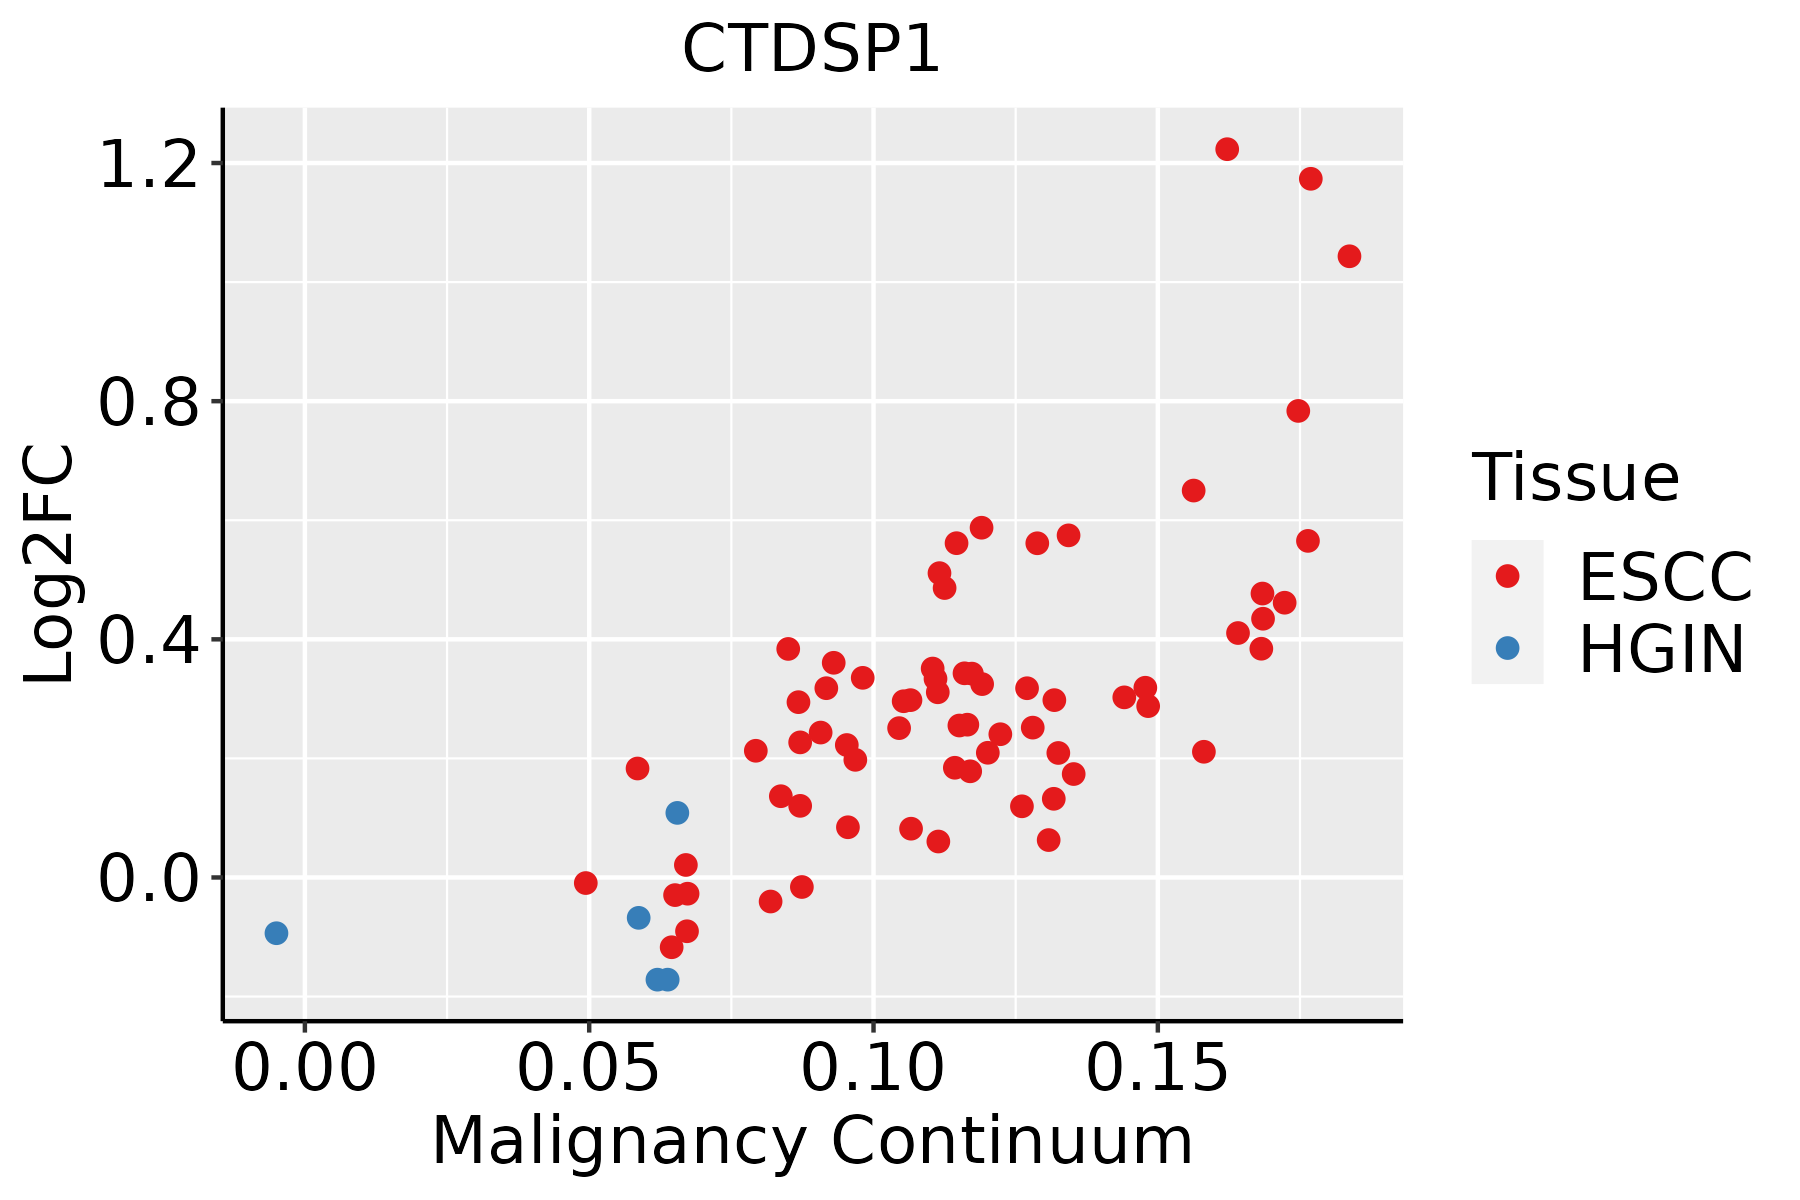 | ESCC: Esophageal squamous cell carcinoma |
| HGIN: High-grade intraepithelial neoplasias | ||
| LGIN: Low-grade intraepithelial neoplasias | ||
| Liver | 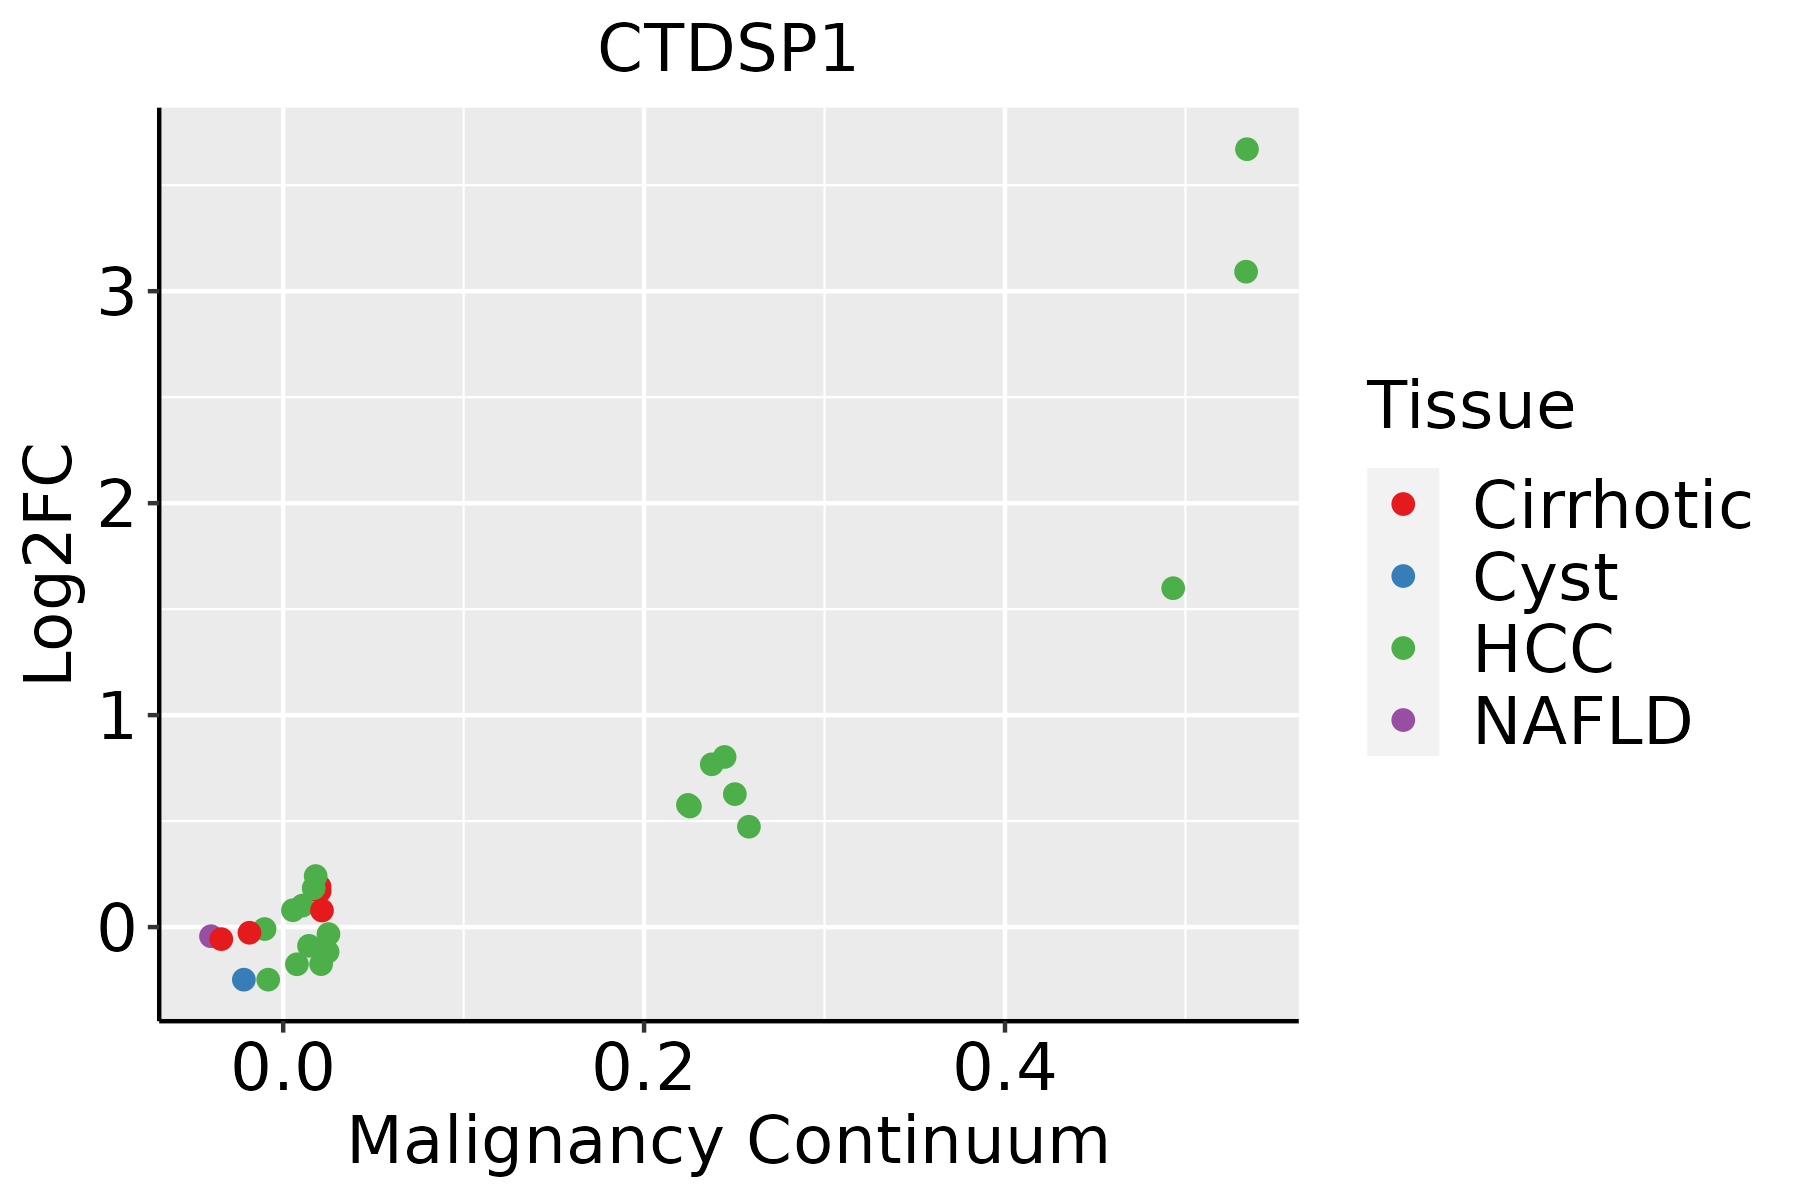 | HCC: Hepatocellular carcinoma |
| NAFLD: Non-alcoholic fatty liver disease | ||
| Oral Cavity |  | EOLP: Erosive Oral lichen planus |
| LP: leukoplakia | ||
| NEOLP: Non-erosive oral lichen planus | ||
| OSCC: Oral squamous cell carcinoma | ||
| Skin | 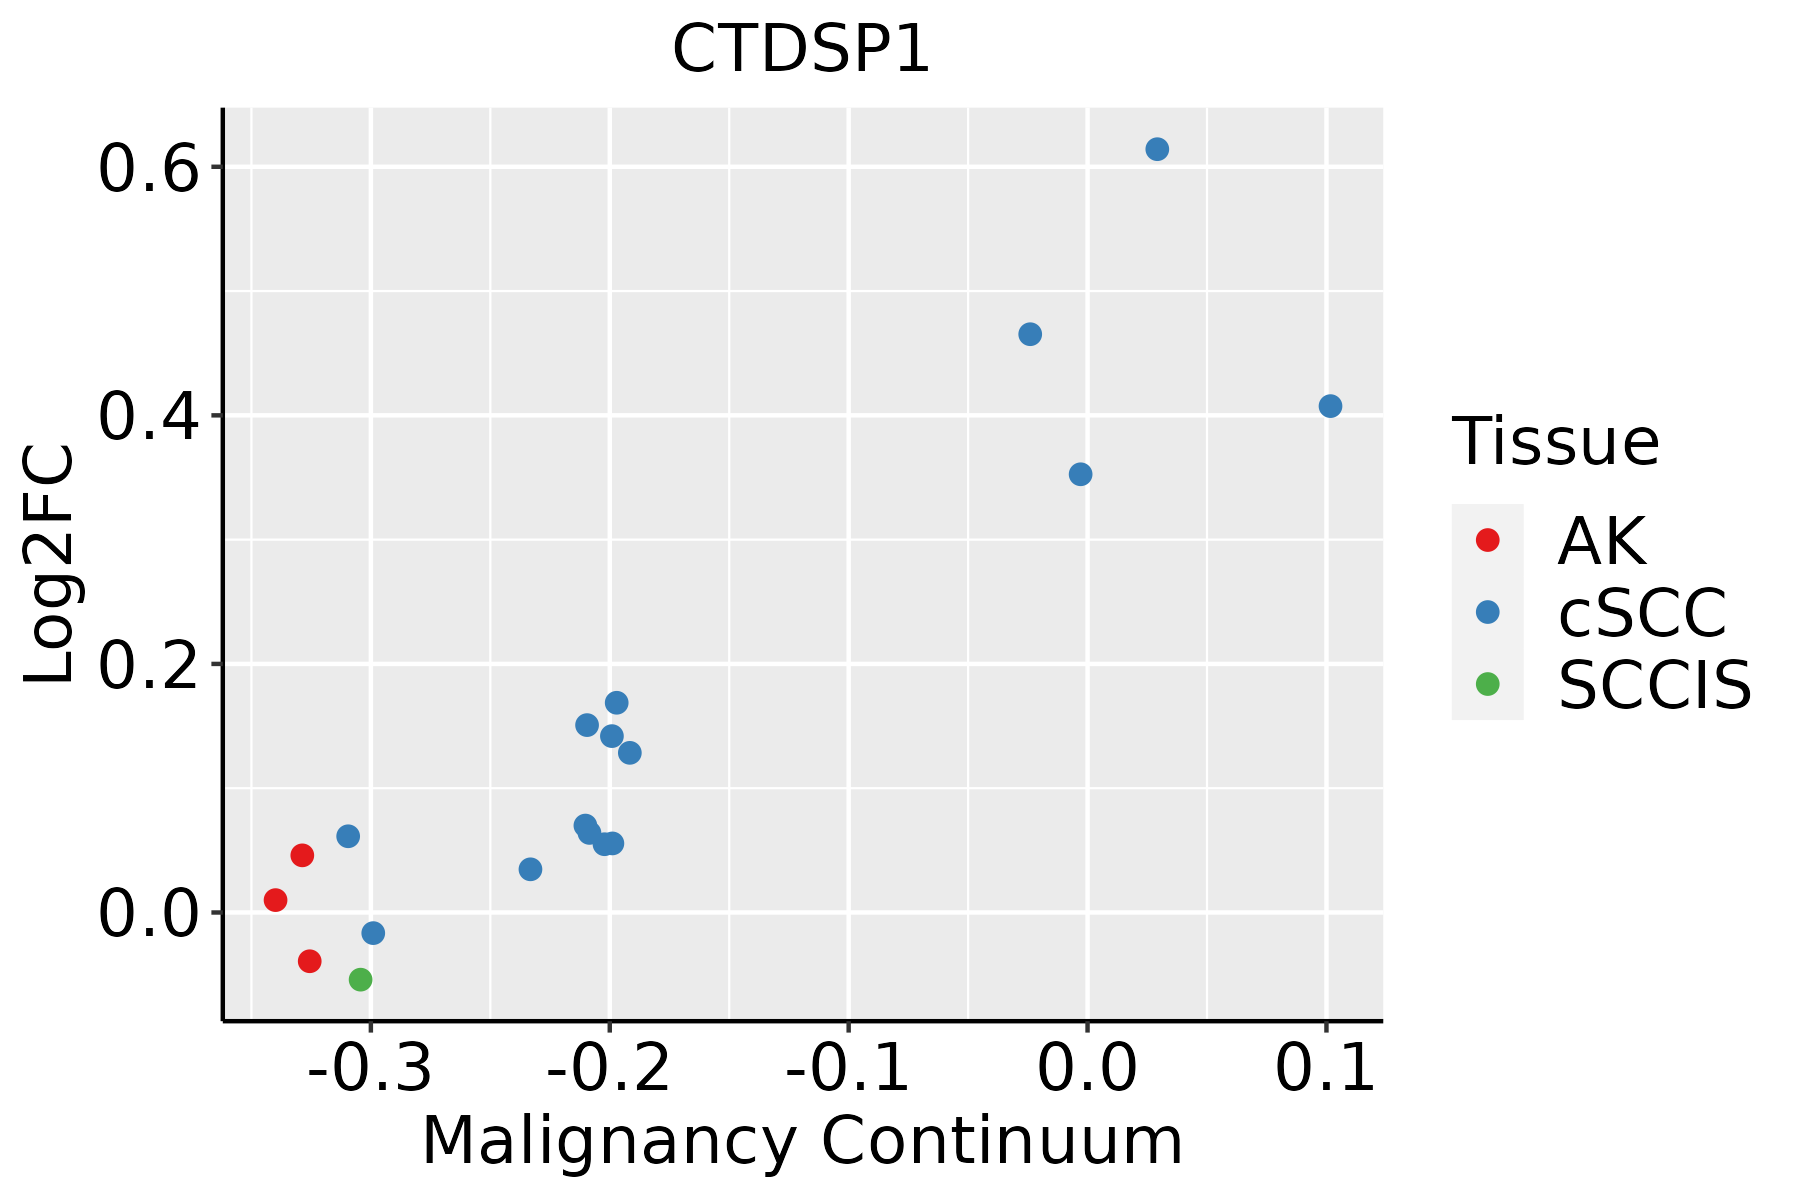 | AK: Actinic keratosis |
| cSCC: Cutaneous squamous cell carcinoma | ||
| SCCIS:squamous cell carcinoma in situ | ||
| Thyroid | 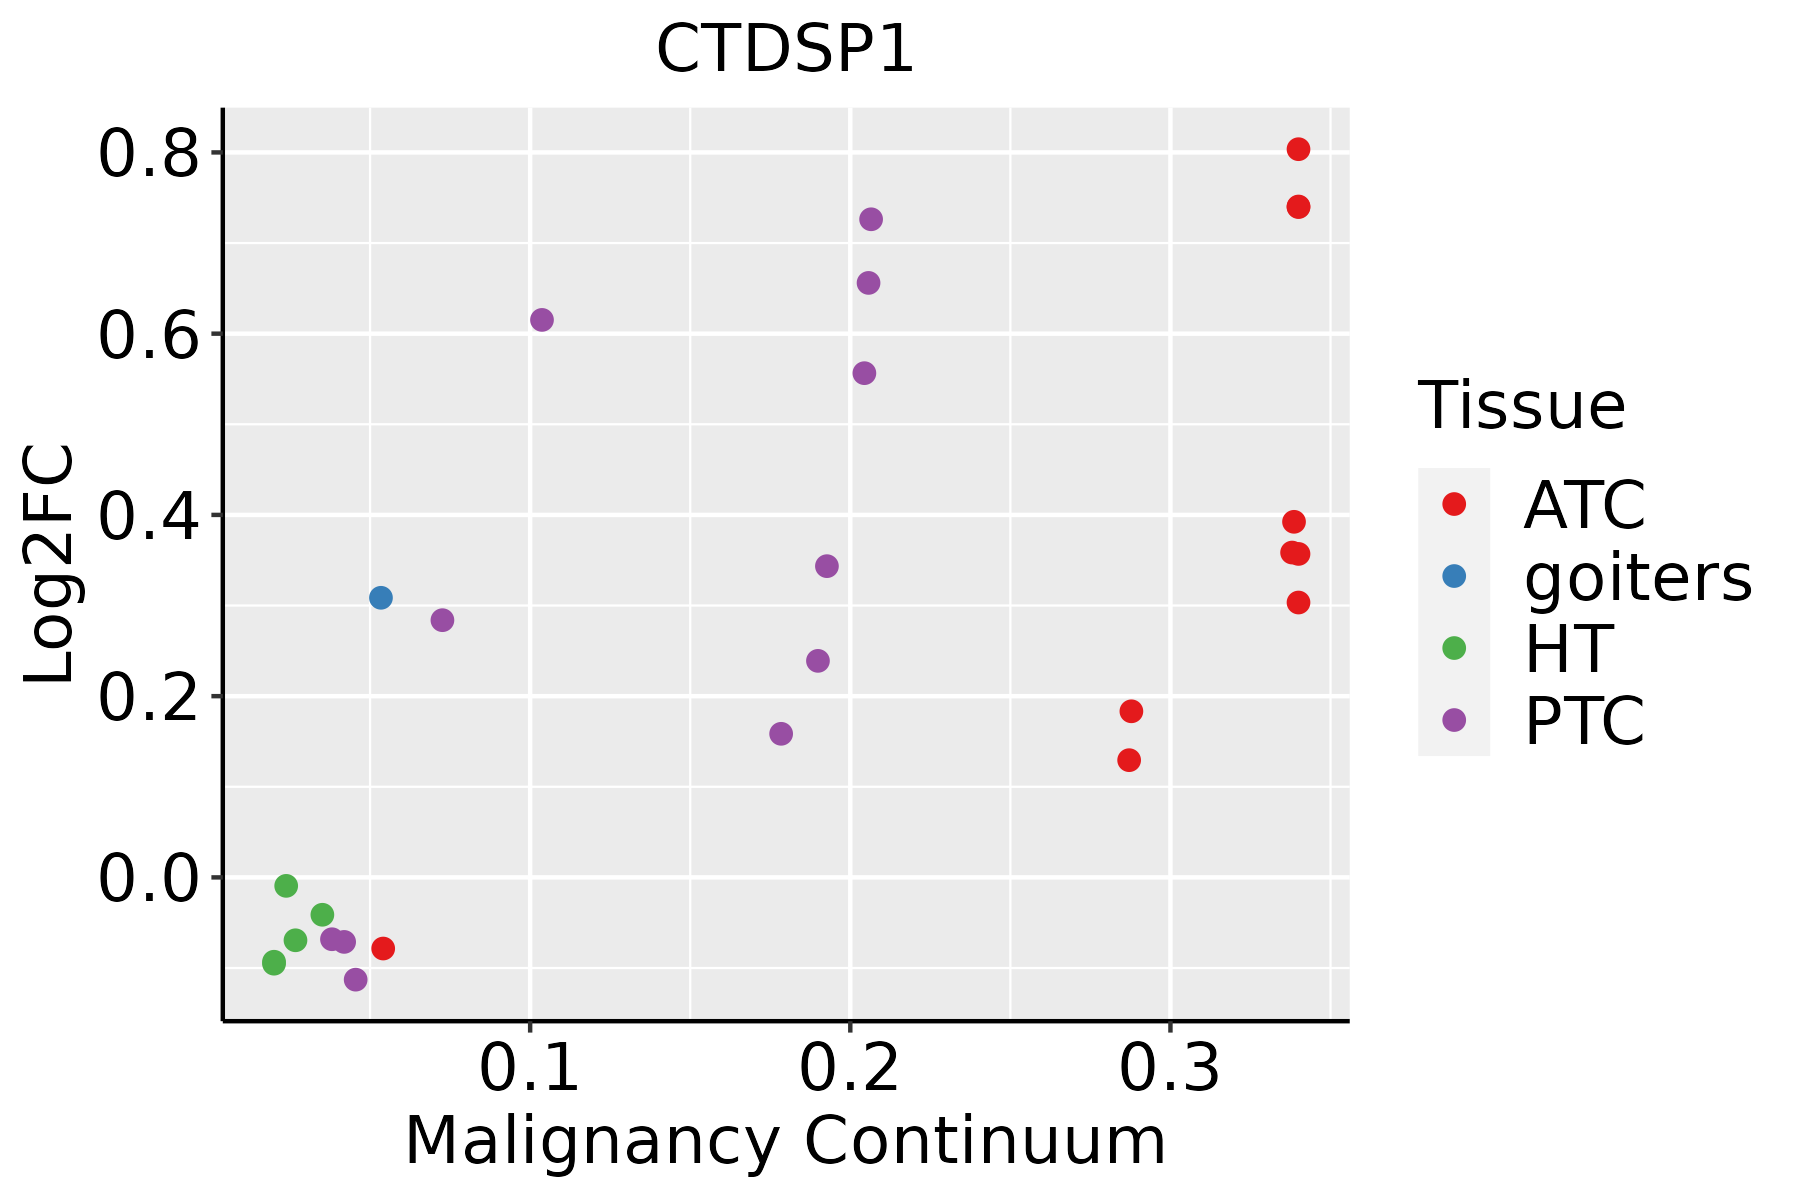 | ATC: Anaplastic thyroid cancer |
| HT: Hashimoto's thyroiditis | ||
| PTC: Papillary thyroid cancer |
| ∗log2FC in expression of this searched gene in stem-like cells from each diseased tissue sample relative to stem-like cells in normal samples in each tissue plotted against the malignancy continuum. Samples are colored based on if they are from different disease stage. |
Top |
Malignant transformation related pathway analysis |
| Find out the enriched GO biological processes and KEGG pathways involved in transition from healthy to precancer to cancer |
| Tissue | Disease Stage | Enriched GO biological Processes |
| Colorectum | AD |  |
| Colorectum | SER |  |
| Colorectum | MSS |  |
| Colorectum | MSI-H |  |
| Colorectum | FAP |  |
| ∗Top 15 enriched GO BP terms are showed in the bar plot of each disease state in each tissue. Each row represents a significant GO biological process which is colored according to the -log10(p.adjust). |
| Page: 1 2 3 4 5 6 7 8 9 |
| GO ID | Tissue | Disease Stage | Description | Gene Ratio | Bg Ratio | pvalue | p.adjust | Count |
| GO:0010563 | Colorectum | AD | negative regulation of phosphorus metabolic process | 130/3918 | 442/18723 | 1.26e-05 | 2.76e-04 | 130 |
| GO:0045936 | Colorectum | AD | negative regulation of phosphate metabolic process | 129/3918 | 441/18723 | 1.81e-05 | 3.76e-04 | 129 |
| GO:0016311 | Colorectum | AD | dephosphorylation | 123/3918 | 417/18723 | 1.84e-05 | 3.82e-04 | 123 |
| GO:0006470 | Colorectum | AD | protein dephosphorylation | 88/3918 | 281/18723 | 2.56e-05 | 4.89e-04 | 88 |
| GO:0042326 | Colorectum | AD | negative regulation of phosphorylation | 112/3918 | 385/18723 | 8.02e-05 | 1.27e-03 | 112 |
| GO:0001933 | Colorectum | AD | negative regulation of protein phosphorylation | 101/3918 | 342/18723 | 9.39e-05 | 1.42e-03 | 101 |
| GO:0050767 | Colorectum | AD | regulation of neurogenesis | 99/3918 | 364/18723 | 2.35e-03 | 1.82e-02 | 99 |
| GO:0007346 | Colorectum | AD | regulation of mitotic cell cycle | 119/3918 | 457/18723 | 4.60e-03 | 3.14e-02 | 119 |
| GO:00105631 | Colorectum | SER | negative regulation of phosphorus metabolic process | 101/2897 | 442/18723 | 2.39e-05 | 6.70e-04 | 101 |
| GO:00459361 | Colorectum | SER | negative regulation of phosphate metabolic process | 100/2897 | 441/18723 | 3.62e-05 | 9.39e-04 | 100 |
| GO:00019331 | Colorectum | SER | negative regulation of protein phosphorylation | 79/2897 | 342/18723 | 1.21e-04 | 2.49e-03 | 79 |
| GO:00423261 | Colorectum | SER | negative regulation of phosphorylation | 86/2897 | 385/18723 | 2.10e-04 | 3.78e-03 | 86 |
| GO:00064701 | Colorectum | SER | protein dephosphorylation | 65/2897 | 281/18723 | 4.44e-04 | 6.51e-03 | 65 |
| GO:00163111 | Colorectum | SER | dephosphorylation | 86/2897 | 417/18723 | 2.73e-03 | 2.46e-02 | 86 |
| GO:00105632 | Colorectum | MSS | negative regulation of phosphorus metabolic process | 118/3467 | 442/18723 | 1.18e-05 | 2.77e-04 | 118 |
| GO:00459362 | Colorectum | MSS | negative regulation of phosphate metabolic process | 117/3467 | 441/18723 | 1.74e-05 | 3.84e-04 | 117 |
| GO:00423262 | Colorectum | MSS | negative regulation of phosphorylation | 103/3467 | 385/18723 | 3.76e-05 | 7.17e-04 | 103 |
| GO:00019332 | Colorectum | MSS | negative regulation of protein phosphorylation | 93/3467 | 342/18723 | 4.54e-05 | 8.35e-04 | 93 |
| GO:00507671 | Colorectum | MSS | regulation of neurogenesis | 94/3467 | 364/18723 | 3.12e-04 | 4.06e-03 | 94 |
| GO:00064702 | Colorectum | MSS | protein dephosphorylation | 73/3467 | 281/18723 | 1.15e-03 | 1.12e-02 | 73 |
| Page: 1 2 3 4 5 6 7 8 9 |
| Pathway ID | Tissue | Disease Stage | Description | Gene Ratio | Bg Ratio | pvalue | p.adjust | qvalue | Count |
| Page: 1 |
Top |
Cell-cell communication analysis |
| Identification of potential cell-cell interactions between two cell types and their ligand-receptor pairs for different disease states |
| Ligand | Receptor | LRpair | Pathway | Tissue | Disease Stage |
| Page: 1 |
Top |
Single-cell gene regulatory network inference analysis |
| Find out the significant the regulons (TFs) and the target genes of each regulon across cell types for different disease states |
| TF | Cell Type | Tissue | Disease Stage | Target Gene | RSS | Regulon Activity |
| ∗The dot plots of a searched regulon are shown for all cell subpopulations in each disease state of each tissue based on the regulon specific score inferred using pySCENIC and by calculating the average expression. |
| Page: 1 |
Top |
Somatic mutation of malignant transformation related genes |
| Annotation of somatic variants for genes involved in malignant transformation |
| Hugo Symbol | Variant Class | Variant Classification | dbSNP RS | HGVSc | HGVSp | HGVSp Short | SWISSPROT | BIOTYPE | SIFT | PolyPhen | Tumor Sample Barcode | Tissue | Histology | Sex | Age | Stage | Therapy Types | Drugs | Outcome |
| CTDSP1 | SNV | Missense_Mutation | c.687G>C | p.Met229Ile | p.M229I | Q9GZU7 | protein_coding | tolerated(0.1) | benign(0.058) | TCGA-A2-A04W-01 | Breast | breast invasive carcinoma | Female | <65 | I/II | Chemotherapy | cytoxan | SD | |
| CTDSP1 | SNV | Missense_Mutation | c.223C>T | p.Pro75Ser | p.P75S | Q9GZU7 | protein_coding | tolerated(0.06) | benign(0.013) | TCGA-AN-A0FT-01 | Breast | breast invasive carcinoma | Female | <65 | I/II | Unknown | Unknown | SD | |
| CTDSP1 | SNV | Missense_Mutation | novel | c.517N>T | p.Arg173Trp | p.R173W | Q9GZU7 | protein_coding | deleterious(0) | probably_damaging(0.995) | TCGA-C5-A8YQ-01 | Cervix | cervical & endocervical cancer | Female | >=65 | I/II | Chemotherapy | cisplatin | PD |
| CTDSP1 | SNV | Missense_Mutation | novel | c.691G>A | p.Asp231Asn | p.D231N | Q9GZU7 | protein_coding | deleterious(0) | probably_damaging(0.999) | TCGA-HM-A4S6-01 | Cervix | cervical & endocervical cancer | Female | <65 | III/IV | Chemotherapy | cisplatin | CR |
| CTDSP1 | SNV | Missense_Mutation | c.137N>G | p.Val46Gly | p.V46G | Q9GZU7 | protein_coding | deleterious(0.02) | benign(0.209) | TCGA-AA-3939-01 | Colorectum | colon adenocarcinoma | Male | >=65 | I/II | Unknown | Unknown | SD | |
| CTDSP1 | SNV | Missense_Mutation | novel | c.671C>T | p.Ser224Leu | p.S224L | Q9GZU7 | protein_coding | deleterious(0) | probably_damaging(0.996) | TCGA-AA-3984-01 | Colorectum | colon adenocarcinoma | Female | <65 | I/II | Unknown | Unknown | SD |
| CTDSP1 | SNV | Missense_Mutation | c.475G>A | p.Ala159Thr | p.A159T | Q9GZU7 | protein_coding | deleterious(0.02) | probably_damaging(0.95) | TCGA-AY-A71X-01 | Colorectum | colon adenocarcinoma | Female | <65 | I/II | Unknown | Unknown | SD | |
| CTDSP1 | SNV | Missense_Mutation | c.699N>T | p.Glu233Asp | p.E233D | Q9GZU7 | protein_coding | deleterious(0) | probably_damaging(0.985) | TCGA-G4-6588-01 | Colorectum | colon adenocarcinoma | Female | <65 | I/II | Unknown | Unknown | SD | |
| CTDSP1 | SNV | Missense_Mutation | novel | c.745N>C | p.Asp249His | p.D249H | Q9GZU7 | protein_coding | tolerated(0.06) | probably_damaging(0.977) | TCGA-4E-A92E-01 | Endometrium | uterine corpus endometrioid carcinoma | Female | <65 | I/II | Unknown | Unknown | SD |
| CTDSP1 | SNV | Missense_Mutation | novel | c.748N>A | p.Val250Met | p.V250M | Q9GZU7 | protein_coding | deleterious(0) | probably_damaging(0.981) | TCGA-A5-A0G1-01 | Endometrium | uterine corpus endometrioid carcinoma | Female | >=65 | I/II | Unknown | Unknown | SD |
| Page: 1 2 3 4 |
Top |
Related drugs of malignant transformation related genes |
| Identification of chemicals and drugs interact with genes involved in malignant transfromation |
| (DGIdb 4.0) |
| Entrez ID | Symbol | Category | Interaction Types | Drug Claim Name | Drug Name | PMIDs |
| 58190 | CTDSP1 | DRUGGABLE GENOME, PROTEIN PHOSPHATASE | GNF-PF-3060 | CHEMBL581449 | ||
| 58190 | CTDSP1 | DRUGGABLE GENOME, PROTEIN PHOSPHATASE | CEFUROXIME SODIUM | CEFUROXIME SODIUM | ||
| 58190 | CTDSP1 | DRUGGABLE GENOME, PROTEIN PHOSPHATASE | CEPHALOTHIN | CEPHALOTHIN | ||
| 58190 | CTDSP1 | DRUGGABLE GENOME, PROTEIN PHOSPHATASE | LITHOCHOLIC ACID | LITHOCHOLIC ACID | ||
| 58190 | CTDSP1 | DRUGGABLE GENOME, PROTEIN PHOSPHATASE | GNF-PF-4353 | CHEMBL527307 | ||
| 58190 | CTDSP1 | DRUGGABLE GENOME, PROTEIN PHOSPHATASE | HESPERIDIN | HESPERIDIN | ||
| 58190 | CTDSP1 | DRUGGABLE GENOME, PROTEIN PHOSPHATASE | NALOXONE METHIODIDE | NALOXONE METHIODIDE | ||
| 58190 | CTDSP1 | DRUGGABLE GENOME, PROTEIN PHOSPHATASE | NSC-628113 | CHEMBL176599 | ||
| 58190 | CTDSP1 | DRUGGABLE GENOME, PROTEIN PHOSPHATASE | KAEMPFEROL | KAEMPFEROL | ||
| 58190 | CTDSP1 | DRUGGABLE GENOME, PROTEIN PHOSPHATASE | CEFDINIR | CEFDINIR |
| Page: 1 2 |

Copyright 2023-Present -The University of Texas Health Science Center at Houston |