
|
|||||
|
 | |
| |
| |
| |
| |
| |
|
Gene: CTCF |
Gene summary for CTCF |
| Gene information | Species | Human | Gene symbol | CTCF | Gene ID | 10664 |
| Gene name | CCCTC-binding factor | |
| Gene Alias | CFAP108 | |
| Cytomap | 16q22.1 | |
| Gene Type | protein-coding | GO ID | GO:0000122 | UniProtAcc | P49711 |
Top |
Malignant transformation analysis |
| Identification of the aberrant gene expression in precancerous and cancerous lesions by comparing the gene expression of stem-like cells in diseased tissues with normal stem cells |
| Entrez ID | Symbol | Replicates | Species | Organ | Tissue | Adj P-value | Log2FC | Malignancy |
| 10664 | CTCF | LZE4T | Human | Esophagus | ESCC | 4.74e-14 | 4.00e-01 | 0.0811 |
| 10664 | CTCF | LZE7T | Human | Esophagus | ESCC | 2.56e-03 | 2.35e-01 | 0.0667 |
| 10664 | CTCF | LZE22T | Human | Esophagus | ESCC | 7.69e-04 | 2.31e-01 | 0.068 |
| 10664 | CTCF | LZE24T | Human | Esophagus | ESCC | 8.12e-15 | 3.66e-01 | 0.0596 |
| 10664 | CTCF | P1T-E | Human | Esophagus | ESCC | 1.17e-13 | 5.93e-01 | 0.0875 |
| 10664 | CTCF | P2T-E | Human | Esophagus | ESCC | 2.92e-50 | 9.19e-01 | 0.1177 |
| 10664 | CTCF | P4T-E | Human | Esophagus | ESCC | 5.21e-28 | 6.83e-01 | 0.1323 |
| 10664 | CTCF | P5T-E | Human | Esophagus | ESCC | 1.72e-28 | 4.61e-01 | 0.1327 |
| 10664 | CTCF | P8T-E | Human | Esophagus | ESCC | 2.34e-27 | 4.43e-01 | 0.0889 |
| 10664 | CTCF | P9T-E | Human | Esophagus | ESCC | 3.35e-11 | 3.13e-01 | 0.1131 |
| 10664 | CTCF | P10T-E | Human | Esophagus | ESCC | 1.96e-21 | 4.87e-01 | 0.116 |
| 10664 | CTCF | P11T-E | Human | Esophagus | ESCC | 1.56e-08 | 4.65e-01 | 0.1426 |
| 10664 | CTCF | P12T-E | Human | Esophagus | ESCC | 2.33e-19 | 3.47e-01 | 0.1122 |
| 10664 | CTCF | P15T-E | Human | Esophagus | ESCC | 5.76e-22 | 4.50e-01 | 0.1149 |
| 10664 | CTCF | P16T-E | Human | Esophagus | ESCC | 5.51e-19 | 2.67e-01 | 0.1153 |
| 10664 | CTCF | P17T-E | Human | Esophagus | ESCC | 5.42e-04 | 2.05e-01 | 0.1278 |
| 10664 | CTCF | P20T-E | Human | Esophagus | ESCC | 1.71e-11 | 2.64e-01 | 0.1124 |
| 10664 | CTCF | P21T-E | Human | Esophagus | ESCC | 6.16e-18 | 2.66e-01 | 0.1617 |
| 10664 | CTCF | P22T-E | Human | Esophagus | ESCC | 1.14e-19 | 3.99e-01 | 0.1236 |
| 10664 | CTCF | P23T-E | Human | Esophagus | ESCC | 2.07e-22 | 5.60e-01 | 0.108 |
| Page: 1 2 3 4 5 6 |
| Tissue | Expression Dynamics | Abbreviation |
| Esophagus | 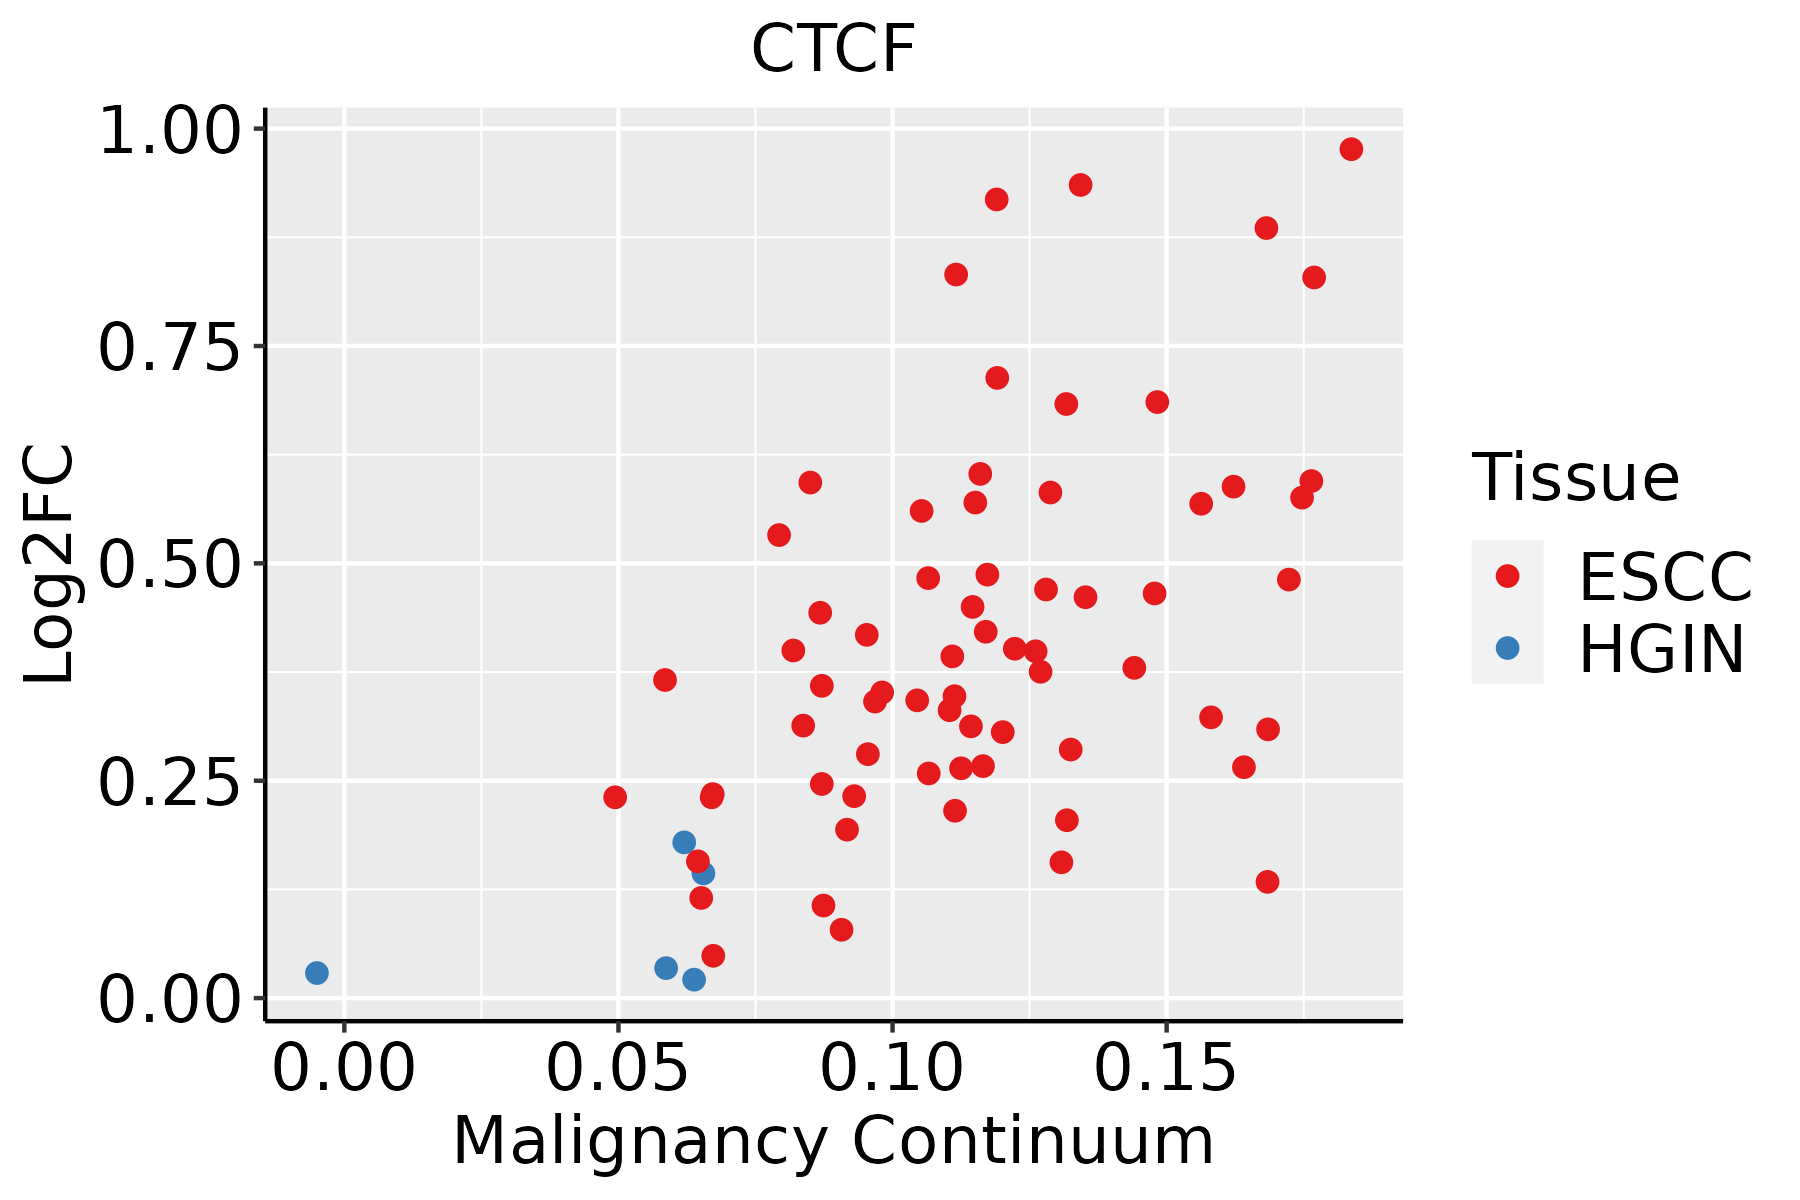 | ESCC: Esophageal squamous cell carcinoma |
| HGIN: High-grade intraepithelial neoplasias | ||
| LGIN: Low-grade intraepithelial neoplasias | ||
| Liver | 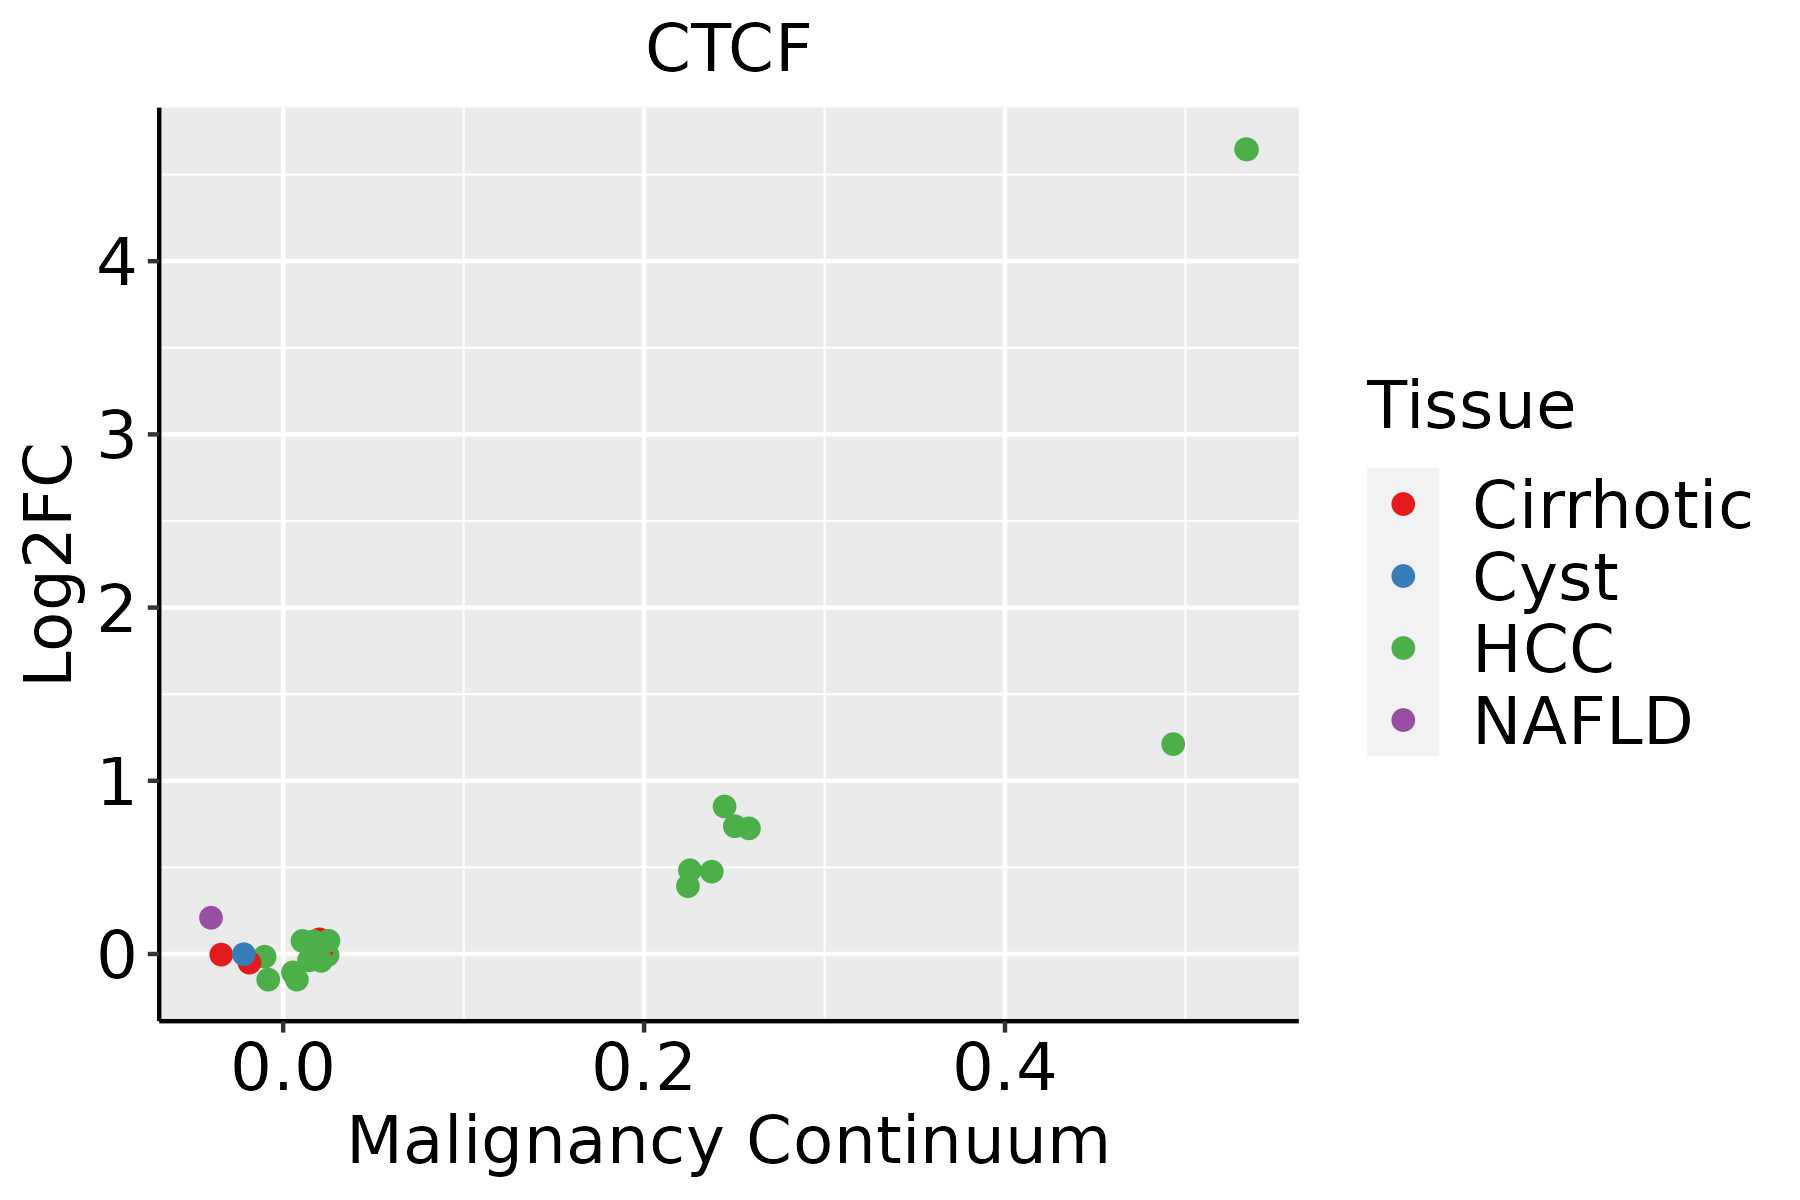 | HCC: Hepatocellular carcinoma |
| NAFLD: Non-alcoholic fatty liver disease | ||
| Oral Cavity | 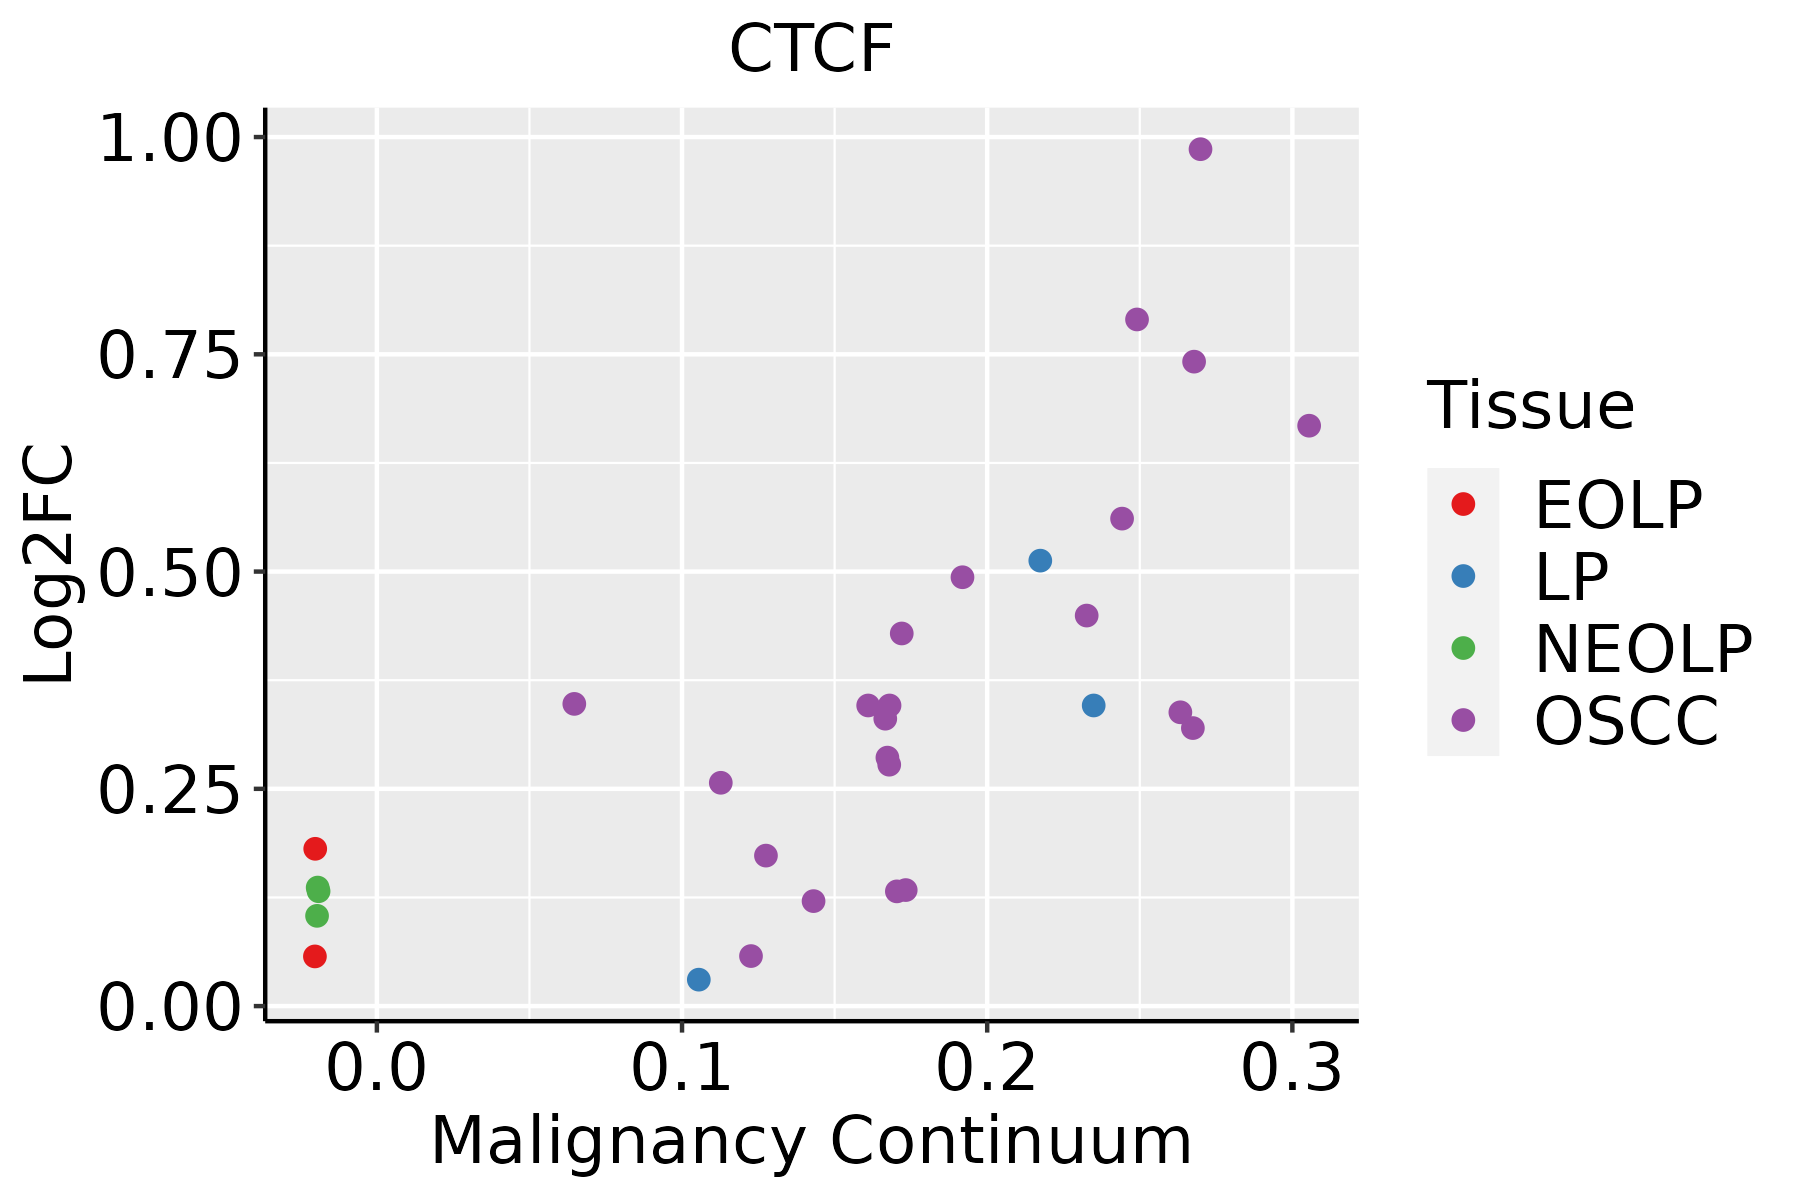 | EOLP: Erosive Oral lichen planus |
| LP: leukoplakia | ||
| NEOLP: Non-erosive oral lichen planus | ||
| OSCC: Oral squamous cell carcinoma | ||
| Prostate |  | BPH: Benign Prostatic Hyperplasia |
| Skin | 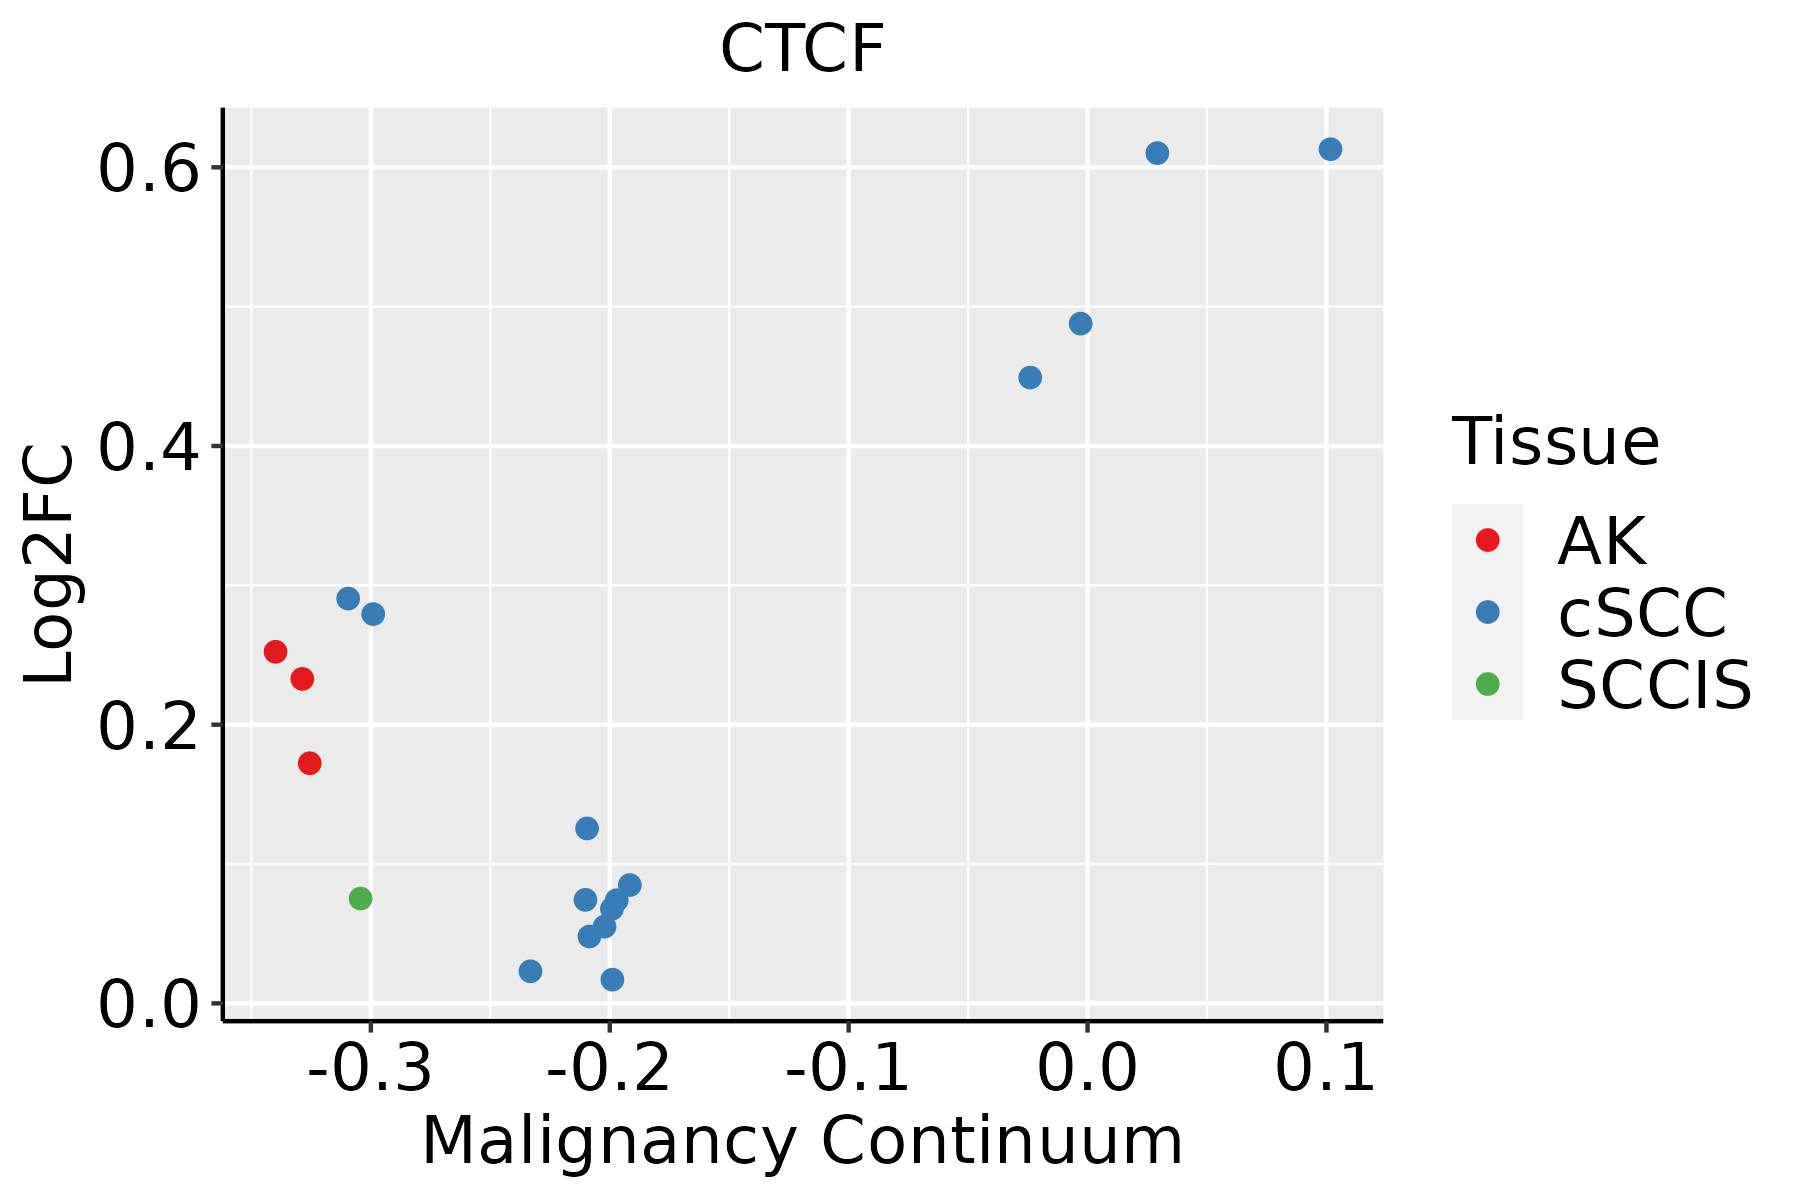 | AK: Actinic keratosis |
| cSCC: Cutaneous squamous cell carcinoma | ||
| SCCIS:squamous cell carcinoma in situ | ||
| Thyroid | 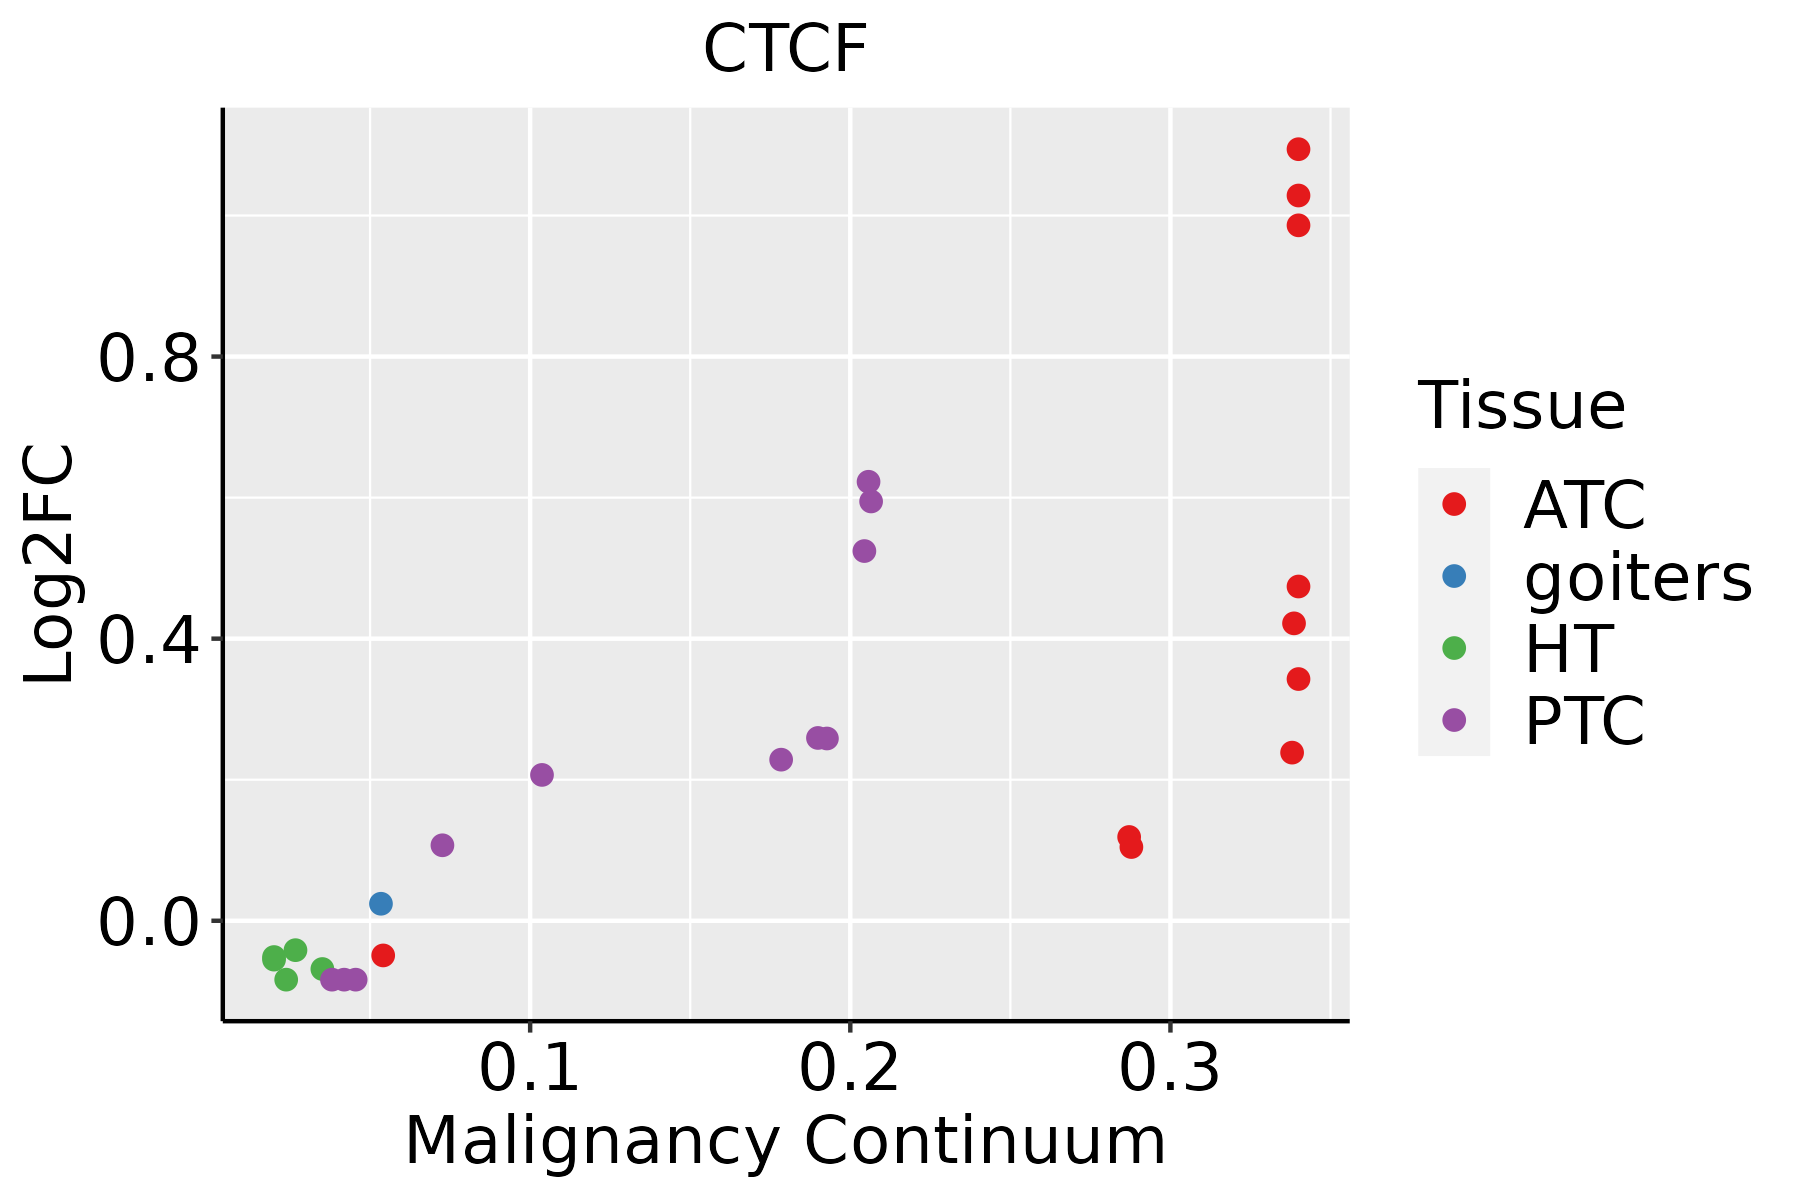 | ATC: Anaplastic thyroid cancer |
| HT: Hashimoto's thyroiditis | ||
| PTC: Papillary thyroid cancer |
| ∗log2FC in expression of this searched gene in stem-like cells from each diseased tissue sample relative to stem-like cells in normal samples in each tissue plotted against the malignancy continuum. Samples are colored based on if they are from different disease stage. |
Top |
Malignant transformation related pathway analysis |
| Find out the enriched GO biological processes and KEGG pathways involved in transition from healthy to precancer to cancer |
| Tissue | Disease Stage | Enriched GO biological Processes |
| Colorectum | AD |  |
| Colorectum | SER |  |
| Colorectum | MSS |  |
| Colorectum | MSI-H |  |
| Colorectum | FAP |  |
| ∗Top 15 enriched GO BP terms are showed in the bar plot of each disease state in each tissue. Each row represents a significant GO biological process which is colored according to the -log10(p.adjust). |
| Page: 1 2 3 4 5 6 7 8 9 |
| GO ID | Tissue | Disease Stage | Description | Gene Ratio | Bg Ratio | pvalue | p.adjust | Count |
| GO:001657015 | Esophagus | ESCC | histone modification | 323/8552 | 463/18723 | 2.61e-26 | 7.88e-24 | 323 |
| GO:00008194 | Esophagus | ESCC | sister chromatid segregation | 157/8552 | 202/18723 | 8.41e-21 | 1.33e-18 | 157 |
| GO:001820514 | Esophagus | ESCC | peptidyl-lysine modification | 259/8552 | 376/18723 | 3.90e-20 | 5.26e-18 | 259 |
| GO:003304416 | Esophagus | ESCC | regulation of chromosome organization | 145/8552 | 187/18723 | 3.80e-19 | 4.31e-17 | 145 |
| GO:000705911 | Esophagus | ESCC | chromosome segregation | 238/8552 | 346/18723 | 1.72e-18 | 1.82e-16 | 238 |
| GO:001839413 | Esophagus | ESCC | peptidyl-lysine acetylation | 123/8552 | 169/18723 | 6.58e-13 | 2.94e-11 | 123 |
| GO:00988133 | Esophagus | ESCC | nuclear chromosome segregation | 187/8552 | 281/18723 | 1.00e-12 | 4.36e-11 | 187 |
| GO:004354313 | Esophagus | ESCC | protein acylation | 165/8552 | 243/18723 | 1.69e-12 | 7.14e-11 | 165 |
| GO:000647313 | Esophagus | ESCC | protein acetylation | 140/8552 | 201/18723 | 4.37e-12 | 1.69e-10 | 140 |
| GO:001839313 | Esophagus | ESCC | internal peptidyl-lysine acetylation | 114/8552 | 158/18723 | 1.16e-11 | 4.24e-10 | 114 |
| GO:000647513 | Esophagus | ESCC | internal protein amino acid acetylation | 115/8552 | 160/18723 | 1.43e-11 | 5.08e-10 | 115 |
| GO:00165735 | Esophagus | ESCC | histone acetylation | 110/8552 | 152/18723 | 1.95e-11 | 6.81e-10 | 110 |
| GO:00434143 | Esophagus | ESCC | macromolecule methylation | 199/8552 | 316/18723 | 3.44e-10 | 9.57e-09 | 199 |
| GO:003105614 | Esophagus | ESCC | regulation of histone modification | 106/8552 | 152/18723 | 1.52e-09 | 3.55e-08 | 106 |
| GO:00322592 | Esophagus | ESCC | methylation | 222/8552 | 364/18723 | 2.26e-09 | 5.09e-08 | 222 |
| GO:003450211 | Esophagus | ESCC | protein localization to chromosome | 70/8552 | 92/18723 | 2.54e-09 | 5.64e-08 | 70 |
| GO:000632517 | Esophagus | ESCC | chromatin organization | 240/8552 | 409/18723 | 6.52e-08 | 1.14e-06 | 240 |
| GO:00400295 | Esophagus | ESCC | regulation of gene expression, epigenetic | 74/8552 | 105/18723 | 2.24e-07 | 3.42e-06 | 74 |
| GO:000647914 | Esophagus | ESCC | protein methylation | 115/8552 | 181/18723 | 9.07e-07 | 1.16e-05 | 115 |
| GO:000821314 | Esophagus | ESCC | protein alkylation | 115/8552 | 181/18723 | 9.07e-07 | 1.16e-05 | 115 |
| Page: 1 2 3 4 5 6 7 8 9 10 11 12 13 |
| Pathway ID | Tissue | Disease Stage | Description | Gene Ratio | Bg Ratio | pvalue | p.adjust | qvalue | Count |
| Page: 1 |
Top |
Cell-cell communication analysis |
| Identification of potential cell-cell interactions between two cell types and their ligand-receptor pairs for different disease states |
| Ligand | Receptor | LRpair | Pathway | Tissue | Disease Stage |
| Page: 1 |
Top |
Single-cell gene regulatory network inference analysis |
| Find out the significant the regulons (TFs) and the target genes of each regulon across cell types for different disease states |
| TF | Cell Type | Tissue | Disease Stage | Target Gene | RSS | Regulon Activity |
| CTCF | TRANS | Cervix | ADJ | NFATC1,COL14A1,RNF20, etc. | 1.34e-01 |  |
| CTCF | BMEM | Endometrium | ADJ | AL133405.2,DRAXIN,TMEM94, etc. | 1.44e-01 |  |
| CTCF | STM | Esophagus | LGIN | SRRM2,MYO7A,H1FX, etc. | 7.21e-01 |  |
| CTCF | CD4TN | Liver | Cirrhotic | HOPX,PRKCA,FOXP1, etc. | 3.06e-01 |  |
| CTCF | STM | Thyroid | HT | HIST2H2AC,HIST1H4C,HIST1H2AG, etc. | 6.94e-01 |  |
| ∗The dot plots of a searched regulon are shown for all cell subpopulations in each disease state of each tissue based on the regulon specific score inferred using pySCENIC and by calculating the average expression. |
| Page: 1 |
Top |
Somatic mutation of malignant transformation related genes |
| Annotation of somatic variants for genes involved in malignant transformation |
| Hugo Symbol | Variant Class | Variant Classification | dbSNP RS | HGVSc | HGVSp | HGVSp Short | SWISSPROT | BIOTYPE | SIFT | PolyPhen | Tumor Sample Barcode | Tissue | Histology | Sex | Age | Stage | Therapy Types | Drugs | Outcome |
| CTCF | SNV | Missense_Mutation | c.2059G>A | p.Glu687Lys | p.E687K | P49711 | protein_coding | tolerated_low_confidence(0.46) | benign(0.001) | TCGA-3C-AALI-01 | Breast | breast invasive carcinoma | Female | <65 | I/II | Unspecific | Poly E | Complete Response | |
| CTCF | SNV | Missense_Mutation | c.1132N>G | p.Pro378Ala | p.P378A | P49711 | protein_coding | deleterious(0) | probably_damaging(0.998) | TCGA-A2-A0CQ-01 | Breast | breast invasive carcinoma | Female | <65 | I/II | Chemotherapy | adriamycin | SD | |
| CTCF | SNV | Missense_Mutation | c.850C>T | p.His284Tyr | p.H284Y | P49711 | protein_coding | deleterious(0) | probably_damaging(0.982) | TCGA-A8-A0AD-01 | Breast | breast invasive carcinoma | Female | >=65 | I/II | Hormone Therapy | tamoxiphen | SD | |
| CTCF | SNV | Missense_Mutation | c.772N>G | p.Lys258Glu | p.K258E | P49711 | protein_coding | deleterious(0.05) | probably_damaging(0.971) | TCGA-AN-A0FS-01 | Breast | breast invasive carcinoma | Female | <65 | I/II | Unknown | Unknown | SD | |
| CTCF | SNV | Missense_Mutation | c.1327N>C | p.Asp443His | p.D443H | P49711 | protein_coding | tolerated(0.13) | probably_damaging(0.999) | TCGA-B6-A0WZ-01 | Breast | breast invasive carcinoma | Female | <65 | I/II | Unknown | Unknown | PD | |
| CTCF | SNV | Missense_Mutation | c.850C>A | p.His284Asn | p.H284N | P49711 | protein_coding | deleterious(0) | probably_damaging(0.982) | TCGA-BH-A0DH-01 | Breast | breast invasive carcinoma | Female | <65 | I/II | Chemotherapy | cyclophosphamide | SD | |
| CTCF | SNV | Missense_Mutation | c.1133N>T | p.Pro378Leu | p.P378L | P49711 | protein_coding | deleterious(0) | probably_damaging(0.999) | TCGA-BH-A0EA-01 | Breast | breast invasive carcinoma | Female | >=65 | I/II | Chemotherapy | taxotere | CR | |
| CTCF | SNV | Missense_Mutation | c.847N>T | p.Arg283Cys | p.R283C | P49711 | protein_coding | deleterious(0) | probably_damaging(0.996) | TCGA-BH-A0W4-01 | Breast | breast invasive carcinoma | Female | <65 | I/II | Unknown | Unknown | SD | |
| CTCF | SNV | Missense_Mutation | c.851N>C | p.His284Pro | p.H284P | P49711 | protein_coding | deleterious(0) | probably_damaging(0.995) | TCGA-BH-A0W5-01 | Breast | breast invasive carcinoma | Female | >=65 | I/II | Hormone Therapy | arimidex | CR | |
| CTCF | SNV | Missense_Mutation | rs746080386 | c.1327G>A | p.Asp443Asn | p.D443N | P49711 | protein_coding | tolerated(0.68) | probably_damaging(0.996) | TCGA-BH-A1FU-01 | Breast | breast invasive carcinoma | Female | <65 | I/II | Unknown | Unknown | PD |
| Page: 1 2 3 4 5 6 7 8 9 10 11 12 13 14 15 16 17 18 19 20 |
Top |
Related drugs of malignant transformation related genes |
| Identification of chemicals and drugs interact with genes involved in malignant transfromation |
| (DGIdb 4.0) |
| Entrez ID | Symbol | Category | Interaction Types | Drug Claim Name | Drug Name | PMIDs |
| Page: 1 |

Copyright 2023-Present -The University of Texas Health Science Center at Houston |