
|
|||||
|
 | |
| |
| |
| |
| |
| |
|
Gene: CTBS |
Gene summary for CTBS |
| Gene information | Species | Human | Gene symbol | CTBS | Gene ID | 1486 |
| Gene name | chitobiase | |
| Gene Alias | CTB | |
| Cytomap | 1p22.3 | |
| Gene Type | protein-coding | GO ID | GO:0005975 | UniProtAcc | Q01459 |
Top |
Malignant transformation analysis |
| Identification of the aberrant gene expression in precancerous and cancerous lesions by comparing the gene expression of stem-like cells in diseased tissues with normal stem cells |
| Entrez ID | Symbol | Replicates | Species | Organ | Tissue | Adj P-value | Log2FC | Malignancy |
| 1486 | CTBS | LZE4T | Human | Esophagus | ESCC | 4.38e-09 | 2.27e-01 | 0.0811 |
| 1486 | CTBS | LZE7T | Human | Esophagus | ESCC | 2.45e-04 | 2.40e-01 | 0.0667 |
| 1486 | CTBS | LZE8T | Human | Esophagus | ESCC | 6.98e-04 | 2.30e-01 | 0.067 |
| 1486 | CTBS | LZE20T | Human | Esophagus | ESCC | 1.20e-06 | 1.13e-01 | 0.0662 |
| 1486 | CTBS | LZE24T | Human | Esophagus | ESCC | 1.13e-09 | 2.52e-01 | 0.0596 |
| 1486 | CTBS | LZE21T | Human | Esophagus | ESCC | 2.12e-02 | 3.06e-02 | 0.0655 |
| 1486 | CTBS | P1T-E | Human | Esophagus | ESCC | 3.57e-05 | 3.68e-01 | 0.0875 |
| 1486 | CTBS | P2T-E | Human | Esophagus | ESCC | 2.55e-31 | 6.01e-01 | 0.1177 |
| 1486 | CTBS | P4T-E | Human | Esophagus | ESCC | 4.91e-14 | 3.70e-01 | 0.1323 |
| 1486 | CTBS | P5T-E | Human | Esophagus | ESCC | 6.27e-12 | 3.30e-01 | 0.1327 |
| 1486 | CTBS | P8T-E | Human | Esophagus | ESCC | 1.94e-25 | 5.20e-01 | 0.0889 |
| 1486 | CTBS | P9T-E | Human | Esophagus | ESCC | 5.05e-15 | 3.52e-01 | 0.1131 |
| 1486 | CTBS | P10T-E | Human | Esophagus | ESCC | 4.69e-32 | 6.83e-01 | 0.116 |
| 1486 | CTBS | P11T-E | Human | Esophagus | ESCC | 3.04e-13 | 5.89e-01 | 0.1426 |
| 1486 | CTBS | P12T-E | Human | Esophagus | ESCC | 1.48e-72 | 1.43e+00 | 0.1122 |
| 1486 | CTBS | P15T-E | Human | Esophagus | ESCC | 8.32e-23 | 4.56e-01 | 0.1149 |
| 1486 | CTBS | P16T-E | Human | Esophagus | ESCC | 3.56e-22 | 3.40e-01 | 0.1153 |
| 1486 | CTBS | P17T-E | Human | Esophagus | ESCC | 1.92e-05 | 4.08e-01 | 0.1278 |
| 1486 | CTBS | P19T-E | Human | Esophagus | ESCC | 9.42e-15 | 9.12e-01 | 0.1662 |
| 1486 | CTBS | P20T-E | Human | Esophagus | ESCC | 1.25e-24 | 6.04e-01 | 0.1124 |
| Page: 1 2 3 4 5 6 |
| Tissue | Expression Dynamics | Abbreviation |
| Esophagus | 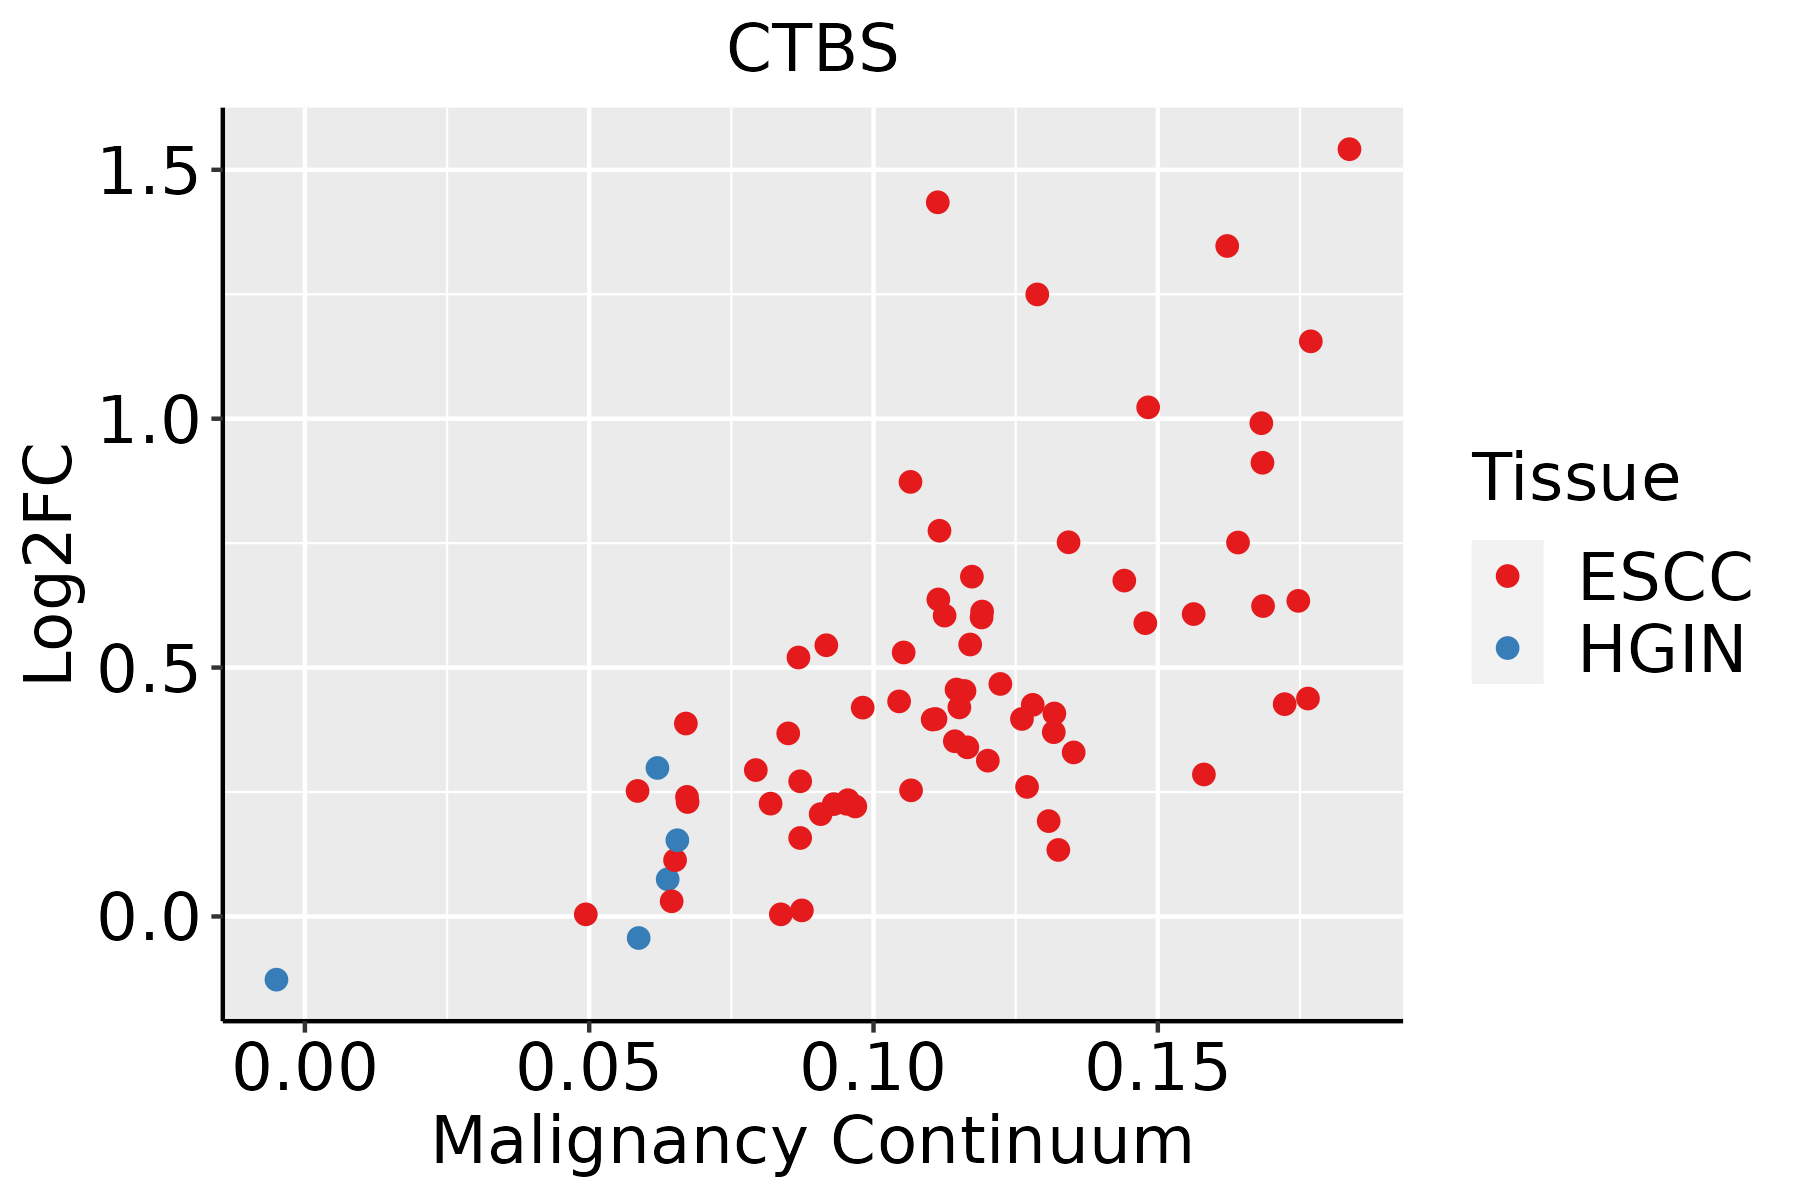 | ESCC: Esophageal squamous cell carcinoma |
| HGIN: High-grade intraepithelial neoplasias | ||
| LGIN: Low-grade intraepithelial neoplasias | ||
| Liver | 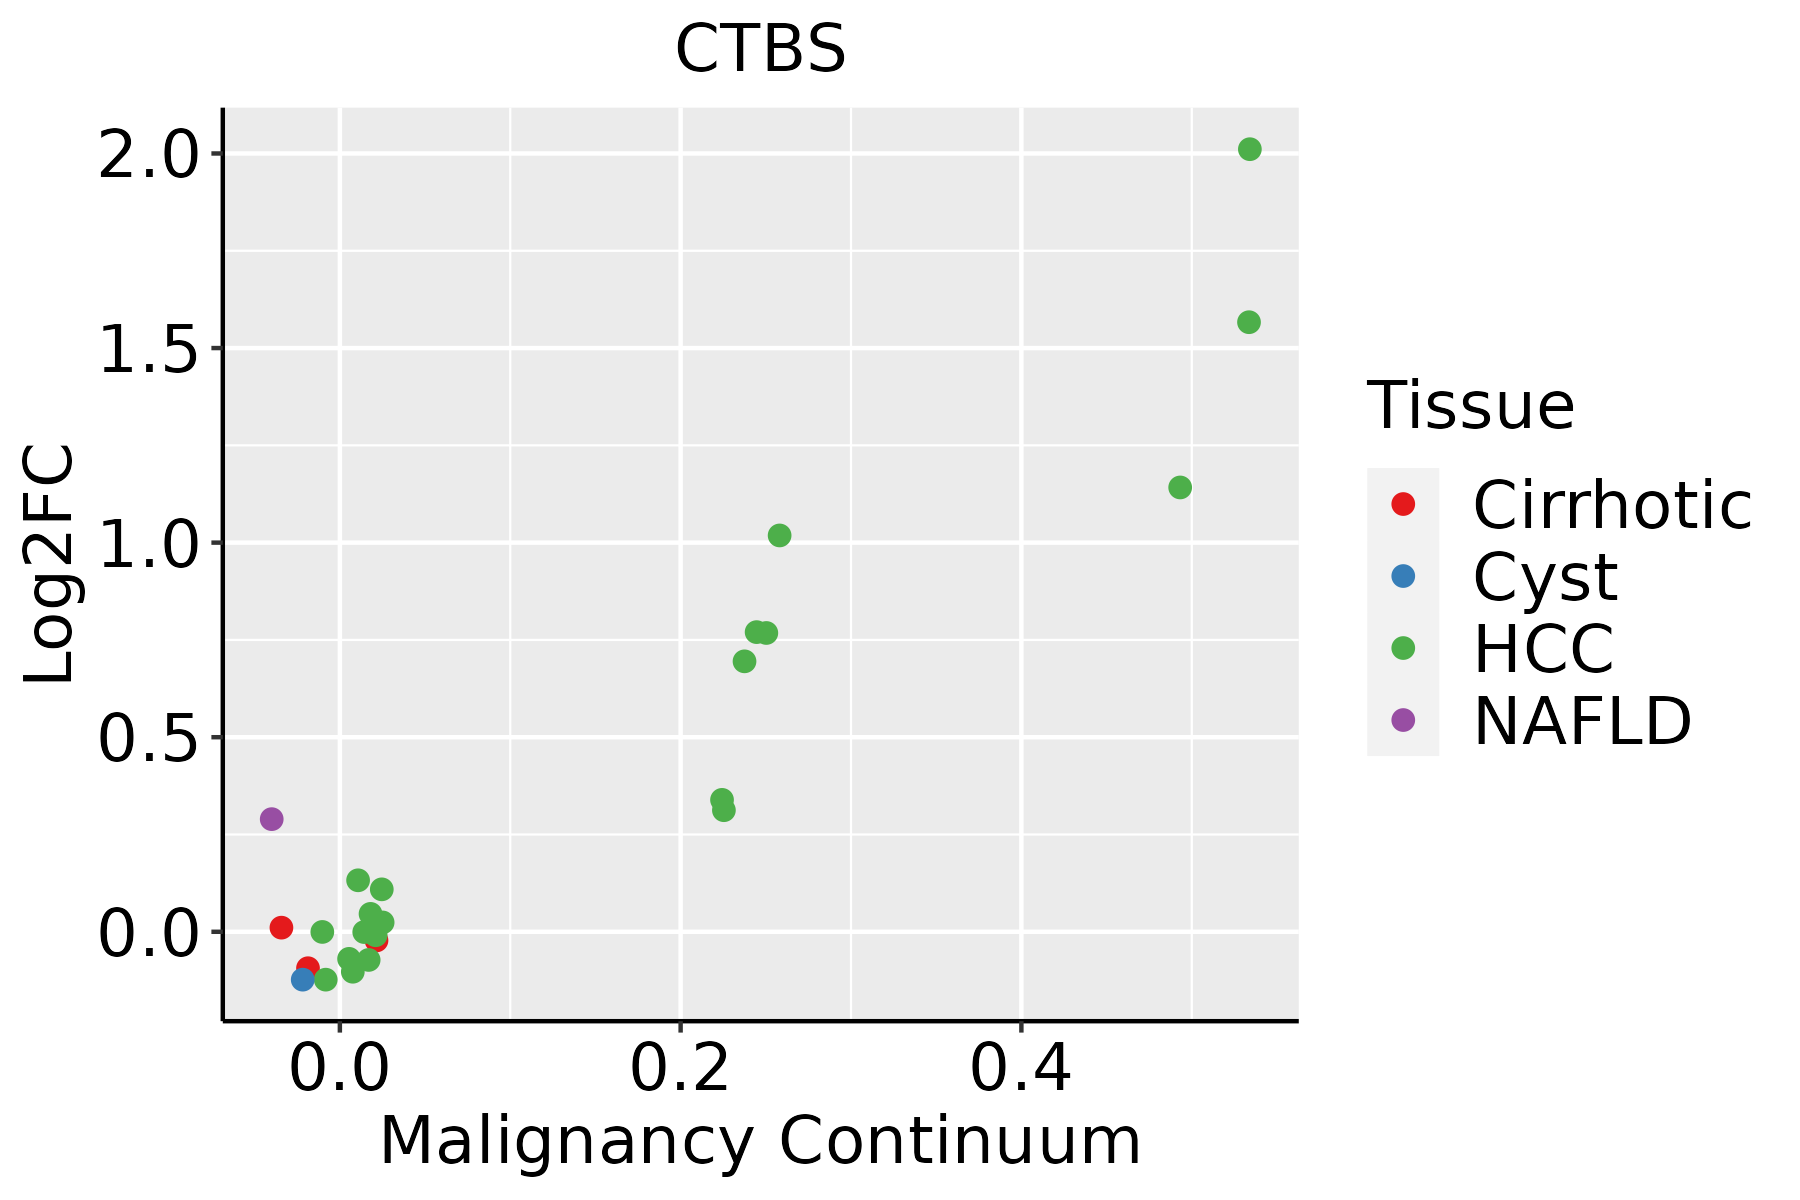 | HCC: Hepatocellular carcinoma |
| NAFLD: Non-alcoholic fatty liver disease | ||
| Oral Cavity |  | EOLP: Erosive Oral lichen planus |
| LP: leukoplakia | ||
| NEOLP: Non-erosive oral lichen planus | ||
| OSCC: Oral squamous cell carcinoma | ||
| Skin |  | AK: Actinic keratosis |
| cSCC: Cutaneous squamous cell carcinoma | ||
| SCCIS:squamous cell carcinoma in situ | ||
| Thyroid |  | ATC: Anaplastic thyroid cancer |
| HT: Hashimoto's thyroiditis | ||
| PTC: Papillary thyroid cancer |
| ∗log2FC in expression of this searched gene in stem-like cells from each diseased tissue sample relative to stem-like cells in normal samples in each tissue plotted against the malignancy continuum. Samples are colored based on if they are from different disease stage. |
Top |
Malignant transformation related pathway analysis |
| Find out the enriched GO biological processes and KEGG pathways involved in transition from healthy to precancer to cancer |
| Tissue | Disease Stage | Enriched GO biological Processes |
| Colorectum | AD |  |
| Colorectum | SER |  |
| Colorectum | MSS |  |
| Colorectum | MSI-H |  |
| Colorectum | FAP |  |
| ∗Top 15 enriched GO BP terms are showed in the bar plot of each disease state in each tissue. Each row represents a significant GO biological process which is colored according to the -log10(p.adjust). |
| Page: 1 2 3 4 5 6 7 8 9 |
| GO ID | Tissue | Disease Stage | Description | Gene Ratio | Bg Ratio | pvalue | p.adjust | Count |
| GO:001605216 | Esophagus | ESCC | carbohydrate catabolic process | 91/8552 | 154/18723 | 5.39e-04 | 2.97e-03 | 91 |
| GO:19011362 | Esophagus | ESCC | carbohydrate derivative catabolic process | 99/8552 | 172/18723 | 1.11e-03 | 5.54e-03 | 99 |
| GO:001605222 | Liver | HCC | carbohydrate catabolic process | 99/7958 | 154/18723 | 3.79e-08 | 8.30e-07 | 99 |
| GO:1901136 | Liver | HCC | carbohydrate derivative catabolic process | 98/7958 | 172/18723 | 8.71e-05 | 7.62e-04 | 98 |
| GO:19011361 | Oral cavity | OSCC | carbohydrate derivative catabolic process | 89/7305 | 172/18723 | 4.52e-04 | 2.73e-03 | 89 |
| GO:001605210 | Oral cavity | OSCC | carbohydrate catabolic process | 76/7305 | 154/18723 | 5.67e-03 | 2.18e-02 | 76 |
| GO:0006040 | Oral cavity | OSCC | amino sugar metabolic process | 24/7305 | 42/18723 | 1.30e-02 | 4.34e-02 | 24 |
| GO:0046348 | Oral cavity | OSCC | amino sugar catabolic process | 10/7305 | 14/18723 | 1.44e-02 | 4.69e-02 | 10 |
| GO:001605218 | Thyroid | PTC | carbohydrate catabolic process | 70/5968 | 154/18723 | 2.77e-04 | 1.97e-03 | 70 |
| GO:001605224 | Thyroid | ATC | carbohydrate catabolic process | 71/6293 | 154/18723 | 8.33e-04 | 4.57e-03 | 71 |
| GO:19011363 | Thyroid | ATC | carbohydrate derivative catabolic process | 73/6293 | 172/18723 | 9.43e-03 | 3.47e-02 | 73 |
| Page: 1 |
| Pathway ID | Tissue | Disease Stage | Description | Gene Ratio | Bg Ratio | pvalue | p.adjust | qvalue | Count |
| Page: 1 |
Top |
Cell-cell communication analysis |
| Identification of potential cell-cell interactions between two cell types and their ligand-receptor pairs for different disease states |
| Ligand | Receptor | LRpair | Pathway | Tissue | Disease Stage |
| Page: 1 |
Top |
Single-cell gene regulatory network inference analysis |
| Find out the significant the regulons (TFs) and the target genes of each regulon across cell types for different disease states |
| TF | Cell Type | Tissue | Disease Stage | Target Gene | RSS | Regulon Activity |
| ∗The dot plots of a searched regulon are shown for all cell subpopulations in each disease state of each tissue based on the regulon specific score inferred using pySCENIC and by calculating the average expression. |
| Page: 1 |
Top |
Somatic mutation of malignant transformation related genes |
| Annotation of somatic variants for genes involved in malignant transformation |
| Hugo Symbol | Variant Class | Variant Classification | dbSNP RS | HGVSc | HGVSp | HGVSp Short | SWISSPROT | BIOTYPE | SIFT | PolyPhen | Tumor Sample Barcode | Tissue | Histology | Sex | Age | Stage | Therapy Types | Drugs | Outcome |
| CTBS | SNV | Missense_Mutation | novel | c.1139C>A | p.Pro380Gln | p.P380Q | Q01459 | protein_coding | deleterious(0.01) | benign(0.36) | TCGA-A2-A25A-01 | Breast | breast invasive carcinoma | Female | <65 | I/II | Unspecific | Cytoxan | SD |
| CTBS | SNV | Missense_Mutation | novel | c.743N>C | p.Val248Ala | p.V248A | Q01459 | protein_coding | deleterious(0) | probably_damaging(0.989) | TCGA-AA-3492-01 | Colorectum | colon adenocarcinoma | Female | >=65 | I/II | Unknown | Unknown | SD |
| CTBS | SNV | Missense_Mutation | rs780281748 | c.1040G>A | p.Arg347His | p.R347H | Q01459 | protein_coding | deleterious(0.05) | benign(0.127) | TCGA-AA-3710-01 | Colorectum | colon adenocarcinoma | Female | >=65 | I/II | Unknown | Unknown | SD |
| CTBS | SNV | Missense_Mutation | novel | c.215N>T | p.Ser72Phe | p.S72F | Q01459 | protein_coding | tolerated(0.71) | benign(0.001) | TCGA-AA-3984-01 | Colorectum | colon adenocarcinoma | Female | <65 | I/II | Unknown | Unknown | SD |
| CTBS | SNV | Missense_Mutation | rs780281748 | c.1040N>A | p.Arg347His | p.R347H | Q01459 | protein_coding | deleterious(0.05) | benign(0.127) | TCGA-AD-6895-01 | Colorectum | colon adenocarcinoma | Male | >=65 | III/IV | Unknown | Unknown | SD |
| CTBS | SNV | Missense_Mutation | novel | c.601N>C | p.Cys201Arg | p.C201R | Q01459 | protein_coding | deleterious(0) | possibly_damaging(0.895) | TCGA-AZ-4616-01 | Colorectum | colon adenocarcinoma | Female | >=65 | III/IV | Chemotherapy | xeloda | PD |
| CTBS | SNV | Missense_Mutation | novel | c.435N>C | p.Glu145Asp | p.E145D | Q01459 | protein_coding | tolerated(0.4) | benign(0.009) | TCGA-CA-6717-01 | Colorectum | colon adenocarcinoma | Male | <65 | I/II | Chemotherapy | oxaliplatin | CR |
| CTBS | SNV | Missense_Mutation | novel | c.706G>T | p.Asp236Tyr | p.D236Y | Q01459 | protein_coding | deleterious(0) | possibly_damaging(0.744) | TCGA-F5-6814-01 | Colorectum | rectum adenocarcinoma | Male | <65 | I/II | Unknown | Unknown | SD |
| CTBS | insertion | Frame_Shift_Ins | novel | c.1005_1006insCCCAC | p.Ile336ProfsTer5 | p.I336Pfs*5 | Q01459 | protein_coding | TCGA-AM-5820-01 | Colorectum | colon adenocarcinoma | Female | <65 | I/II | Unknown | Unknown | SD | ||
| CTBS | SNV | Missense_Mutation | rs374699739 | c.283N>A | p.Ala95Thr | p.A95T | Q01459 | protein_coding | deleterious(0) | probably_damaging(0.999) | TCGA-A5-A0G1-01 | Endometrium | uterine corpus endometrioid carcinoma | Female | >=65 | I/II | Unknown | Unknown | SD |
| Page: 1 2 3 4 |
Top |
Related drugs of malignant transformation related genes |
| Identification of chemicals and drugs interact with genes involved in malignant transfromation |
| (DGIdb 4.0) |
| Entrez ID | Symbol | Category | Interaction Types | Drug Claim Name | Drug Name | PMIDs |
| Page: 1 |

Copyright 2023-Present -The University of Texas Health Science Center at Houston |