
|
|||||
|
 | |
| |
| |
| |
| |
| |
|
Gene: CTBP2 |
Gene summary for CTBP2 |
| Gene information | Species | Human | Gene symbol | CTBP2 | Gene ID | 1488 |
| Gene name | C-terminal binding protein 2 | |
| Gene Alias | CTBP2 | |
| Cytomap | 10q26.13 | |
| Gene Type | protein-coding | GO ID | GO:0000122 | UniProtAcc | P56545 |
Top |
Malignant transformation analysis |
| Identification of the aberrant gene expression in precancerous and cancerous lesions by comparing the gene expression of stem-like cells in diseased tissues with normal stem cells |
| Entrez ID | Symbol | Replicates | Species | Organ | Tissue | Adj P-value | Log2FC | Malignancy |
| 1488 | CTBP2 | GSM4909281 | Human | Breast | IDC | 7.16e-03 | 2.73e-01 | 0.21 |
| 1488 | CTBP2 | GSM4909286 | Human | Breast | IDC | 1.81e-06 | 2.02e-01 | 0.1081 |
| 1488 | CTBP2 | GSM4909292 | Human | Breast | IDC | 3.06e-04 | 5.82e-01 | 0.1236 |
| 1488 | CTBP2 | GSM4909293 | Human | Breast | IDC | 4.22e-16 | 3.77e-01 | 0.1581 |
| 1488 | CTBP2 | GSM4909297 | Human | Breast | IDC | 3.78e-03 | -4.30e-02 | 0.1517 |
| 1488 | CTBP2 | GSM4909311 | Human | Breast | IDC | 1.08e-13 | -9.96e-02 | 0.1534 |
| 1488 | CTBP2 | GSM4909312 | Human | Breast | IDC | 1.92e-03 | 1.10e-01 | 0.1552 |
| 1488 | CTBP2 | GSM4909319 | Human | Breast | IDC | 1.84e-16 | -2.26e-01 | 0.1563 |
| 1488 | CTBP2 | GSM4909320 | Human | Breast | IDC | 2.85e-03 | -1.59e-01 | 0.1575 |
| 1488 | CTBP2 | GSM4909321 | Human | Breast | IDC | 1.97e-06 | -4.44e-02 | 0.1559 |
| 1488 | CTBP2 | M2 | Human | Breast | IDC | 1.71e-05 | 5.16e-01 | 0.21 |
| 1488 | CTBP2 | M5 | Human | Breast | IDC | 2.71e-02 | 5.48e-01 | 0.1598 |
| 1488 | CTBP2 | NCCBC14 | Human | Breast | DCIS | 3.03e-08 | 2.18e-01 | 0.2021 |
| 1488 | CTBP2 | NCCBC2 | Human | Breast | DCIS | 3.76e-05 | 3.05e-01 | 0.1554 |
| 1488 | CTBP2 | NCCBC5 | Human | Breast | DCIS | 7.25e-05 | -9.37e-02 | 0.2046 |
| 1488 | CTBP2 | P1 | Human | Breast | IDC | 6.03e-09 | -1.64e-01 | 0.1527 |
| 1488 | CTBP2 | DCIS2 | Human | Breast | DCIS | 1.96e-60 | 5.15e-01 | 0.0085 |
| 1488 | CTBP2 | CCI_1 | Human | Cervix | CC | 9.50e-11 | 1.65e+00 | 0.528 |
| 1488 | CTBP2 | CCI_2 | Human | Cervix | CC | 1.39e-12 | 1.54e+00 | 0.5249 |
| 1488 | CTBP2 | CCI_3 | Human | Cervix | CC | 6.84e-20 | 1.43e+00 | 0.516 |
| Page: 1 2 3 4 5 6 7 8 9 10 11 |
| Tissue | Expression Dynamics | Abbreviation |
| Breast | 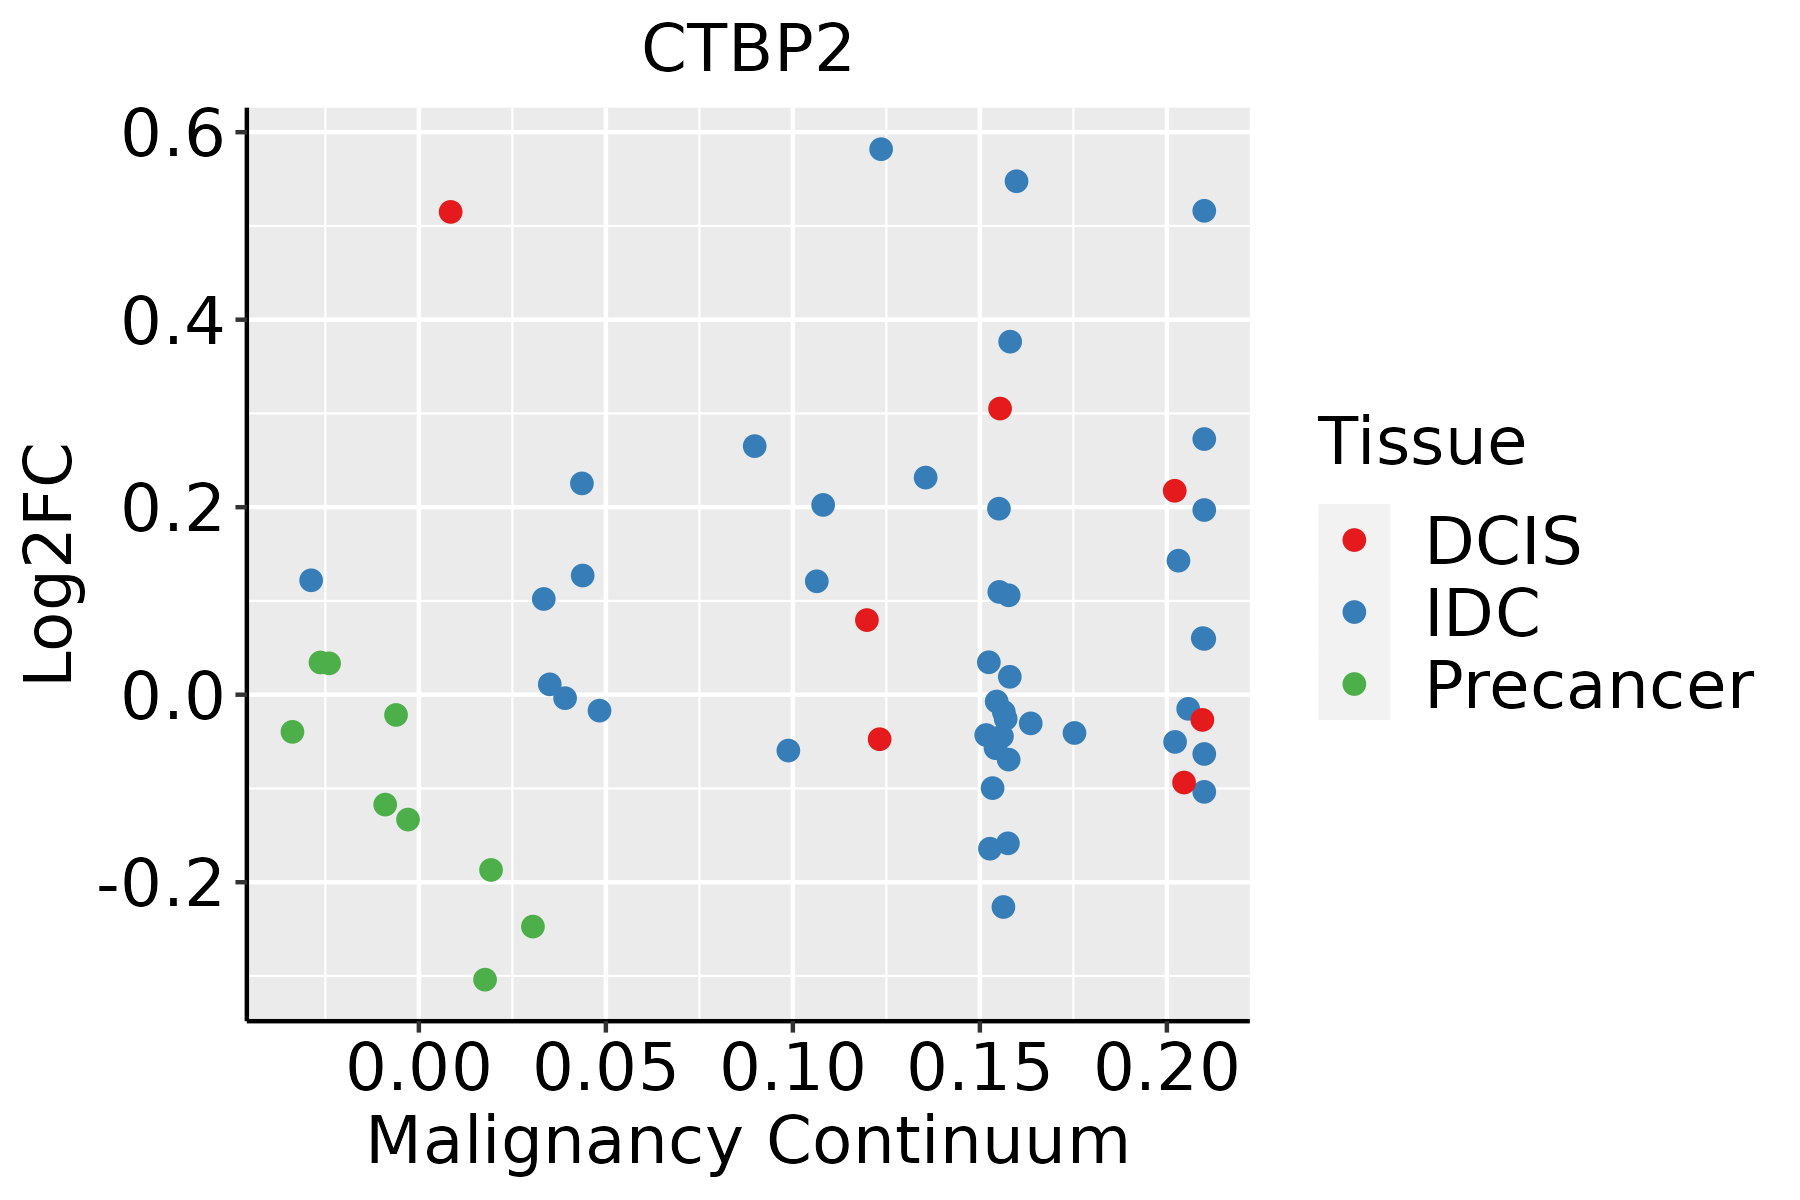 | IDC: Invasive ductal carcinoma |
| DCIS: Ductal carcinoma in situ | ||
| Precancer(BRCA1-mut): Precancerous lesion from BRCA1 mutation carriers | ||
| Cervix |  | CC: Cervix cancer |
| HSIL_HPV: HPV-infected high-grade squamous intraepithelial lesions | ||
| N_HPV: HPV-infected normal cervix | ||
| Colorectum (GSE201348) |  | FAP: Familial adenomatous polyposis |
| CRC: Colorectal cancer | ||
| Colorectum (HTA11) | 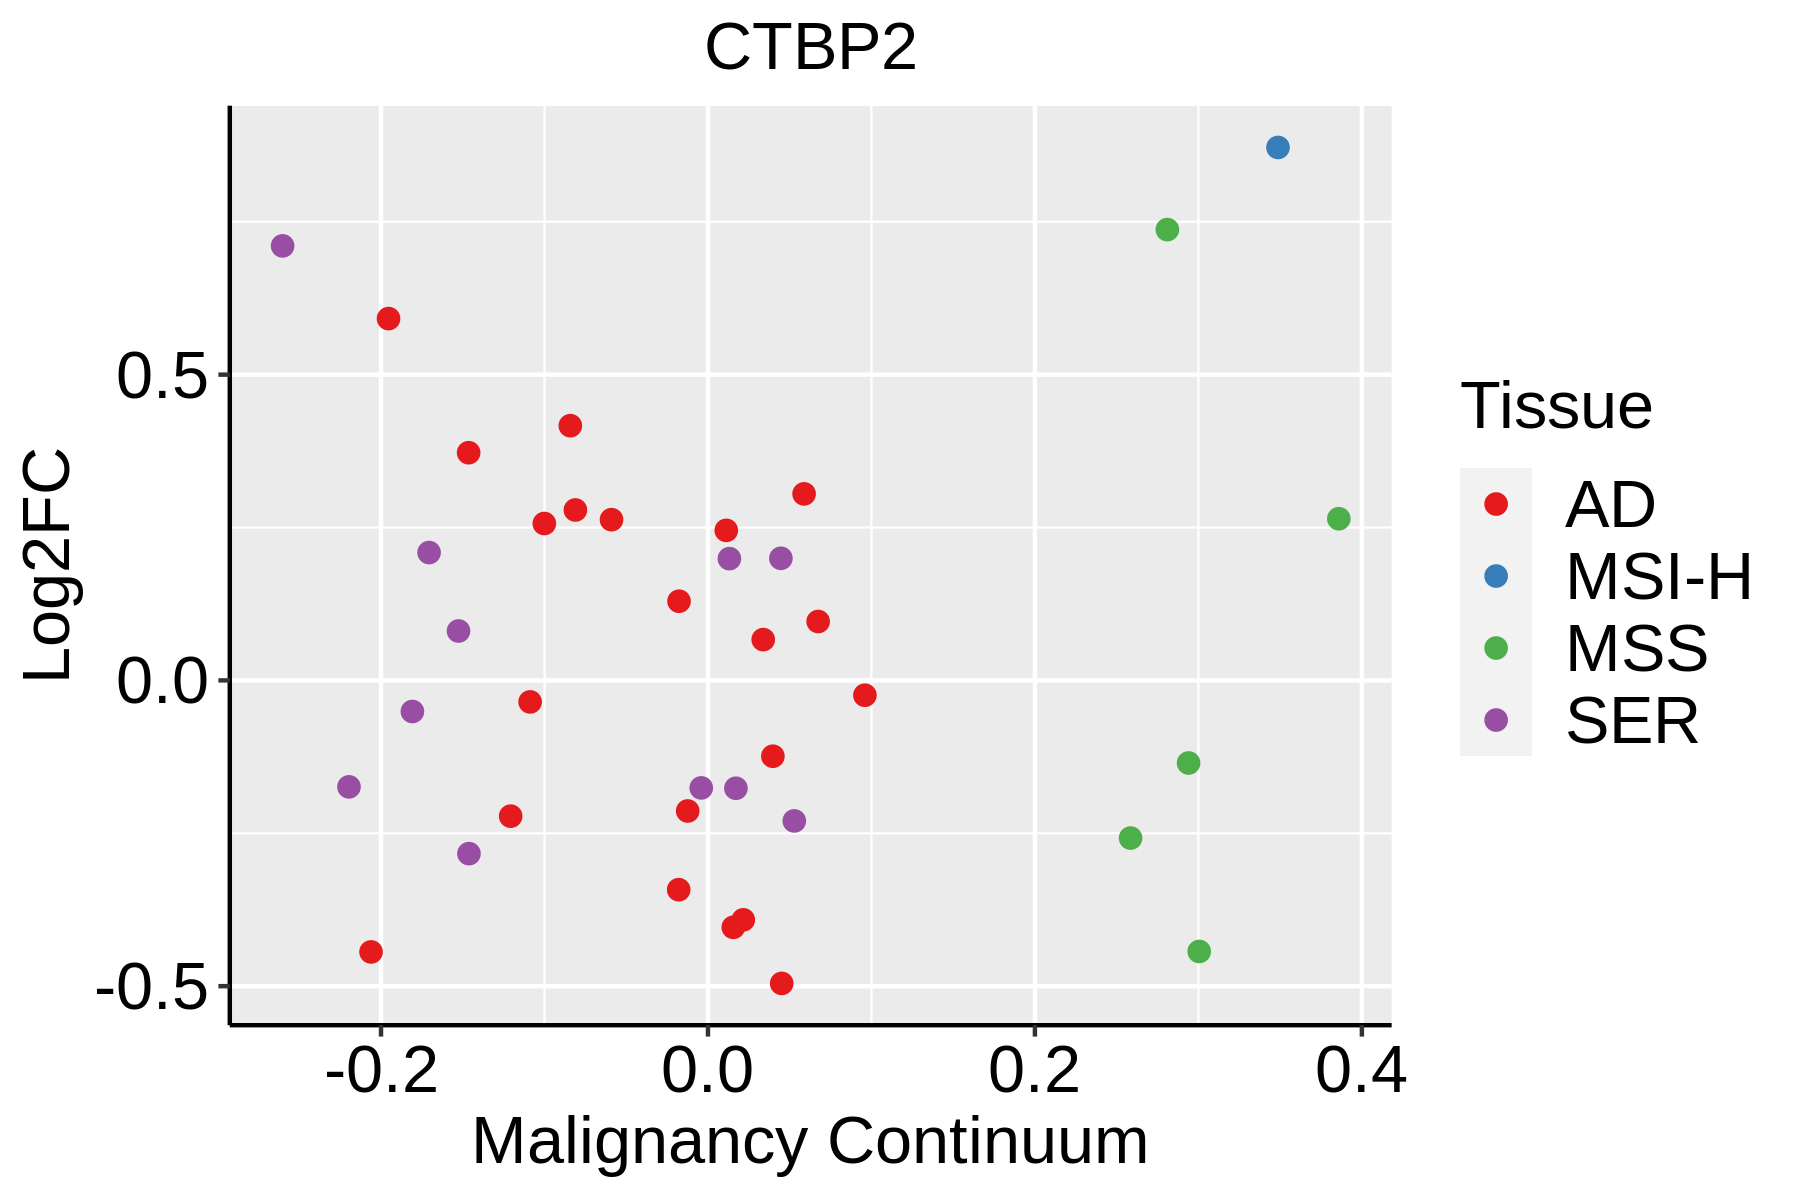 | AD: Adenomas |
| SER: Sessile serrated lesions | ||
| MSI-H: Microsatellite-high colorectal cancer | ||
| MSS: Microsatellite stable colorectal cancer | ||
| Endometrium | 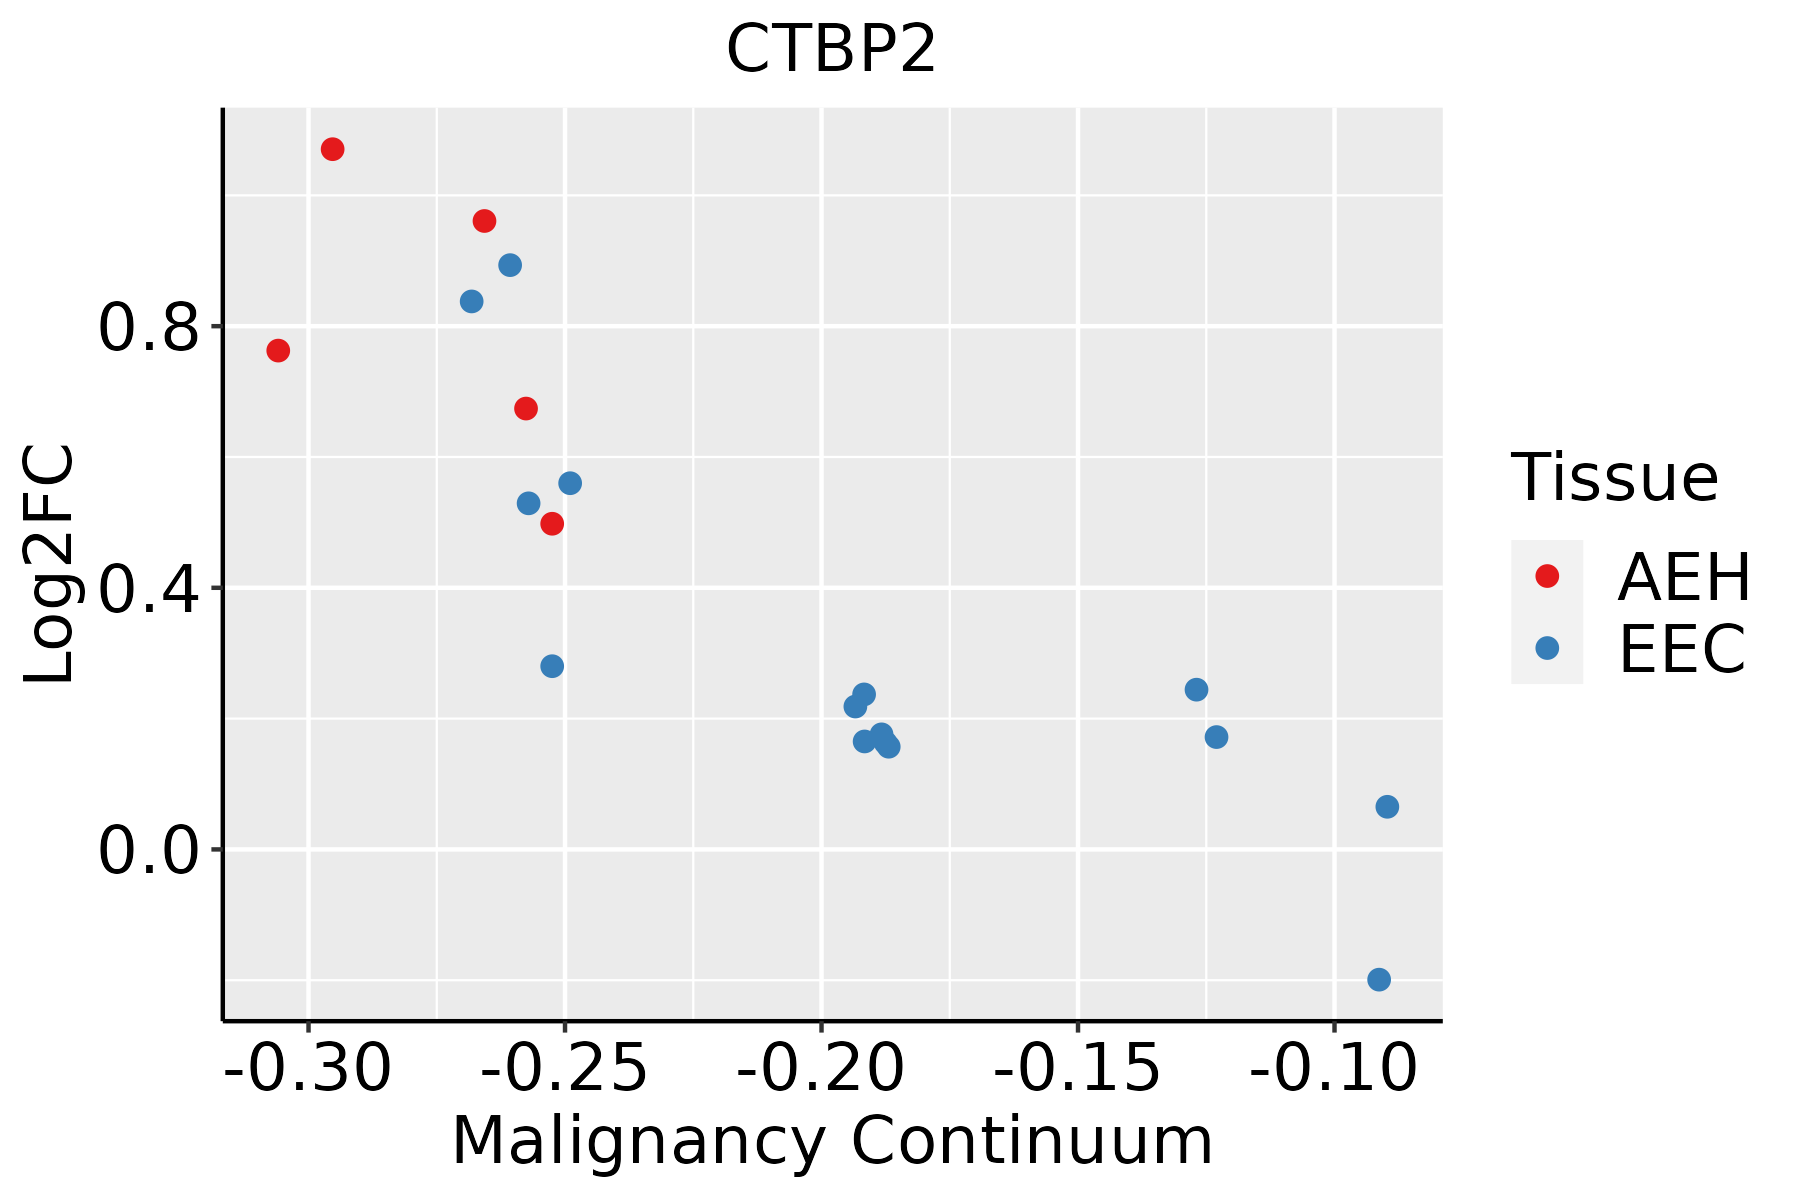 | AEH: Atypical endometrial hyperplasia |
| EEC: Endometrioid Cancer | ||
| Esophagus | 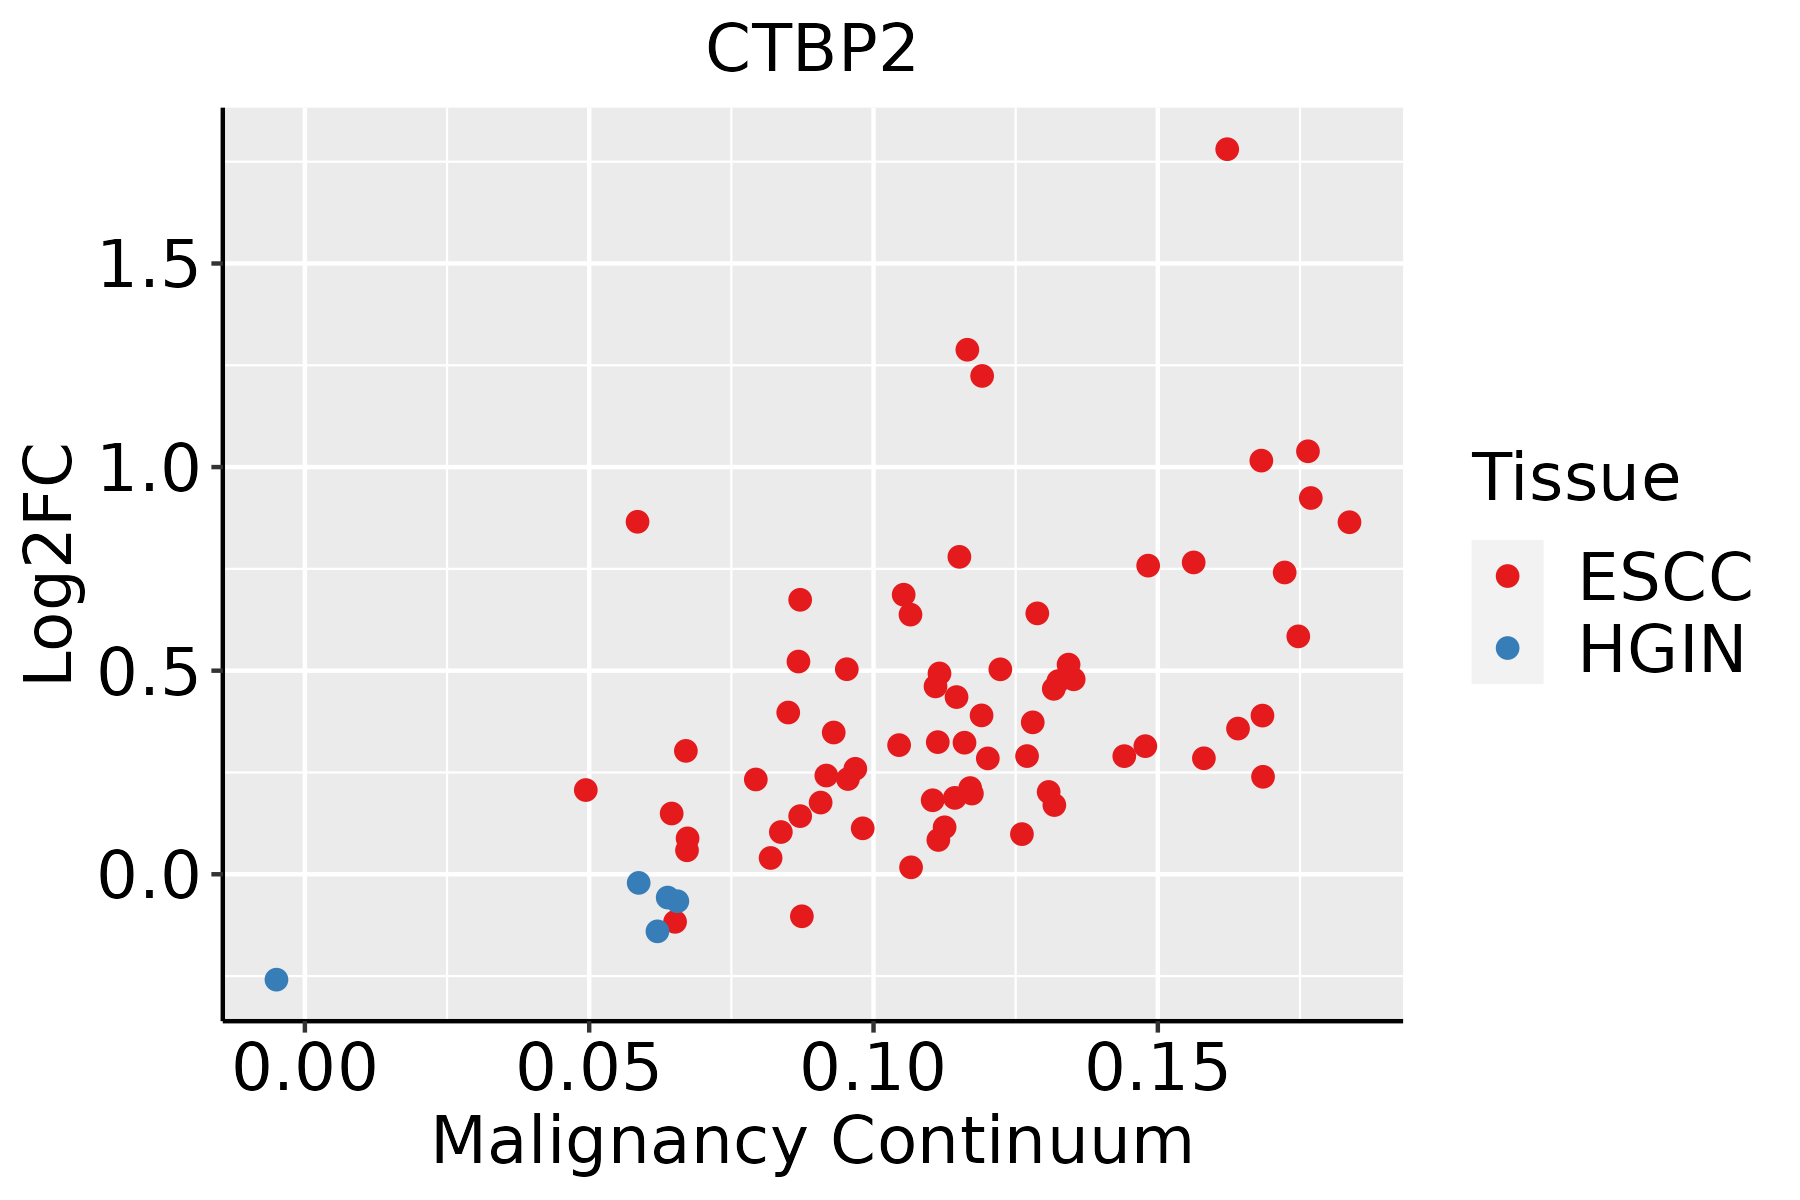 | ESCC: Esophageal squamous cell carcinoma |
| HGIN: High-grade intraepithelial neoplasias | ||
| LGIN: Low-grade intraepithelial neoplasias | ||
| Liver | 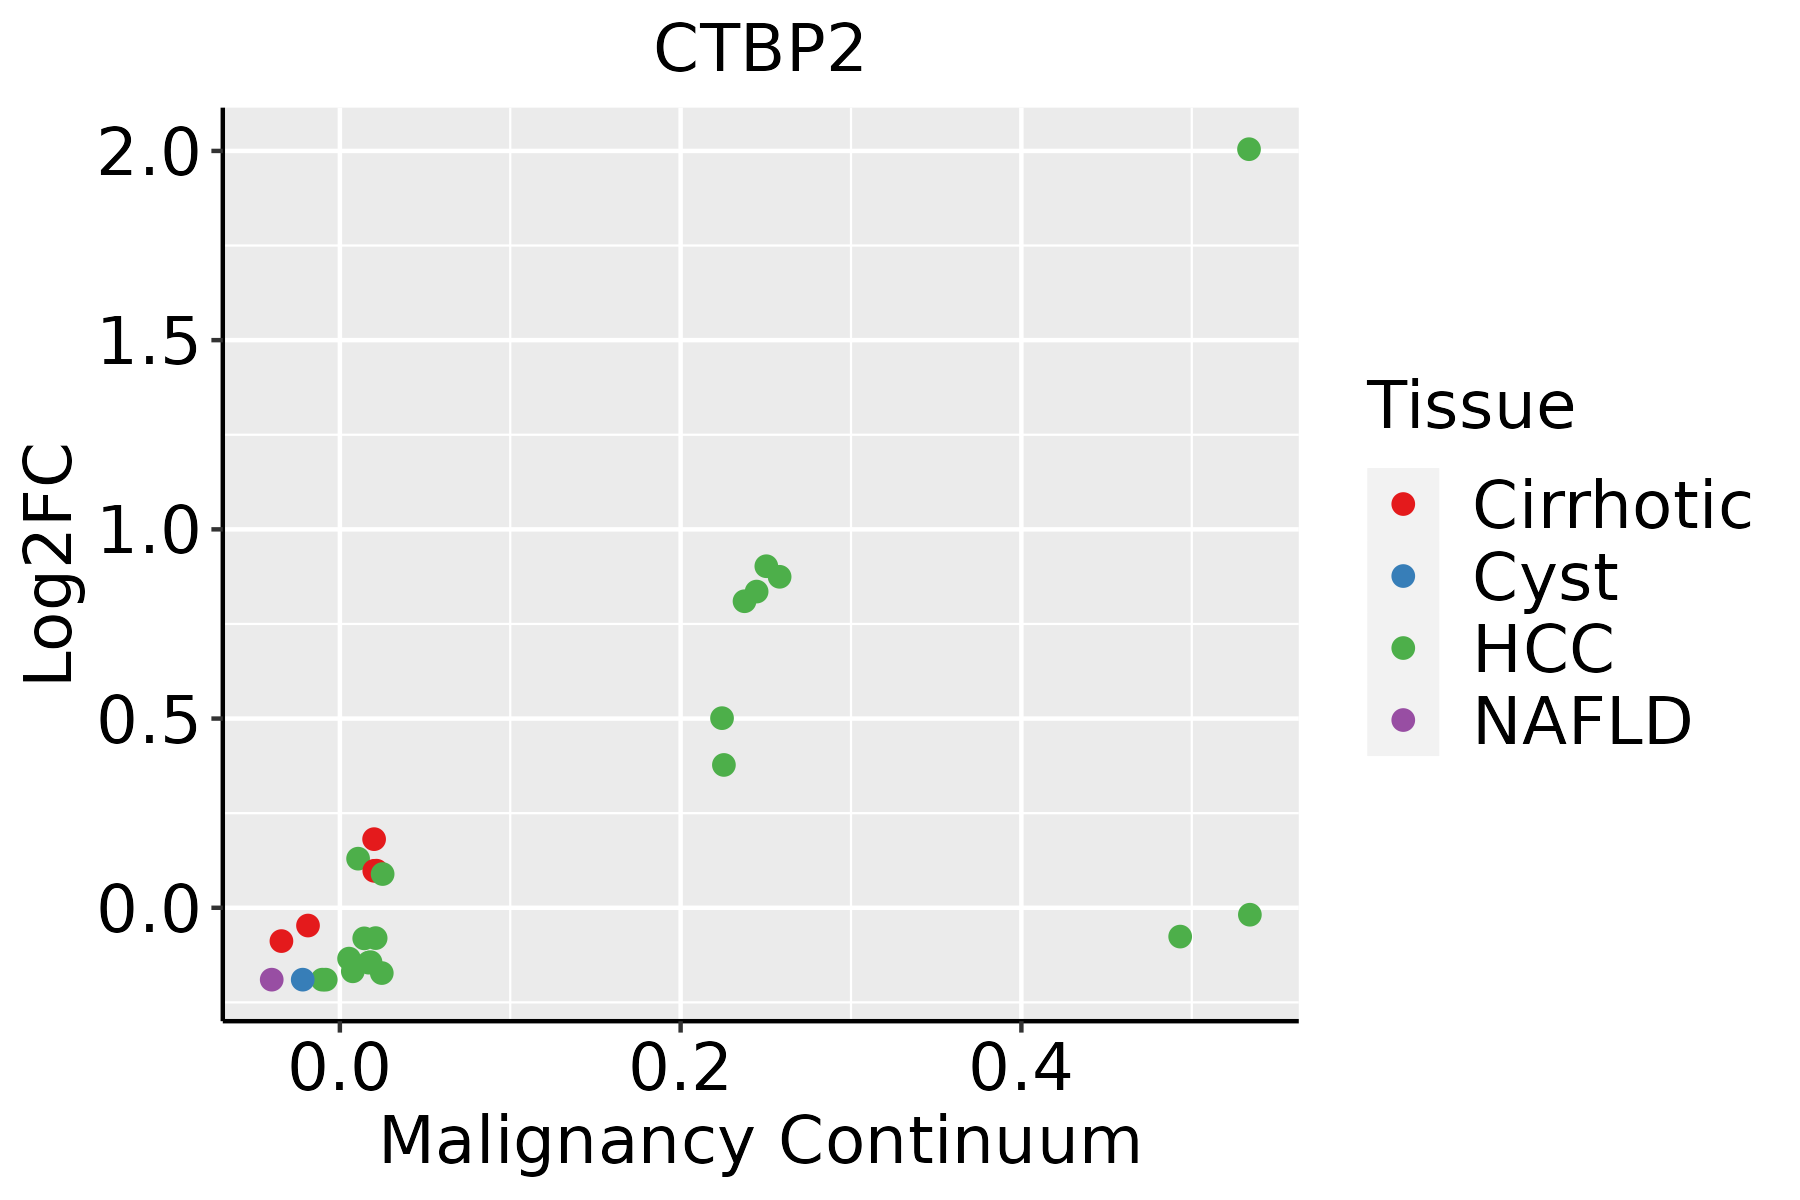 | HCC: Hepatocellular carcinoma |
| NAFLD: Non-alcoholic fatty liver disease | ||
| Lung | 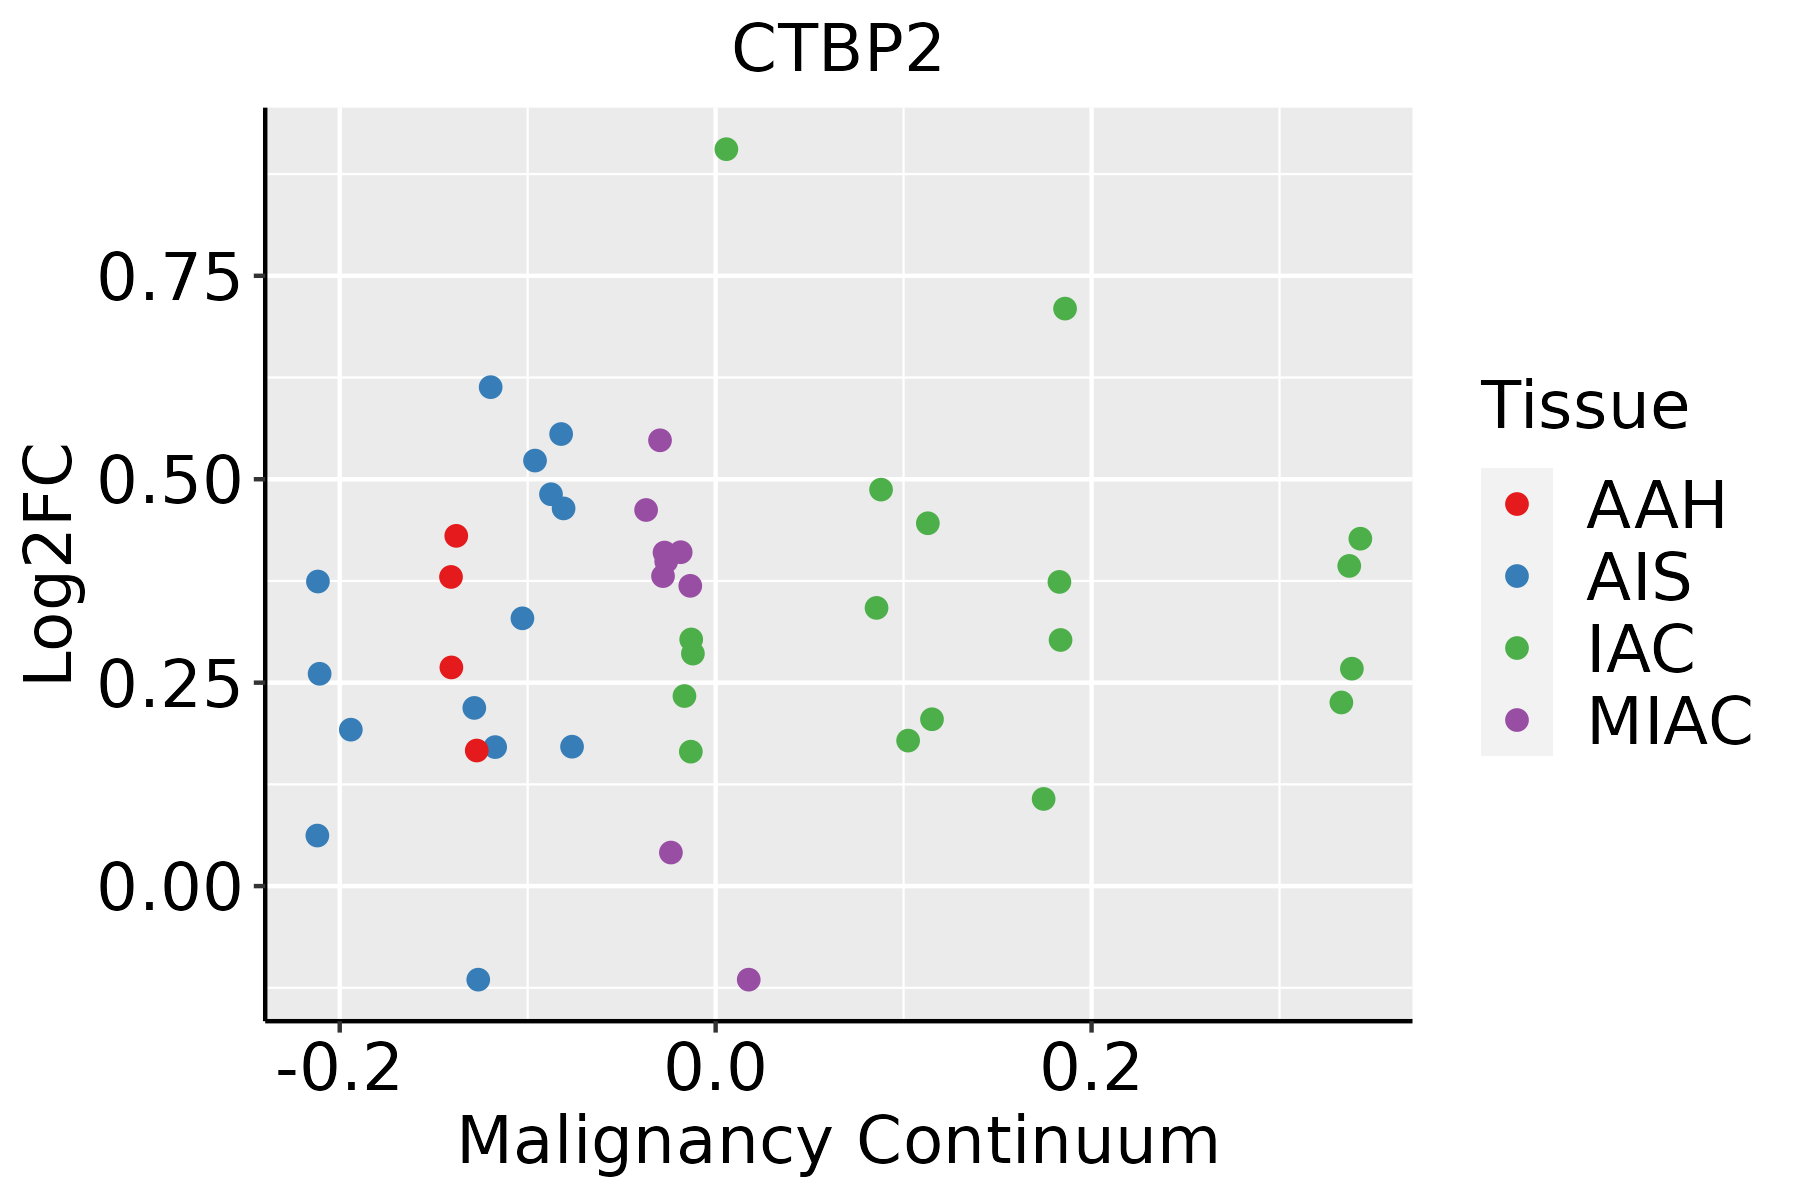 | AAH: Atypical adenomatous hyperplasia |
| AIS: Adenocarcinoma in situ | ||
| IAC: Invasive lung adenocarcinoma | ||
| MIA: Minimally invasive adenocarcinoma | ||
| Oral Cavity | 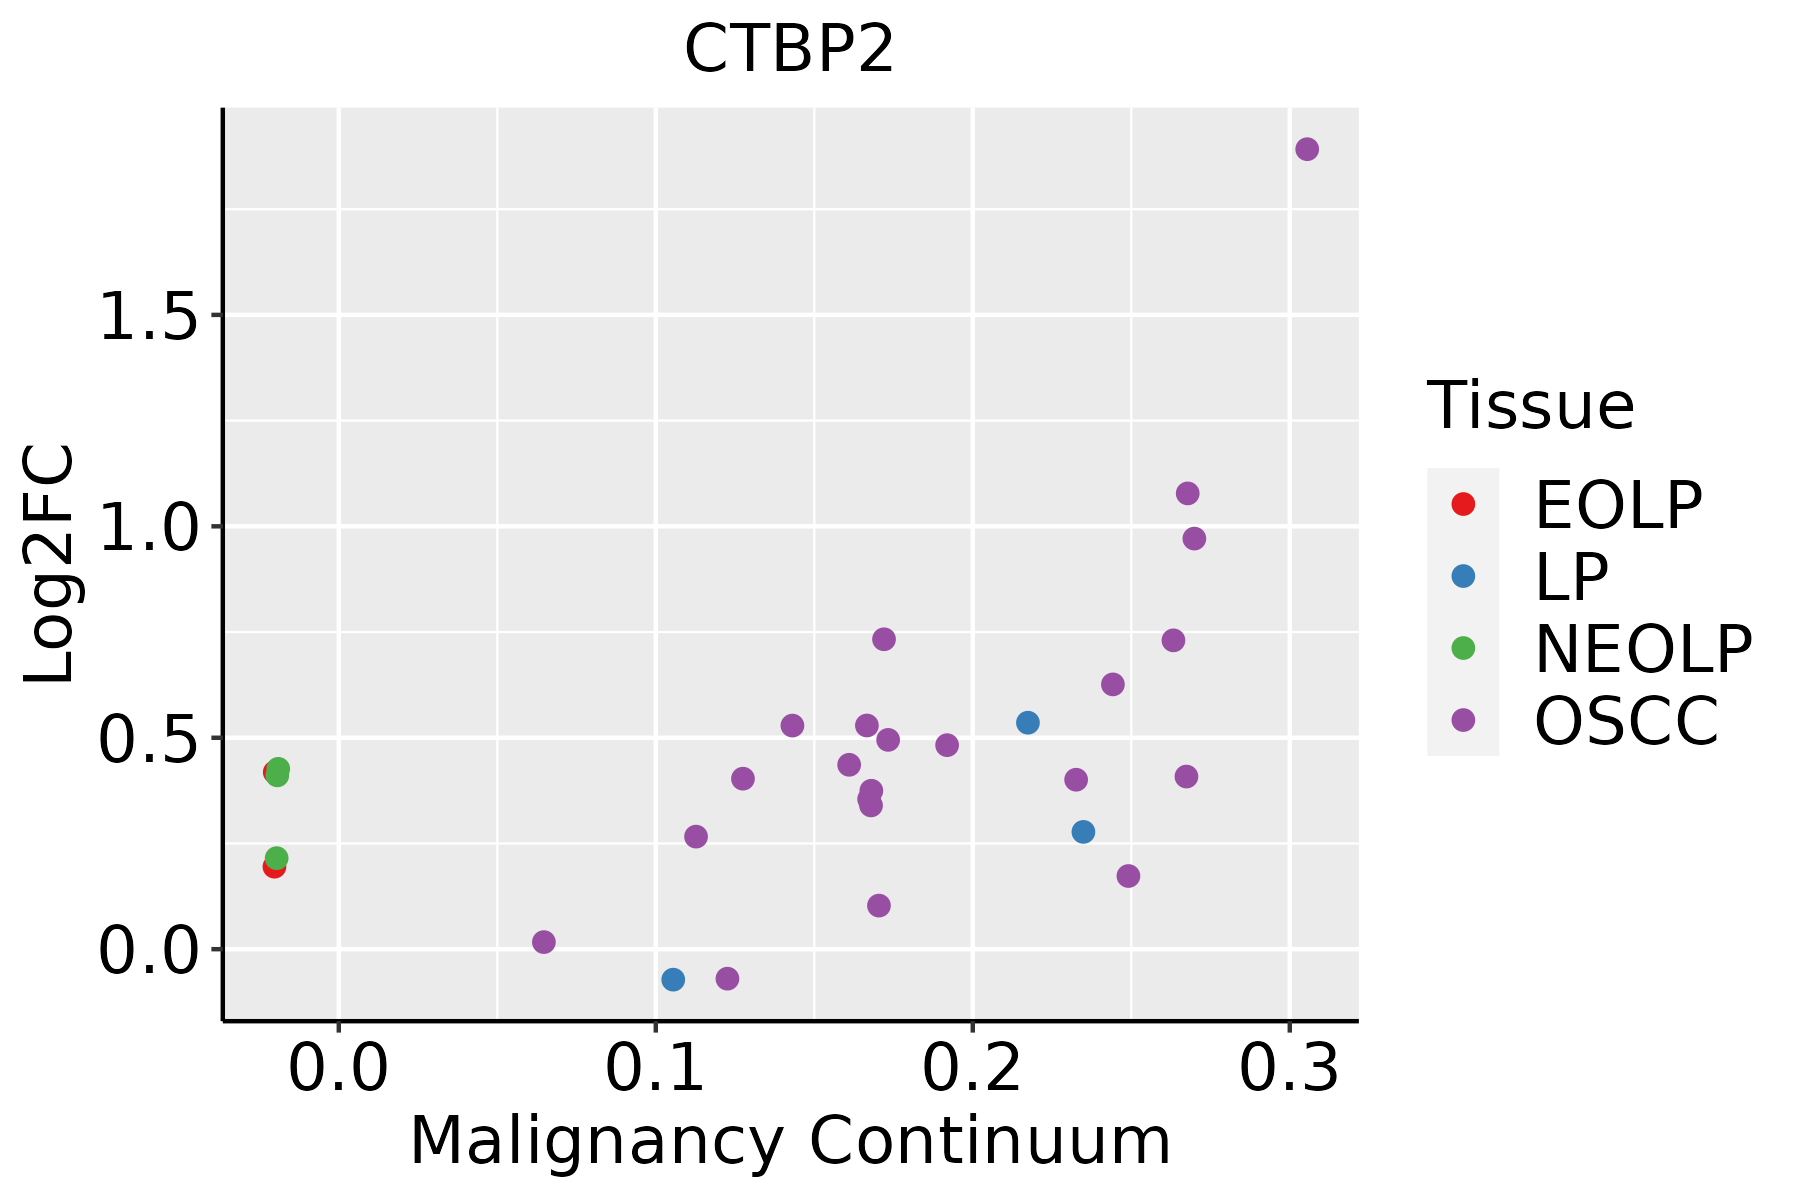 | EOLP: Erosive Oral lichen planus |
| LP: leukoplakia | ||
| NEOLP: Non-erosive oral lichen planus | ||
| OSCC: Oral squamous cell carcinoma | ||
| Prostate |  | BPH: Benign Prostatic Hyperplasia |
| Skin | 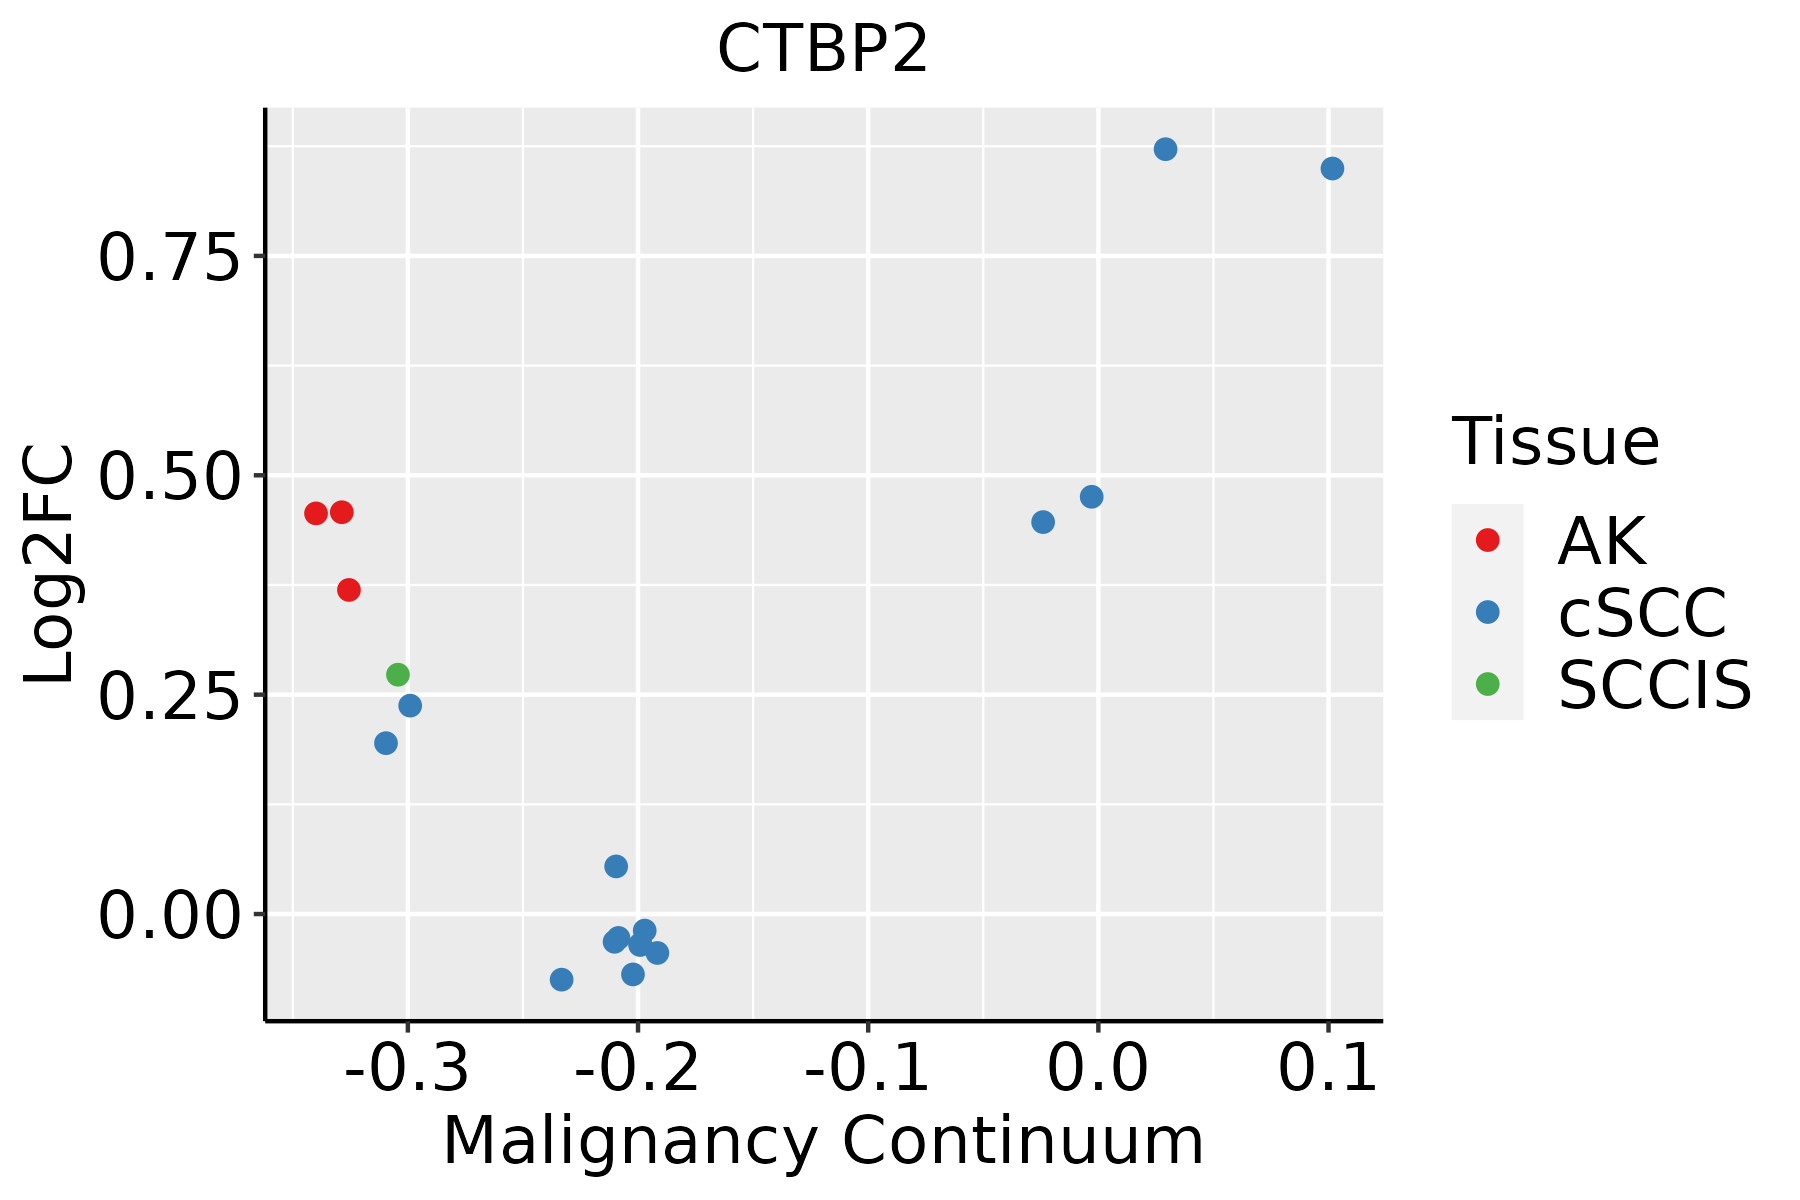 | AK: Actinic keratosis |
| cSCC: Cutaneous squamous cell carcinoma | ||
| SCCIS:squamous cell carcinoma in situ | ||
| Thyroid | 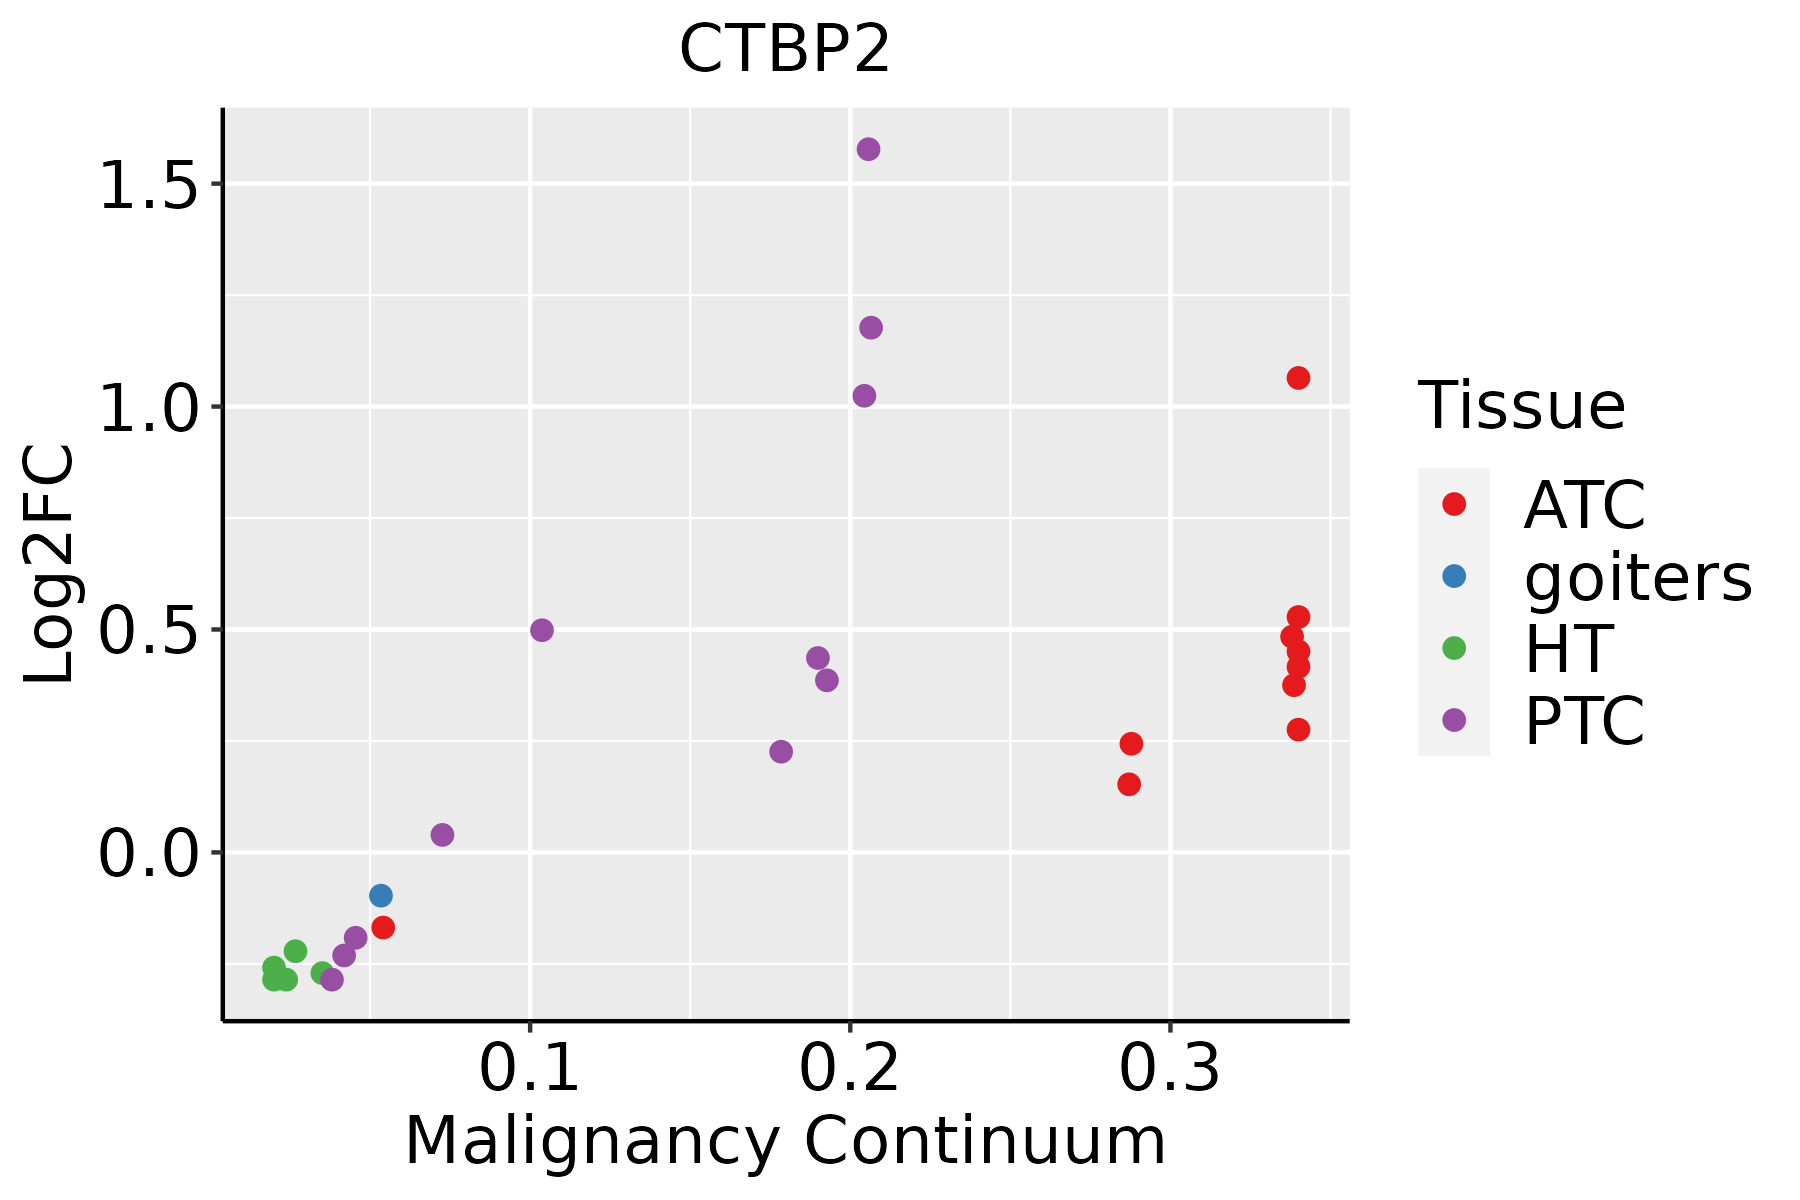 | ATC: Anaplastic thyroid cancer |
| HT: Hashimoto's thyroiditis | ||
| PTC: Papillary thyroid cancer |
| ∗log2FC in expression of this searched gene in stem-like cells from each diseased tissue sample relative to stem-like cells in normal samples in each tissue plotted against the malignancy continuum. Samples are colored based on if they are from different disease stage. |
Top |
Malignant transformation related pathway analysis |
| Find out the enriched GO biological processes and KEGG pathways involved in transition from healthy to precancer to cancer |
| Tissue | Disease Stage | Enriched GO biological Processes |
| Colorectum | AD |  |
| Colorectum | SER |  |
| Colorectum | MSS |  |
| Colorectum | MSI-H |  |
| Colorectum | FAP |  |
| ∗Top 15 enriched GO BP terms are showed in the bar plot of each disease state in each tissue. Each row represents a significant GO biological process which is colored according to the -log10(p.adjust). |
| Page: 1 2 3 4 5 6 7 8 9 |
| GO ID | Tissue | Disease Stage | Description | Gene Ratio | Bg Ratio | pvalue | p.adjust | Count |
| GO:001603214 | Breast | IDC | viral process | 75/1434 | 415/18723 | 1.98e-12 | 4.02e-10 | 75 |
| GO:001905814 | Breast | IDC | viral life cycle | 61/1434 | 317/18723 | 1.61e-11 | 2.77e-09 | 61 |
| GO:001907914 | Breast | IDC | viral genome replication | 32/1434 | 131/18723 | 2.82e-09 | 2.46e-07 | 32 |
| GO:005109814 | Breast | IDC | regulation of binding | 57/1434 | 363/18723 | 1.59e-07 | 8.76e-06 | 57 |
| GO:005109914 | Breast | IDC | positive regulation of binding | 30/1434 | 173/18723 | 1.96e-05 | 4.86e-04 | 30 |
| GO:003052214 | Breast | IDC | intracellular receptor signaling pathway | 37/1434 | 265/18723 | 2.77e-04 | 4.26e-03 | 37 |
| GO:004544412 | Breast | IDC | fat cell differentiation | 30/1434 | 229/18723 | 2.72e-03 | 2.41e-02 | 30 |
| GO:19908301 | Breast | IDC | cellular response to leukemia inhibitory factor | 15/1434 | 94/18723 | 5.06e-03 | 3.79e-02 | 15 |
| GO:199082311 | Breast | IDC | response to leukemia inhibitory factor | 15/1434 | 95/18723 | 5.59e-03 | 4.07e-02 | 15 |
| GO:001603224 | Breast | DCIS | viral process | 73/1390 | 415/18723 | 3.40e-12 | 6.88e-10 | 73 |
| GO:001905824 | Breast | DCIS | viral life cycle | 59/1390 | 317/18723 | 4.05e-11 | 5.74e-09 | 59 |
| GO:001907923 | Breast | DCIS | viral genome replication | 30/1390 | 131/18723 | 2.12e-08 | 1.45e-06 | 30 |
| GO:005109823 | Breast | DCIS | regulation of binding | 55/1390 | 363/18723 | 3.14e-07 | 1.48e-05 | 55 |
| GO:005109923 | Breast | DCIS | positive regulation of binding | 28/1390 | 173/18723 | 7.50e-05 | 1.47e-03 | 28 |
| GO:003052224 | Breast | DCIS | intracellular receptor signaling pathway | 35/1390 | 265/18723 | 6.38e-04 | 7.92e-03 | 35 |
| GO:004544421 | Breast | DCIS | fat cell differentiation | 30/1390 | 229/18723 | 1.70e-03 | 1.68e-02 | 30 |
| GO:19908302 | Breast | DCIS | cellular response to leukemia inhibitory factor | 15/1390 | 94/18723 | 3.79e-03 | 3.03e-02 | 15 |
| GO:19908232 | Breast | DCIS | response to leukemia inhibitory factor | 15/1390 | 95/18723 | 4.20e-03 | 3.31e-02 | 15 |
| GO:001603210 | Cervix | CC | viral process | 109/2311 | 415/18723 | 5.40e-15 | 6.46e-12 | 109 |
| GO:001905810 | Cervix | CC | viral life cycle | 87/2311 | 317/18723 | 2.20e-13 | 1.20e-10 | 87 |
| Page: 1 2 3 4 5 6 7 8 9 10 11 12 13 14 15 16 |
| Pathway ID | Tissue | Disease Stage | Description | Gene Ratio | Bg Ratio | pvalue | p.adjust | qvalue | Count |
| hsa0522010 | Breast | IDC | Chronic myeloid leukemia | 15/867 | 76/8465 | 9.24e-03 | 4.37e-02 | 3.27e-02 | 15 |
| hsa0522013 | Breast | IDC | Chronic myeloid leukemia | 15/867 | 76/8465 | 9.24e-03 | 4.37e-02 | 3.27e-02 | 15 |
| hsa0522023 | Breast | DCIS | Chronic myeloid leukemia | 15/846 | 76/8465 | 7.42e-03 | 3.48e-02 | 2.56e-02 | 15 |
| hsa0522033 | Breast | DCIS | Chronic myeloid leukemia | 15/846 | 76/8465 | 7.42e-03 | 3.48e-02 | 2.56e-02 | 15 |
| hsa043109 | Cervix | CC | Wnt signaling pathway | 43/1267 | 171/8465 | 3.03e-04 | 1.64e-03 | 9.68e-04 | 43 |
| hsa0522014 | Cervix | CC | Chronic myeloid leukemia | 21/1267 | 76/8465 | 3.08e-03 | 1.19e-02 | 7.03e-03 | 21 |
| hsa04330 | Cervix | CC | Notch signaling pathway | 17/1267 | 62/8465 | 7.99e-03 | 2.56e-02 | 1.51e-02 | 17 |
| hsa0431012 | Cervix | CC | Wnt signaling pathway | 43/1267 | 171/8465 | 3.03e-04 | 1.64e-03 | 9.68e-04 | 43 |
| hsa0522015 | Cervix | CC | Chronic myeloid leukemia | 21/1267 | 76/8465 | 3.08e-03 | 1.19e-02 | 7.03e-03 | 21 |
| hsa043301 | Cervix | CC | Notch signaling pathway | 17/1267 | 62/8465 | 7.99e-03 | 2.56e-02 | 1.51e-02 | 17 |
| hsa05220 | Colorectum | AD | Chronic myeloid leukemia | 31/2092 | 76/8465 | 1.41e-03 | 8.46e-03 | 5.39e-03 | 31 |
| hsa04310 | Colorectum | AD | Wnt signaling pathway | 56/2092 | 171/8465 | 1.03e-02 | 3.93e-02 | 2.51e-02 | 56 |
| hsa052201 | Colorectum | AD | Chronic myeloid leukemia | 31/2092 | 76/8465 | 1.41e-03 | 8.46e-03 | 5.39e-03 | 31 |
| hsa043101 | Colorectum | AD | Wnt signaling pathway | 56/2092 | 171/8465 | 1.03e-02 | 3.93e-02 | 2.51e-02 | 56 |
| hsa052202 | Colorectum | MSS | Chronic myeloid leukemia | 29/1875 | 76/8465 | 1.10e-03 | 6.27e-03 | 3.84e-03 | 29 |
| hsa043102 | Colorectum | MSS | Wnt signaling pathway | 53/1875 | 171/8465 | 4.24e-03 | 1.86e-02 | 1.14e-02 | 53 |
| hsa052203 | Colorectum | MSS | Chronic myeloid leukemia | 29/1875 | 76/8465 | 1.10e-03 | 6.27e-03 | 3.84e-03 | 29 |
| hsa043103 | Colorectum | MSS | Wnt signaling pathway | 53/1875 | 171/8465 | 4.24e-03 | 1.86e-02 | 1.14e-02 | 53 |
| hsa043104 | Colorectum | FAP | Wnt signaling pathway | 46/1404 | 171/8465 | 3.94e-04 | 3.06e-03 | 1.86e-03 | 46 |
| hsa052204 | Colorectum | FAP | Chronic myeloid leukemia | 23/1404 | 76/8465 | 2.14e-03 | 1.05e-02 | 6.39e-03 | 23 |
| Page: 1 2 3 4 |
Top |
Cell-cell communication analysis |
| Identification of potential cell-cell interactions between two cell types and their ligand-receptor pairs for different disease states |
| Ligand | Receptor | LRpair | Pathway | Tissue | Disease Stage |
| Page: 1 |
Top |
Single-cell gene regulatory network inference analysis |
| Find out the significant the regulons (TFs) and the target genes of each regulon across cell types for different disease states |
| TF | Cell Type | Tissue | Disease Stage | Target Gene | RSS | Regulon Activity |
| ∗The dot plots of a searched regulon are shown for all cell subpopulations in each disease state of each tissue based on the regulon specific score inferred using pySCENIC and by calculating the average expression. |
| Page: 1 |
Top |
Somatic mutation of malignant transformation related genes |
| Annotation of somatic variants for genes involved in malignant transformation |
| Hugo Symbol | Variant Class | Variant Classification | dbSNP RS | HGVSc | HGVSp | HGVSp Short | SWISSPROT | BIOTYPE | SIFT | PolyPhen | Tumor Sample Barcode | Tissue | Histology | Sex | Age | Stage | Therapy Types | Drugs | Outcome |
| CTBP2 | SNV | Missense_Mutation | novel | c.2749N>T | p.His917Tyr | p.H917Y | P56545 | protein_coding | deleterious(0) | probably_damaging(0.979) | TCGA-C8-A12Q-01 | Breast | breast invasive carcinoma | Female | >=65 | III/IV | Unknown | Unknown | PD |
| CTBP2 | SNV | Missense_Mutation | c.2201C>T | p.Ala734Val | p.A734V | P56545 | protein_coding | deleterious(0.02) | possibly_damaging(0.563) | TCGA-2W-A8YY-01 | Cervix | cervical & endocervical cancer | Female | <65 | I/II | Chemotherapy | cisplatin | CR | |
| CTBP2 | SNV | Missense_Mutation | novel | c.2648N>T | p.Arg883Leu | p.R883L | P56545 | protein_coding | deleterious(0.03) | possibly_damaging(0.608) | TCGA-C5-A1BF-01 | Cervix | cervical & endocervical cancer | Female | <65 | I/II | Chemotherapy | cisplatin | PD |
| CTBP2 | SNV | Missense_Mutation | c.2325G>C | p.Gln775His | p.Q775H | P56545 | protein_coding | tolerated(0.09) | benign(0.047) | TCGA-EK-A3GK-01 | Cervix | cervical & endocervical cancer | Female | <65 | I/II | Unknown | Unknown | SD | |
| CTBP2 | SNV | Missense_Mutation | c.1676C>T | p.Pro559Leu | p.P559L | P56545 | protein_coding | deleterious_low_confidence(0.01) | benign(0.137) | TCGA-EX-A69M-01 | Cervix | cervical & endocervical cancer | Female | <65 | I/II | Unknown | Unknown | PD | |
| CTBP2 | SNV | Missense_Mutation | novel | c.184C>G | p.Leu62Val | p.L62V | P56545 | protein_coding | deleterious_low_confidence(0.05) | benign(0.003) | TCGA-JW-A5VL-01 | Cervix | cervical & endocervical cancer | Female | <65 | I/II | Unknown | Unknown | SD |
| CTBP2 | SNV | Missense_Mutation | novel | c.1786A>T | p.Thr596Ser | p.T596S | P56545 | protein_coding | deleterious(0.03) | possibly_damaging(0.64) | TCGA-VS-A9UB-01 | Cervix | cervical & endocervical cancer | Female | <65 | I/II | Chemotherapy | cisplatin | CR |
| CTBP2 | SNV | Missense_Mutation | rs771702203 | c.2069N>T | p.Thr690Met | p.T690M | P56545 | protein_coding | deleterious(0.01) | probably_damaging(0.999) | TCGA-A6-3809-01 | Colorectum | colon adenocarcinoma | Female | >=65 | I/II | Unknown | Unknown | SD |
| CTBP2 | SNV | Missense_Mutation | novel | c.43N>G | p.Ser15Gly | p.S15G | P56545 | protein_coding | tolerated_low_confidence(0.17) | benign(0.065) | TCGA-AA-3715-01 | Colorectum | colon adenocarcinoma | Male | >=65 | I/II | Unknown | Unknown | PD |
| CTBP2 | SNV | Missense_Mutation | c.1609C>T | p.Pro537Ser | p.P537S | P56545 | protein_coding | deleterious_low_confidence(0.05) | benign(0.015) | TCGA-AA-A01V-01 | Colorectum | colon adenocarcinoma | Male | <65 | I/II | Unknown | Unknown | SD |
| Page: 1 2 3 4 5 6 7 8 9 |
Top |
Related drugs of malignant transformation related genes |
| Identification of chemicals and drugs interact with genes involved in malignant transfromation |
| (DGIdb 4.0) |
| Entrez ID | Symbol | Category | Interaction Types | Drug Claim Name | Drug Name | PMIDs |
| Page: 1 |

Copyright 2023-Present -The University of Texas Health Science Center at Houston |