
|
|||||
|
 | |
| |
| |
| |
| |
| |
|
Gene: CTBP1 |
Gene summary for CTBP1 |
| Gene information | Species | Human | Gene symbol | CTBP1 | Gene ID | 1487 |
| Gene name | C-terminal binding protein 1 | |
| Gene Alias | BARS | |
| Cytomap | 4p16.3 | |
| Gene Type | protein-coding | GO ID | GO:0000122 | UniProtAcc | Q13363 |
Top |
Malignant transformation analysis |
| Identification of the aberrant gene expression in precancerous and cancerous lesions by comparing the gene expression of stem-like cells in diseased tissues with normal stem cells |
| Entrez ID | Symbol | Replicates | Species | Organ | Tissue | Adj P-value | Log2FC | Malignancy |
| 1487 | CTBP1 | HTA11_3410_2000001011 | Human | Colorectum | AD | 3.51e-06 | 1.81e-01 | 0.0155 |
| 1487 | CTBP1 | HTA11_2487_2000001011 | Human | Colorectum | SER | 7.12e-07 | 4.37e-01 | -0.1808 |
| 1487 | CTBP1 | HTA11_1938_2000001011 | Human | Colorectum | AD | 1.50e-09 | 5.59e-01 | -0.0811 |
| 1487 | CTBP1 | HTA11_78_2000001011 | Human | Colorectum | AD | 1.82e-08 | 4.90e-01 | -0.1088 |
| 1487 | CTBP1 | HTA11_347_2000001011 | Human | Colorectum | AD | 6.41e-25 | 6.48e-01 | -0.1954 |
| 1487 | CTBP1 | HTA11_411_2000001011 | Human | Colorectum | SER | 3.20e-03 | 6.75e-01 | -0.2602 |
| 1487 | CTBP1 | HTA11_3361_2000001011 | Human | Colorectum | AD | 7.20e-07 | 5.23e-01 | -0.1207 |
| 1487 | CTBP1 | HTA11_83_2000001011 | Human | Colorectum | SER | 5.39e-04 | 4.62e-01 | -0.1526 |
| 1487 | CTBP1 | HTA11_696_2000001011 | Human | Colorectum | AD | 4.36e-18 | 5.62e-01 | -0.1464 |
| 1487 | CTBP1 | HTA11_866_2000001011 | Human | Colorectum | AD | 8.05e-07 | 3.42e-01 | -0.1001 |
| 1487 | CTBP1 | HTA11_1391_2000001011 | Human | Colorectum | AD | 7.20e-18 | 6.96e-01 | -0.059 |
| 1487 | CTBP1 | HTA11_2992_2000001011 | Human | Colorectum | SER | 3.95e-05 | 4.56e-01 | -0.1706 |
| 1487 | CTBP1 | HTA11_5216_2000001011 | Human | Colorectum | SER | 5.27e-03 | 4.26e-01 | -0.1462 |
| 1487 | CTBP1 | HTA11_546_2000001011 | Human | Colorectum | AD | 8.36e-03 | 3.99e-01 | -0.0842 |
| 1487 | CTBP1 | HTA11_866_3004761011 | Human | Colorectum | AD | 2.97e-03 | 2.40e-01 | 0.096 |
| 1487 | CTBP1 | HTA11_7663_2000001011 | Human | Colorectum | SER | 1.23e-03 | 3.60e-01 | 0.0131 |
| 1487 | CTBP1 | HTA11_10711_2000001011 | Human | Colorectum | AD | 4.39e-02 | 1.67e-01 | 0.0338 |
| 1487 | CTBP1 | HTA11_7696_3000711011 | Human | Colorectum | AD | 1.14e-04 | 2.28e-01 | 0.0674 |
| 1487 | CTBP1 | HTA11_6818_2000001011 | Human | Colorectum | AD | 2.16e-02 | 4.16e-01 | 0.0112 |
| 1487 | CTBP1 | HTA11_7469_2000001011 | Human | Colorectum | AD | 1.75e-02 | 4.33e-01 | -0.0124 |
| Page: 1 2 3 4 5 6 7 8 |
| Tissue | Expression Dynamics | Abbreviation |
| Colorectum (GSE201348) | 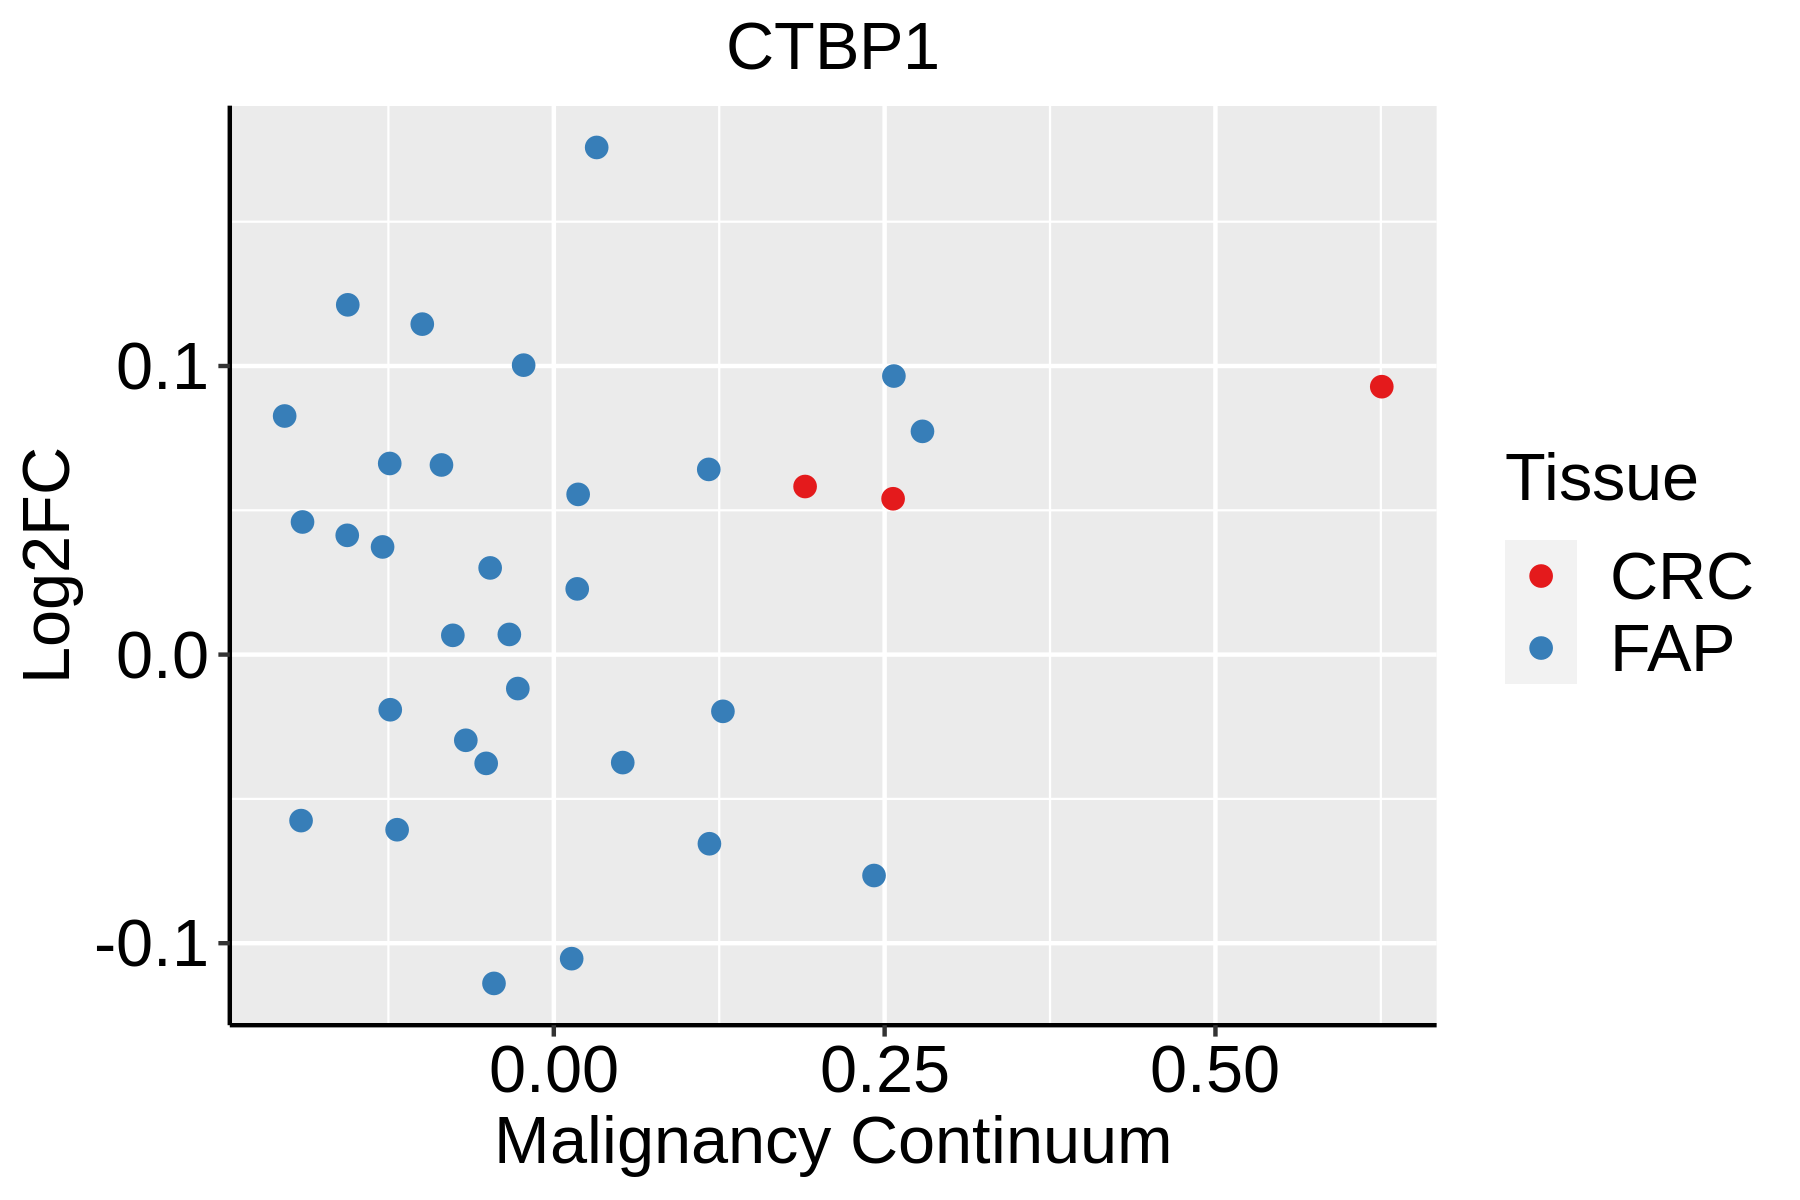 | FAP: Familial adenomatous polyposis |
| CRC: Colorectal cancer | ||
| Colorectum (HTA11) |  | AD: Adenomas |
| SER: Sessile serrated lesions | ||
| MSI-H: Microsatellite-high colorectal cancer | ||
| MSS: Microsatellite stable colorectal cancer | ||
| Esophagus | 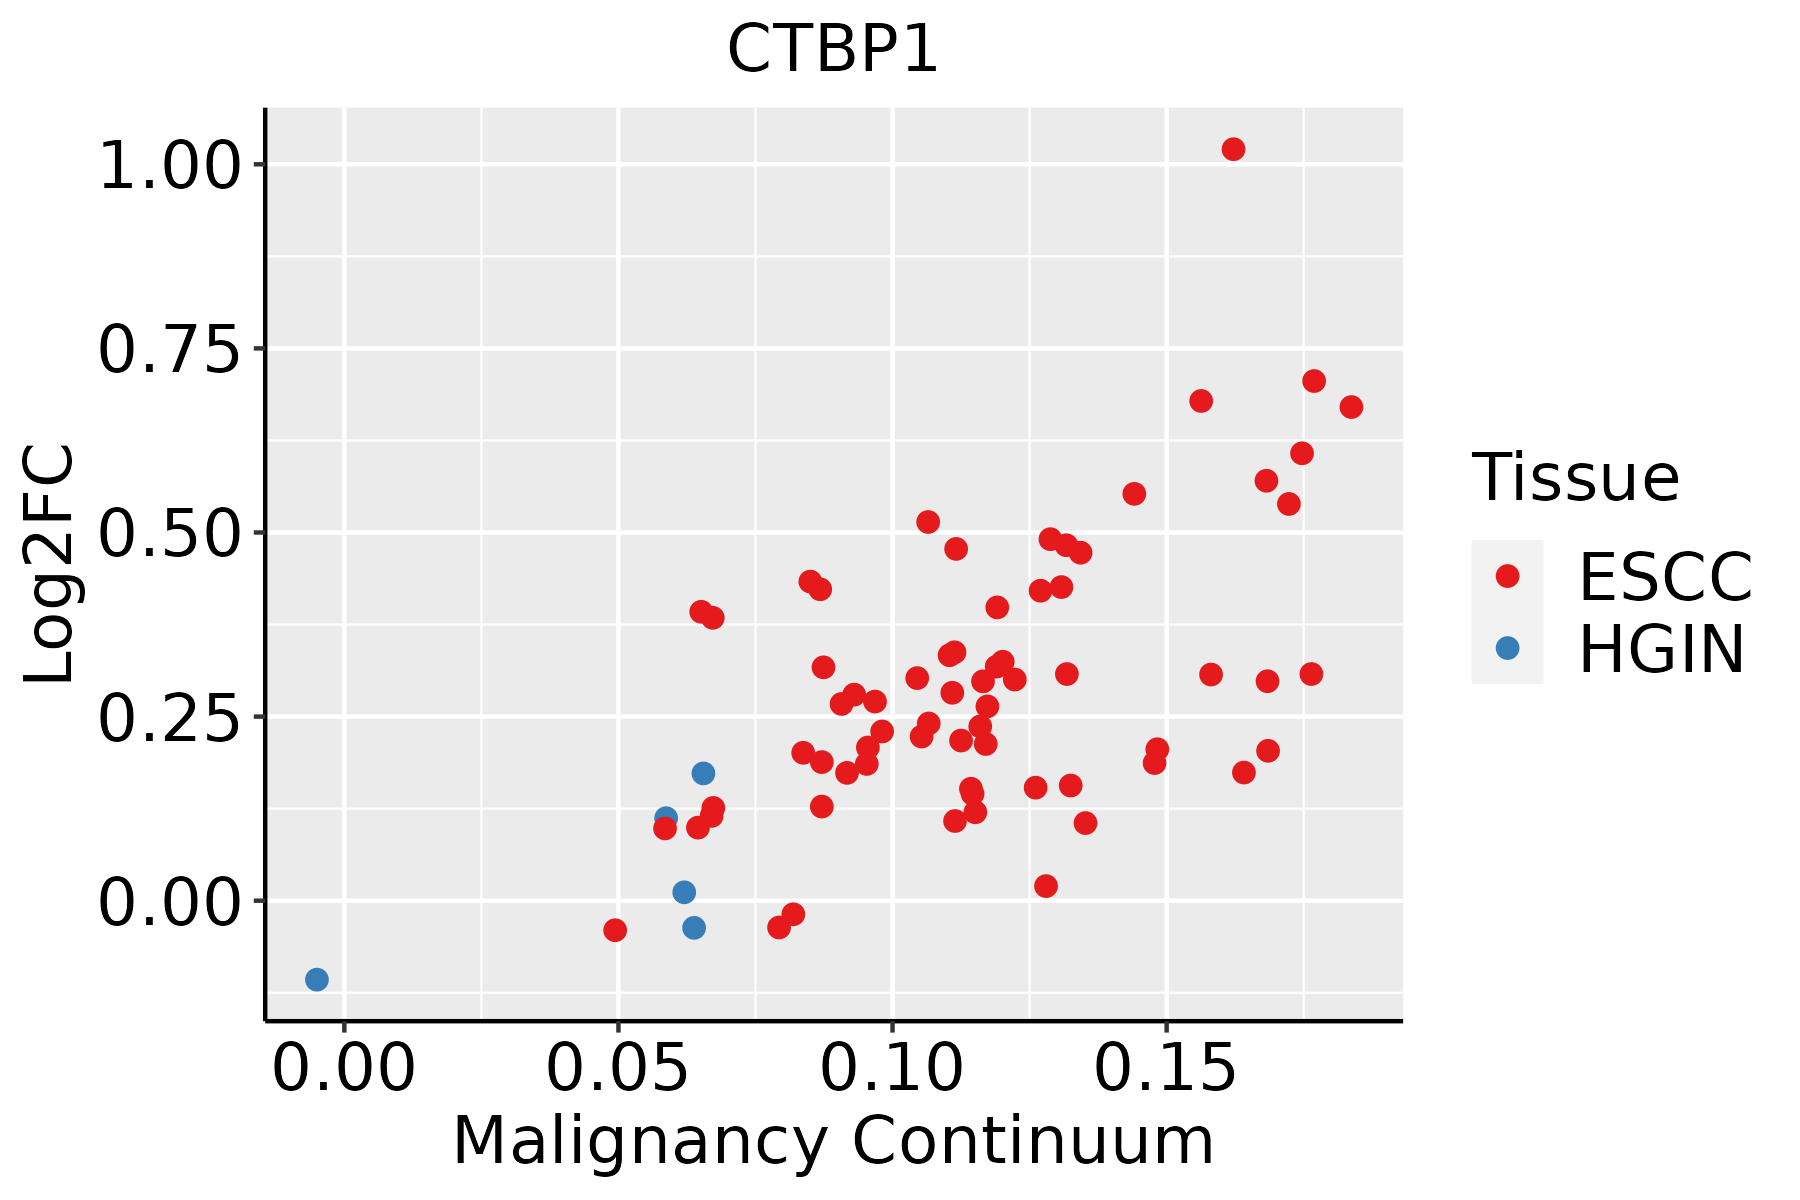 | ESCC: Esophageal squamous cell carcinoma |
| HGIN: High-grade intraepithelial neoplasias | ||
| LGIN: Low-grade intraepithelial neoplasias | ||
| Liver | 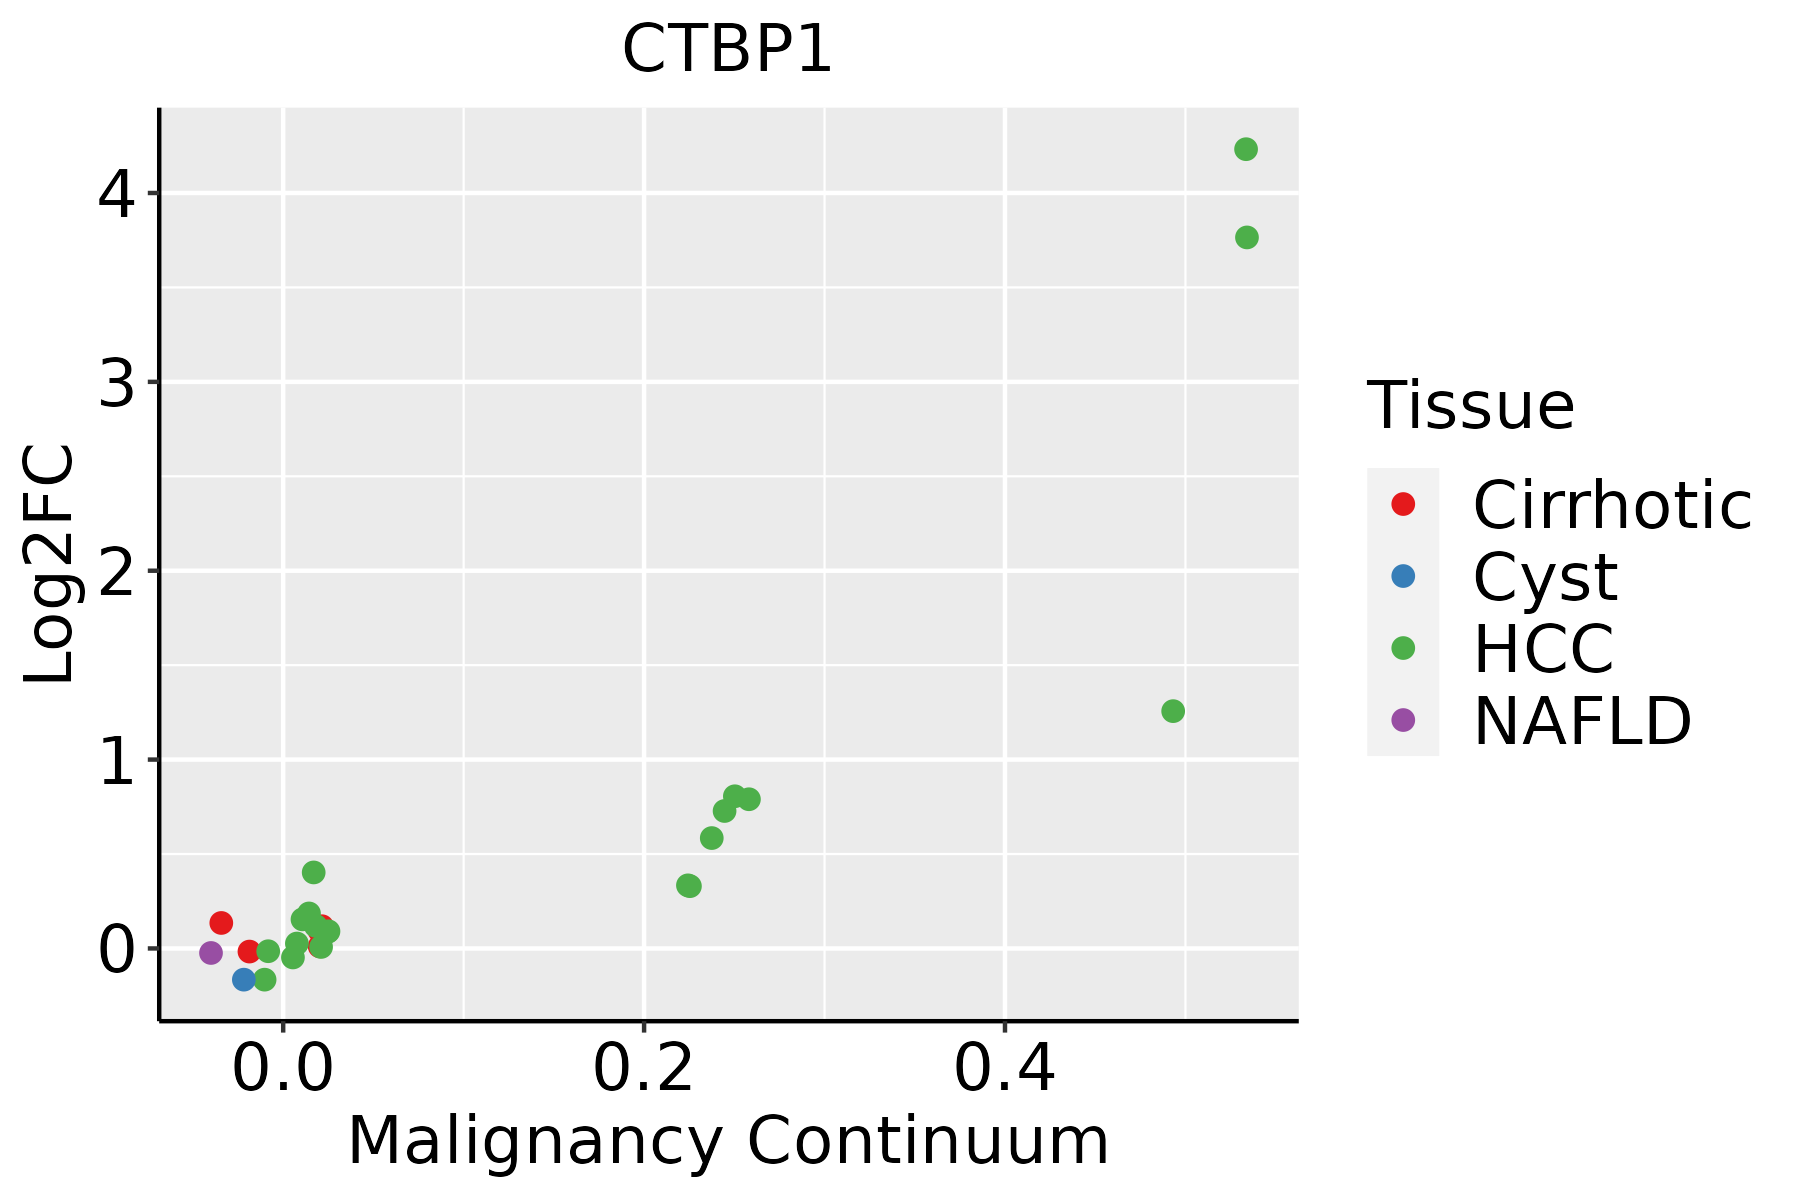 | HCC: Hepatocellular carcinoma |
| NAFLD: Non-alcoholic fatty liver disease | ||
| Oral Cavity | 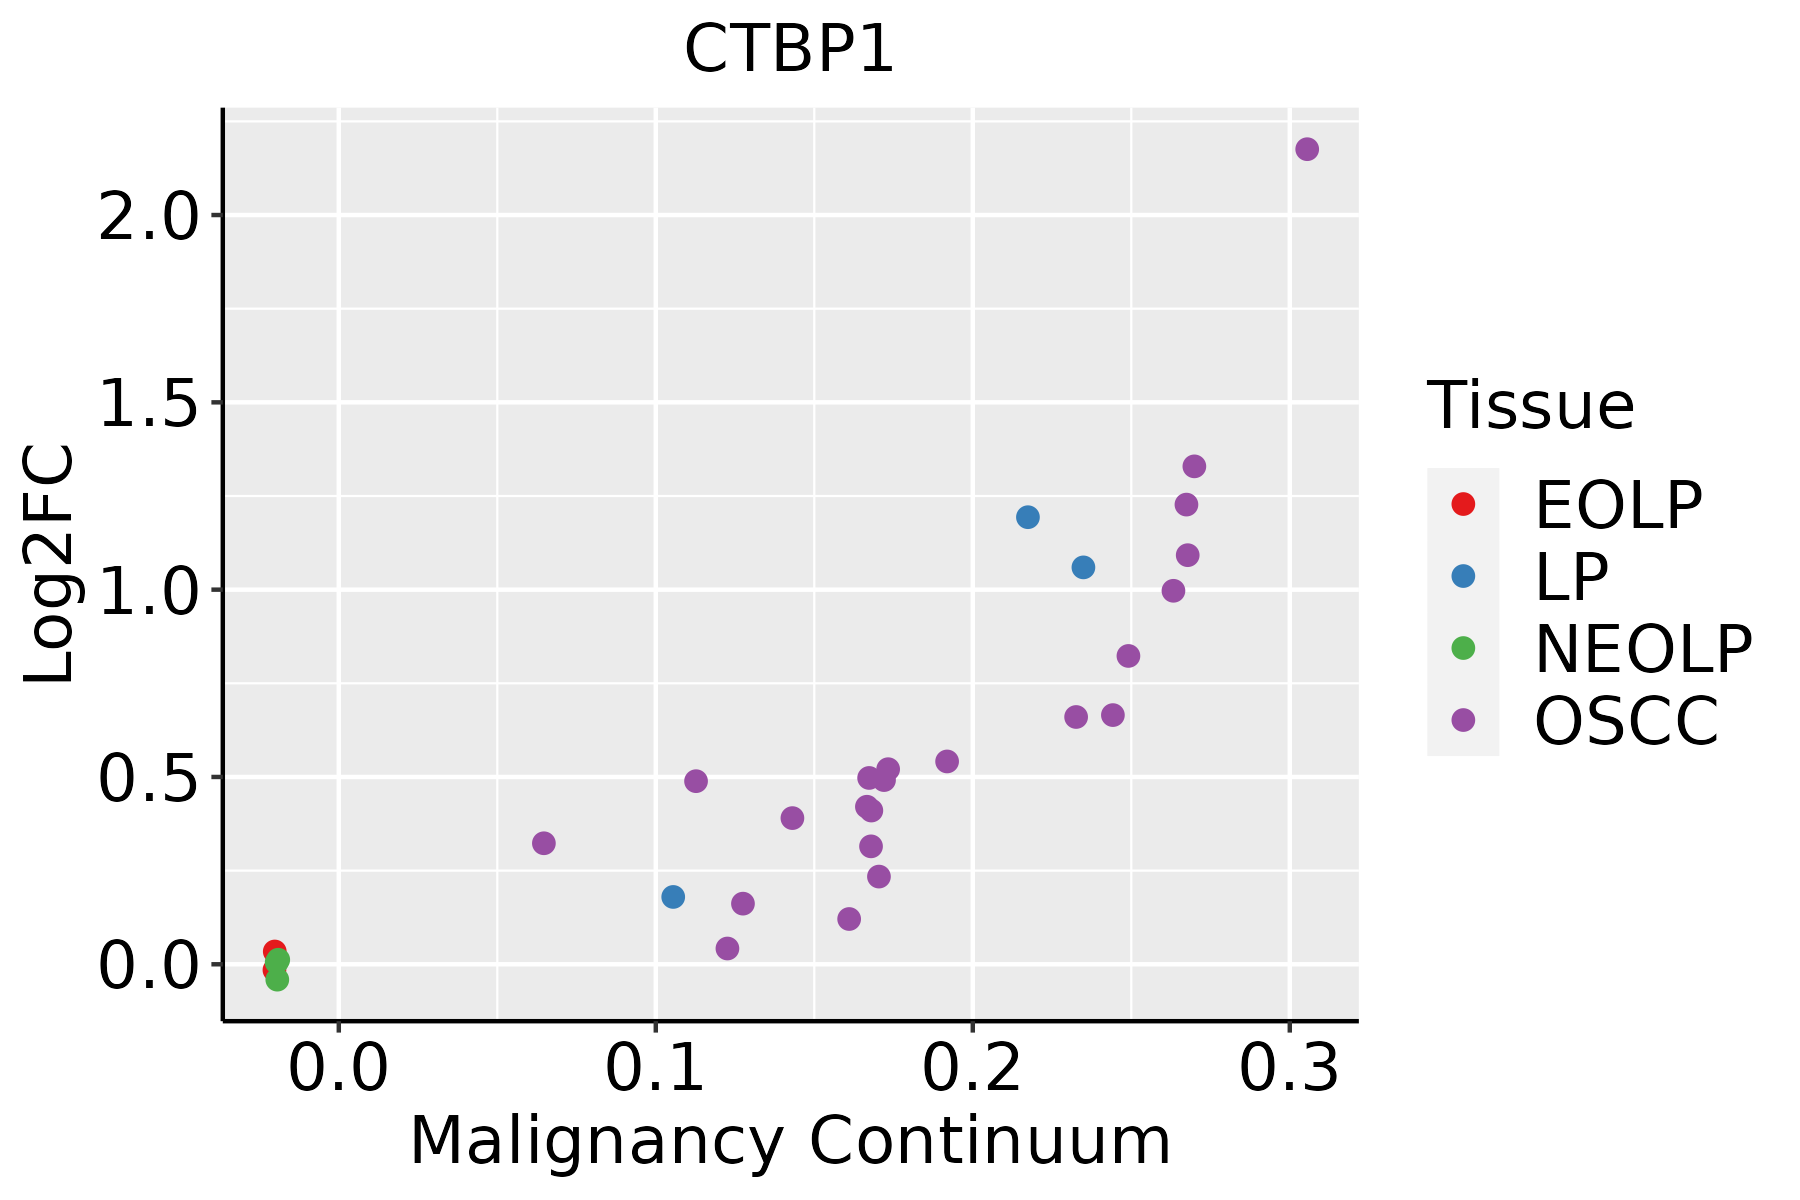 | EOLP: Erosive Oral lichen planus |
| LP: leukoplakia | ||
| NEOLP: Non-erosive oral lichen planus | ||
| OSCC: Oral squamous cell carcinoma | ||
| Skin | 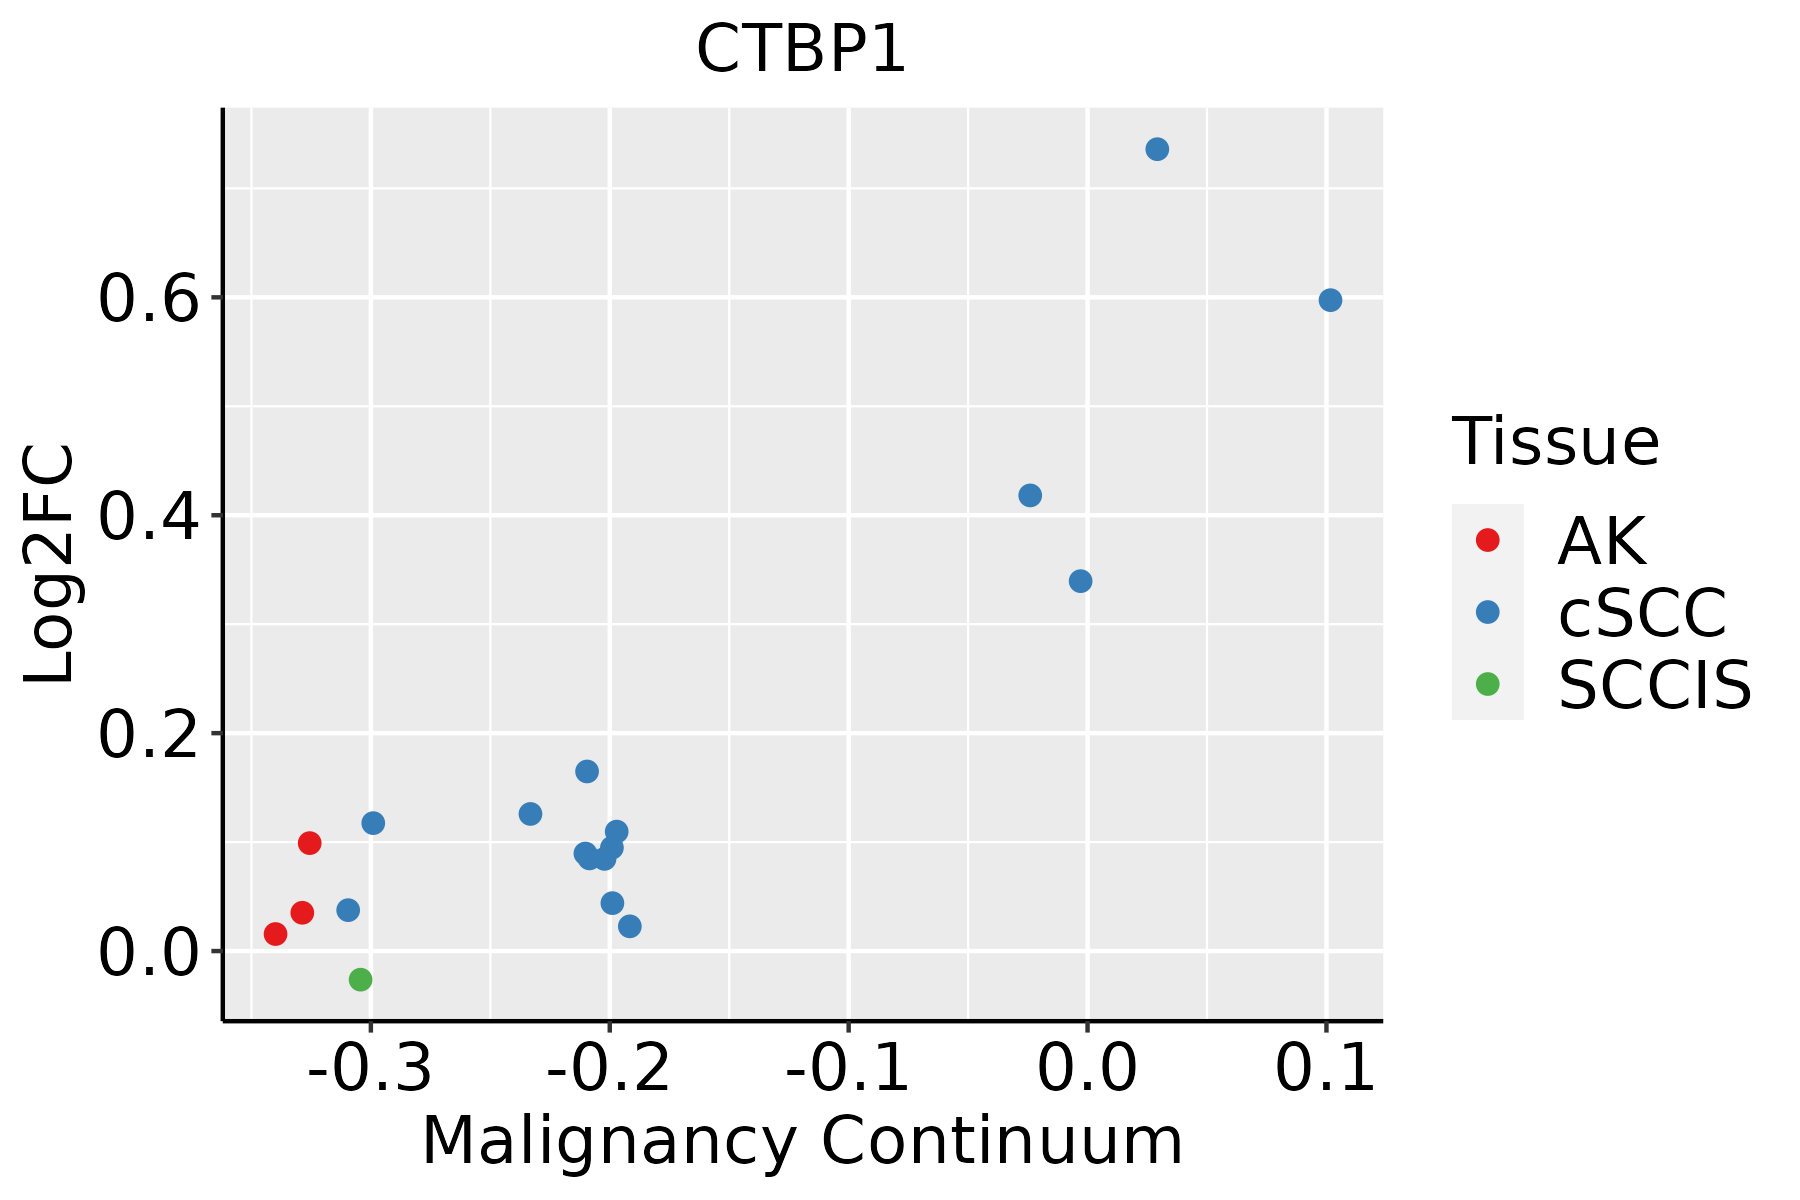 | AK: Actinic keratosis |
| cSCC: Cutaneous squamous cell carcinoma | ||
| SCCIS:squamous cell carcinoma in situ | ||
| Thyroid | 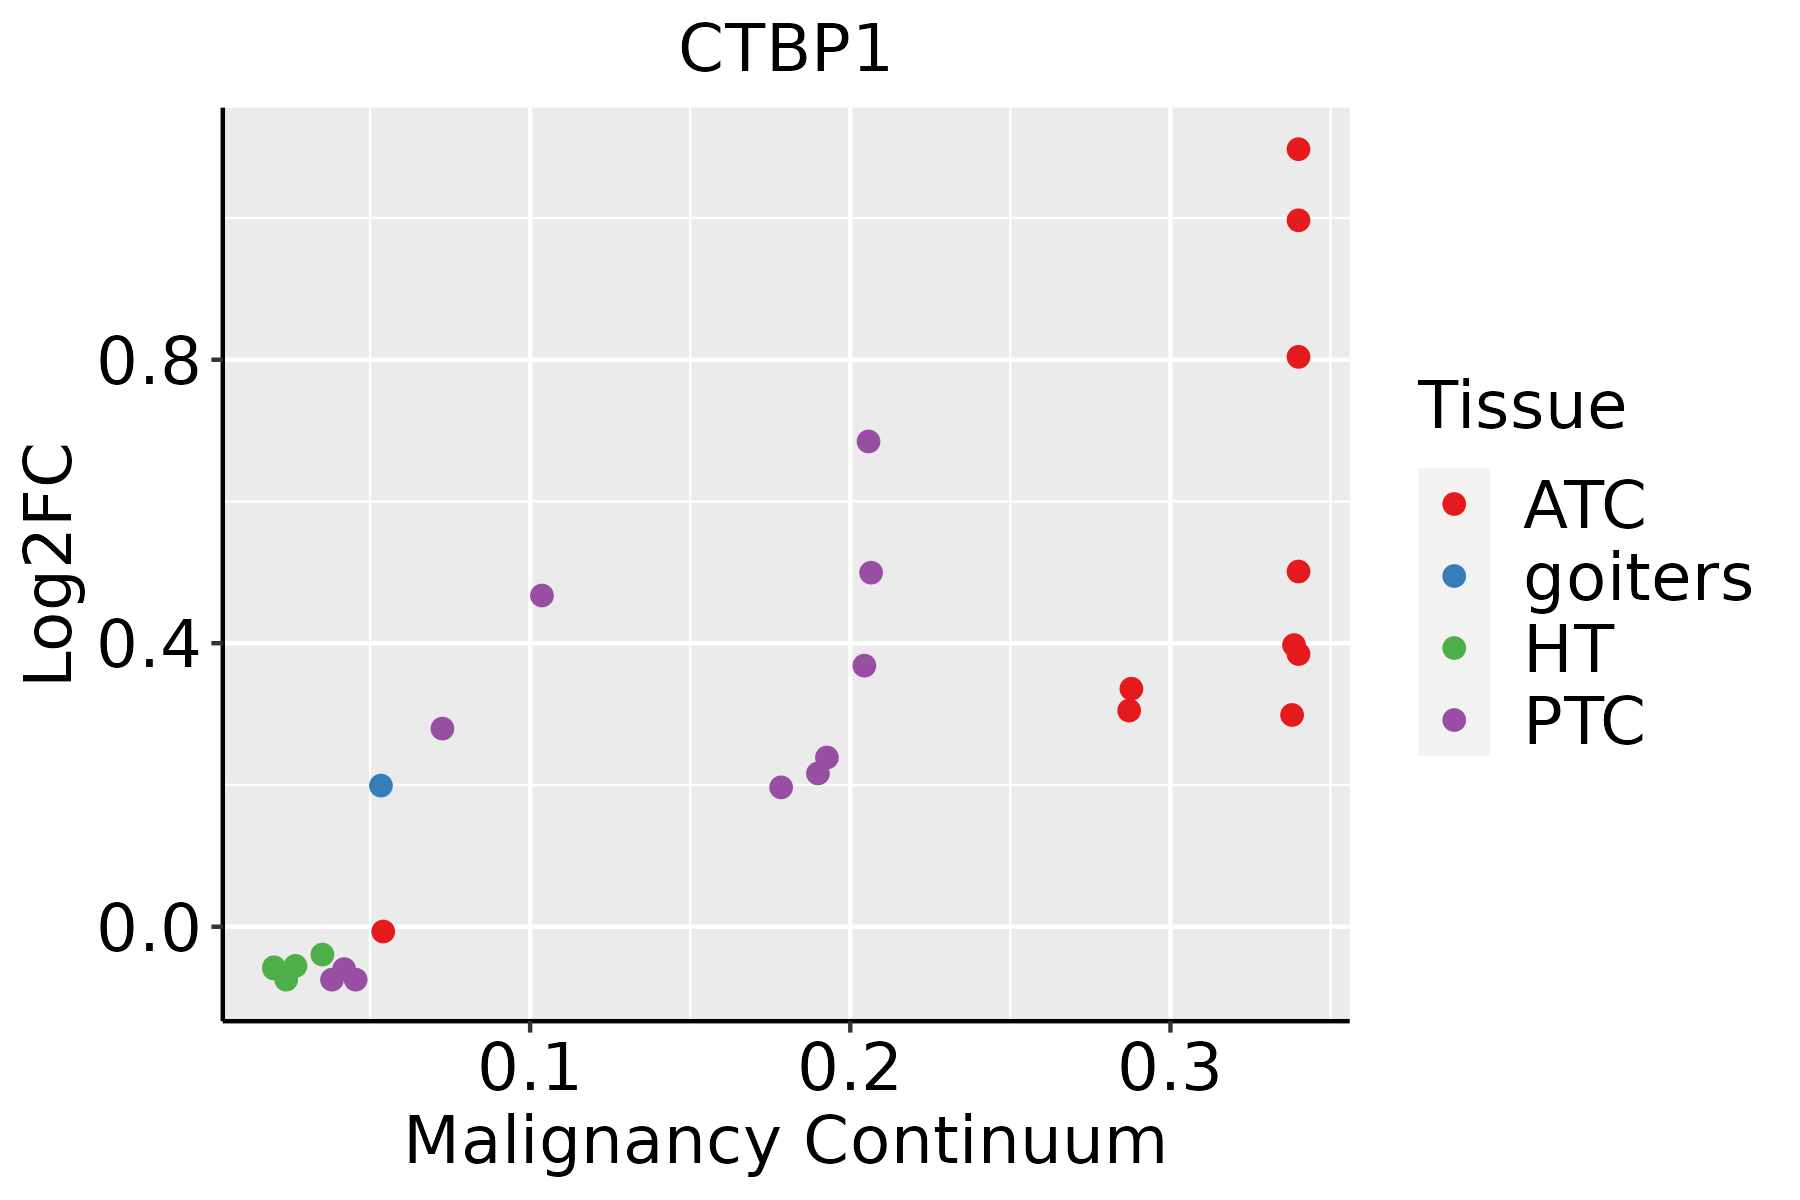 | ATC: Anaplastic thyroid cancer |
| HT: Hashimoto's thyroiditis | ||
| PTC: Papillary thyroid cancer |
| ∗log2FC in expression of this searched gene in stem-like cells from each diseased tissue sample relative to stem-like cells in normal samples in each tissue plotted against the malignancy continuum. Samples are colored based on if they are from different disease stage. |
Top |
Malignant transformation related pathway analysis |
| Find out the enriched GO biological processes and KEGG pathways involved in transition from healthy to precancer to cancer |
| Tissue | Disease Stage | Enriched GO biological Processes |
| Colorectum | AD |  |
| Colorectum | SER |  |
| Colorectum | MSS |  |
| Colorectum | MSI-H |  |
| Colorectum | FAP |  |
| ∗Top 15 enriched GO BP terms are showed in the bar plot of each disease state in each tissue. Each row represents a significant GO biological process which is colored according to the -log10(p.adjust). |
| Page: 1 2 3 4 5 6 7 8 9 |
| GO ID | Tissue | Disease Stage | Description | Gene Ratio | Bg Ratio | pvalue | p.adjust | Count |
| GO:0016032 | Colorectum | AD | viral process | 168/3918 | 415/18723 | 4.67e-20 | 3.66e-17 | 168 |
| GO:0019058 | Colorectum | AD | viral life cycle | 119/3918 | 317/18723 | 6.18e-12 | 8.23e-10 | 119 |
| GO:0019079 | Colorectum | AD | viral genome replication | 51/3918 | 131/18723 | 1.83e-06 | 5.51e-05 | 51 |
| GO:0031056 | Colorectum | AD | regulation of histone modification | 45/3918 | 152/18723 | 7.05e-03 | 4.31e-02 | 45 |
| GO:00160321 | Colorectum | SER | viral process | 118/2897 | 415/18723 | 8.36e-12 | 1.65e-09 | 118 |
| GO:00190581 | Colorectum | SER | viral life cycle | 87/2897 | 317/18723 | 2.82e-08 | 1.94e-06 | 87 |
| GO:00190791 | Colorectum | SER | viral genome replication | 37/2897 | 131/18723 | 1.36e-04 | 2.72e-03 | 37 |
| GO:1901984 | Colorectum | SER | negative regulation of protein acetylation | 10/2897 | 24/18723 | 1.88e-03 | 1.90e-02 | 10 |
| GO:00310561 | Colorectum | SER | regulation of histone modification | 37/2897 | 152/18723 | 2.80e-03 | 2.50e-02 | 37 |
| GO:0045444 | Colorectum | SER | fat cell differentiation | 51/2897 | 229/18723 | 3.96e-03 | 3.26e-02 | 51 |
| GO:2000757 | Colorectum | SER | negative regulation of peptidyl-lysine acetylation | 8/2897 | 20/18723 | 7.14e-03 | 4.99e-02 | 8 |
| GO:00160322 | Colorectum | MSS | viral process | 157/3467 | 415/18723 | 7.94e-21 | 6.19e-18 | 157 |
| GO:00190582 | Colorectum | MSS | viral life cycle | 111/3467 | 317/18723 | 1.65e-12 | 2.95e-10 | 111 |
| GO:00190792 | Colorectum | MSS | viral genome replication | 49/3467 | 131/18723 | 2.73e-07 | 1.11e-05 | 49 |
| GO:0016570 | Colorectum | MSS | histone modification | 113/3467 | 463/18723 | 8.37e-04 | 8.68e-03 | 113 |
| GO:00310562 | Colorectum | MSS | regulation of histone modification | 41/3467 | 152/18723 | 6.41e-03 | 4.27e-02 | 41 |
| GO:00160323 | Colorectum | MSI-H | viral process | 74/1319 | 415/18723 | 8.87e-14 | 2.05e-11 | 74 |
| GO:00190583 | Colorectum | MSI-H | viral life cycle | 53/1319 | 317/18723 | 3.27e-09 | 4.32e-07 | 53 |
| GO:00190793 | Colorectum | MSI-H | viral genome replication | 29/1319 | 131/18723 | 2.57e-08 | 2.80e-06 | 29 |
| GO:00160324 | Colorectum | FAP | viral process | 114/2622 | 415/18723 | 3.00e-13 | 2.63e-10 | 114 |
| Page: 1 2 3 4 5 6 7 8 9 10 11 12 |
| Pathway ID | Tissue | Disease Stage | Description | Gene Ratio | Bg Ratio | pvalue | p.adjust | qvalue | Count |
| hsa05220 | Colorectum | AD | Chronic myeloid leukemia | 31/2092 | 76/8465 | 1.41e-03 | 8.46e-03 | 5.39e-03 | 31 |
| hsa04310 | Colorectum | AD | Wnt signaling pathway | 56/2092 | 171/8465 | 1.03e-02 | 3.93e-02 | 2.51e-02 | 56 |
| hsa052201 | Colorectum | AD | Chronic myeloid leukemia | 31/2092 | 76/8465 | 1.41e-03 | 8.46e-03 | 5.39e-03 | 31 |
| hsa043101 | Colorectum | AD | Wnt signaling pathway | 56/2092 | 171/8465 | 1.03e-02 | 3.93e-02 | 2.51e-02 | 56 |
| hsa052202 | Colorectum | MSS | Chronic myeloid leukemia | 29/1875 | 76/8465 | 1.10e-03 | 6.27e-03 | 3.84e-03 | 29 |
| hsa043102 | Colorectum | MSS | Wnt signaling pathway | 53/1875 | 171/8465 | 4.24e-03 | 1.86e-02 | 1.14e-02 | 53 |
| hsa052203 | Colorectum | MSS | Chronic myeloid leukemia | 29/1875 | 76/8465 | 1.10e-03 | 6.27e-03 | 3.84e-03 | 29 |
| hsa043103 | Colorectum | MSS | Wnt signaling pathway | 53/1875 | 171/8465 | 4.24e-03 | 1.86e-02 | 1.14e-02 | 53 |
| hsa0522020 | Esophagus | ESCC | Chronic myeloid leukemia | 61/4205 | 76/8465 | 3.20e-08 | 2.68e-07 | 1.37e-07 | 61 |
| hsa043306 | Esophagus | ESCC | Notch signaling pathway | 42/4205 | 62/8465 | 2.97e-03 | 7.97e-03 | 4.08e-03 | 42 |
| hsa05220110 | Esophagus | ESCC | Chronic myeloid leukemia | 61/4205 | 76/8465 | 3.20e-08 | 2.68e-07 | 1.37e-07 | 61 |
| hsa0433013 | Esophagus | ESCC | Notch signaling pathway | 42/4205 | 62/8465 | 2.97e-03 | 7.97e-03 | 4.08e-03 | 42 |
| hsa052208 | Liver | Cirrhotic | Chronic myeloid leukemia | 33/2530 | 76/8465 | 8.23e-03 | 2.83e-02 | 1.74e-02 | 33 |
| hsa0522011 | Liver | Cirrhotic | Chronic myeloid leukemia | 33/2530 | 76/8465 | 8.23e-03 | 2.83e-02 | 1.74e-02 | 33 |
| hsa0522021 | Liver | HCC | Chronic myeloid leukemia | 55/4020 | 76/8465 | 8.67e-06 | 6.91e-05 | 3.84e-05 | 55 |
| hsa0522031 | Liver | HCC | Chronic myeloid leukemia | 55/4020 | 76/8465 | 8.67e-06 | 6.91e-05 | 3.84e-05 | 55 |
| hsa0522018 | Oral cavity | OSCC | Chronic myeloid leukemia | 56/3704 | 76/8465 | 1.04e-07 | 7.43e-07 | 3.78e-07 | 56 |
| hsa043305 | Oral cavity | OSCC | Notch signaling pathway | 44/3704 | 62/8465 | 1.26e-05 | 5.55e-05 | 2.83e-05 | 44 |
| hsa0522019 | Oral cavity | OSCC | Chronic myeloid leukemia | 56/3704 | 76/8465 | 1.04e-07 | 7.43e-07 | 3.78e-07 | 56 |
| hsa0433012 | Oral cavity | OSCC | Notch signaling pathway | 44/3704 | 62/8465 | 1.26e-05 | 5.55e-05 | 2.83e-05 | 44 |
| Page: 1 2 |
Top |
Cell-cell communication analysis |
| Identification of potential cell-cell interactions between two cell types and their ligand-receptor pairs for different disease states |
| Ligand | Receptor | LRpair | Pathway | Tissue | Disease Stage |
| Page: 1 |
Top |
Single-cell gene regulatory network inference analysis |
| Find out the significant the regulons (TFs) and the target genes of each regulon across cell types for different disease states |
| TF | Cell Type | Tissue | Disease Stage | Target Gene | RSS | Regulon Activity |
| CTBP1 | MVA | Colorectum | ADJ | TIMP1,TNFAIP2,RNF220, etc. | 0.00e+00 |  |
| CTBP1 | ICAF | Colorectum | Healthy | TIMP1,TNFAIP2,RNF220, etc. | 1.92e-02 |  |
| CTBP1 | INCAF | Colorectum | MSS | TIMP1,TNFAIP2,RNF220, etc. | 3.95e-02 |  |
| ∗The dot plots of a searched regulon are shown for all cell subpopulations in each disease state of each tissue based on the regulon specific score inferred using pySCENIC and by calculating the average expression. |
| Page: 1 |
Top |
Somatic mutation of malignant transformation related genes |
| Annotation of somatic variants for genes involved in malignant transformation |
| Hugo Symbol | Variant Class | Variant Classification | dbSNP RS | HGVSc | HGVSp | HGVSp Short | SWISSPROT | BIOTYPE | SIFT | PolyPhen | Tumor Sample Barcode | Tissue | Histology | Sex | Age | Stage | Therapy Types | Drugs | Outcome |
| CTBP1 | SNV | Missense_Mutation | c.205N>A | p.Glu69Lys | p.E69K | Q13363 | protein_coding | deleterious(0.01) | probably_damaging(0.998) | TCGA-AC-A23H-01 | Breast | breast invasive carcinoma | Female | >=65 | I/II | Unknown | Unknown | PD | |
| CTBP1 | SNV | Missense_Mutation | novel | c.793G>A | p.Ala265Thr | p.A265T | Q13363 | protein_coding | deleterious(0.03) | possibly_damaging(0.881) | TCGA-2W-A8YY-01 | Cervix | cervical & endocervical cancer | Female | <65 | I/II | Chemotherapy | cisplatin | CR |
| CTBP1 | SNV | Missense_Mutation | c.259N>C | p.Glu87Gln | p.E87Q | Q13363 | protein_coding | tolerated(0.06) | benign(0.41) | TCGA-EK-A3GK-01 | Cervix | cervical & endocervical cancer | Female | <65 | I/II | Unknown | Unknown | SD | |
| CTBP1 | SNV | Missense_Mutation | c.853N>T | p.Arg285Cys | p.R285C | Q13363 | protein_coding | deleterious(0.02) | probably_damaging(0.98) | TCGA-VS-A959-01 | Cervix | cervical & endocervical cancer | Female | >=65 | I/II | Unknown | Unknown | SD | |
| CTBP1 | SNV | Missense_Mutation | c.784G>A | p.Val262Met | p.V262M | Q13363 | protein_coding | deleterious(0) | probably_damaging(0.998) | TCGA-AA-3663-01 | Colorectum | colon adenocarcinoma | Male | <65 | I/II | Unknown | Unknown | SD | |
| CTBP1 | SNV | Missense_Mutation | c.326N>T | p.Ser109Leu | p.S109L | Q13363 | protein_coding | deleterious(0.05) | benign(0.298) | TCGA-AA-A010-01 | Colorectum | colon adenocarcinoma | Female | <65 | I/II | Chemotherapy | folinic | CR | |
| CTBP1 | SNV | Missense_Mutation | c.1047N>G | p.Asn349Lys | p.N349K | Q13363 | protein_coding | deleterious(0.02) | possibly_damaging(0.579) | TCGA-CM-4743-01 | Colorectum | colon adenocarcinoma | Male | >=65 | I/II | Chemotherapy | capecitabine | SD | |
| CTBP1 | SNV | Missense_Mutation | c.796N>T | p.Arg266Trp | p.R266W | Q13363 | protein_coding | deleterious(0) | probably_damaging(0.996) | TCGA-CM-5861-01 | Colorectum | colon adenocarcinoma | Female | <65 | I/II | Unknown | Unknown | PD | |
| CTBP1 | SNV | Missense_Mutation | rs138269585 | c.1105G>A | p.Val369Ile | p.V369I | Q13363 | protein_coding | deleterious(0.01) | benign(0.03) | TCGA-DM-A1HB-01 | Colorectum | colon adenocarcinoma | Male | >=65 | III/IV | Unknown | Unknown | SD |
| CTBP1 | SNV | Missense_Mutation | c.148A>G | p.Thr50Ala | p.T50A | Q13363 | protein_coding | deleterious(0.02) | benign(0.288) | TCGA-F4-6570-01 | Colorectum | colon adenocarcinoma | Female | >=65 | I/II | Unknown | Unknown | SD |
| Page: 1 2 3 4 |
Top |
Related drugs of malignant transformation related genes |
| Identification of chemicals and drugs interact with genes involved in malignant transfromation |
| (DGIdb 4.0) |
| Entrez ID | Symbol | Category | Interaction Types | Drug Claim Name | Drug Name | PMIDs |
| Page: 1 |

Copyright 2023-Present -The University of Texas Health Science Center at Houston |