
|
|||||
|
 | |
| |
| |
| |
| |
| |
|
Gene: CSTF3 |
Gene summary for CSTF3 |
| Gene information | Species | Human | Gene symbol | CSTF3 | Gene ID | 1479 |
| Gene name | cleavage stimulation factor subunit 3 | |
| Gene Alias | CSTF-77 | |
| Cytomap | 11p13 | |
| Gene Type | protein-coding | GO ID | GO:0006139 | UniProtAcc | Q12996 |
Top |
Malignant transformation analysis |
| Identification of the aberrant gene expression in precancerous and cancerous lesions by comparing the gene expression of stem-like cells in diseased tissues with normal stem cells |
| Entrez ID | Symbol | Replicates | Species | Organ | Tissue | Adj P-value | Log2FC | Malignancy |
| 1479 | CSTF3 | S43 | Human | Liver | Cirrhotic | 1.12e-05 | -1.25e-01 | -0.0187 |
| 1479 | CSTF3 | HCC1_Meng | Human | Liver | HCC | 6.44e-58 | 4.72e-03 | 0.0246 |
| 1479 | CSTF3 | HCC2_Meng | Human | Liver | HCC | 1.70e-07 | -6.71e-02 | 0.0107 |
| 1479 | CSTF3 | HCC1 | Human | Liver | HCC | 2.77e-04 | 3.31e+00 | 0.5336 |
| 1479 | CSTF3 | Pt13.b | Human | Liver | HCC | 4.74e-02 | 7.09e-02 | 0.0251 |
| 1479 | CSTF3 | Pt14.a | Human | Liver | HCC | 3.96e-03 | 3.11e-01 | 0.0169 |
| 1479 | CSTF3 | S028 | Human | Liver | HCC | 1.30e-06 | 4.84e-01 | 0.2503 |
| 1479 | CSTF3 | S029 | Human | Liver | HCC | 2.97e-08 | 6.78e-01 | 0.2581 |
| 1479 | CSTF3 | C04 | Human | Oral cavity | OSCC | 5.40e-19 | 8.74e-01 | 0.2633 |
| 1479 | CSTF3 | C21 | Human | Oral cavity | OSCC | 1.12e-39 | 1.13e+00 | 0.2678 |
| 1479 | CSTF3 | C30 | Human | Oral cavity | OSCC | 8.25e-27 | 1.04e+00 | 0.3055 |
| 1479 | CSTF3 | C38 | Human | Oral cavity | OSCC | 6.63e-03 | 6.29e-01 | 0.172 |
| 1479 | CSTF3 | C43 | Human | Oral cavity | OSCC | 1.00e-11 | 2.69e-01 | 0.1704 |
| 1479 | CSTF3 | C46 | Human | Oral cavity | OSCC | 5.29e-26 | 5.94e-01 | 0.1673 |
| 1479 | CSTF3 | C51 | Human | Oral cavity | OSCC | 8.30e-23 | 9.31e-01 | 0.2674 |
| 1479 | CSTF3 | C57 | Human | Oral cavity | OSCC | 2.60e-15 | 6.04e-01 | 0.1679 |
| 1479 | CSTF3 | C07 | Human | Oral cavity | OSCC | 8.44e-05 | 9.02e-01 | 0.2491 |
| 1479 | CSTF3 | C08 | Human | Oral cavity | OSCC | 1.16e-15 | 3.45e-01 | 0.1919 |
| 1479 | CSTF3 | LN22 | Human | Oral cavity | OSCC | 1.29e-02 | 4.46e-01 | 0.1733 |
| 1479 | CSTF3 | LN38 | Human | Oral cavity | OSCC | 2.05e-02 | 5.18e-01 | 0.168 |
| Page: 1 2 3 |
| Tissue | Expression Dynamics | Abbreviation |
| Liver | 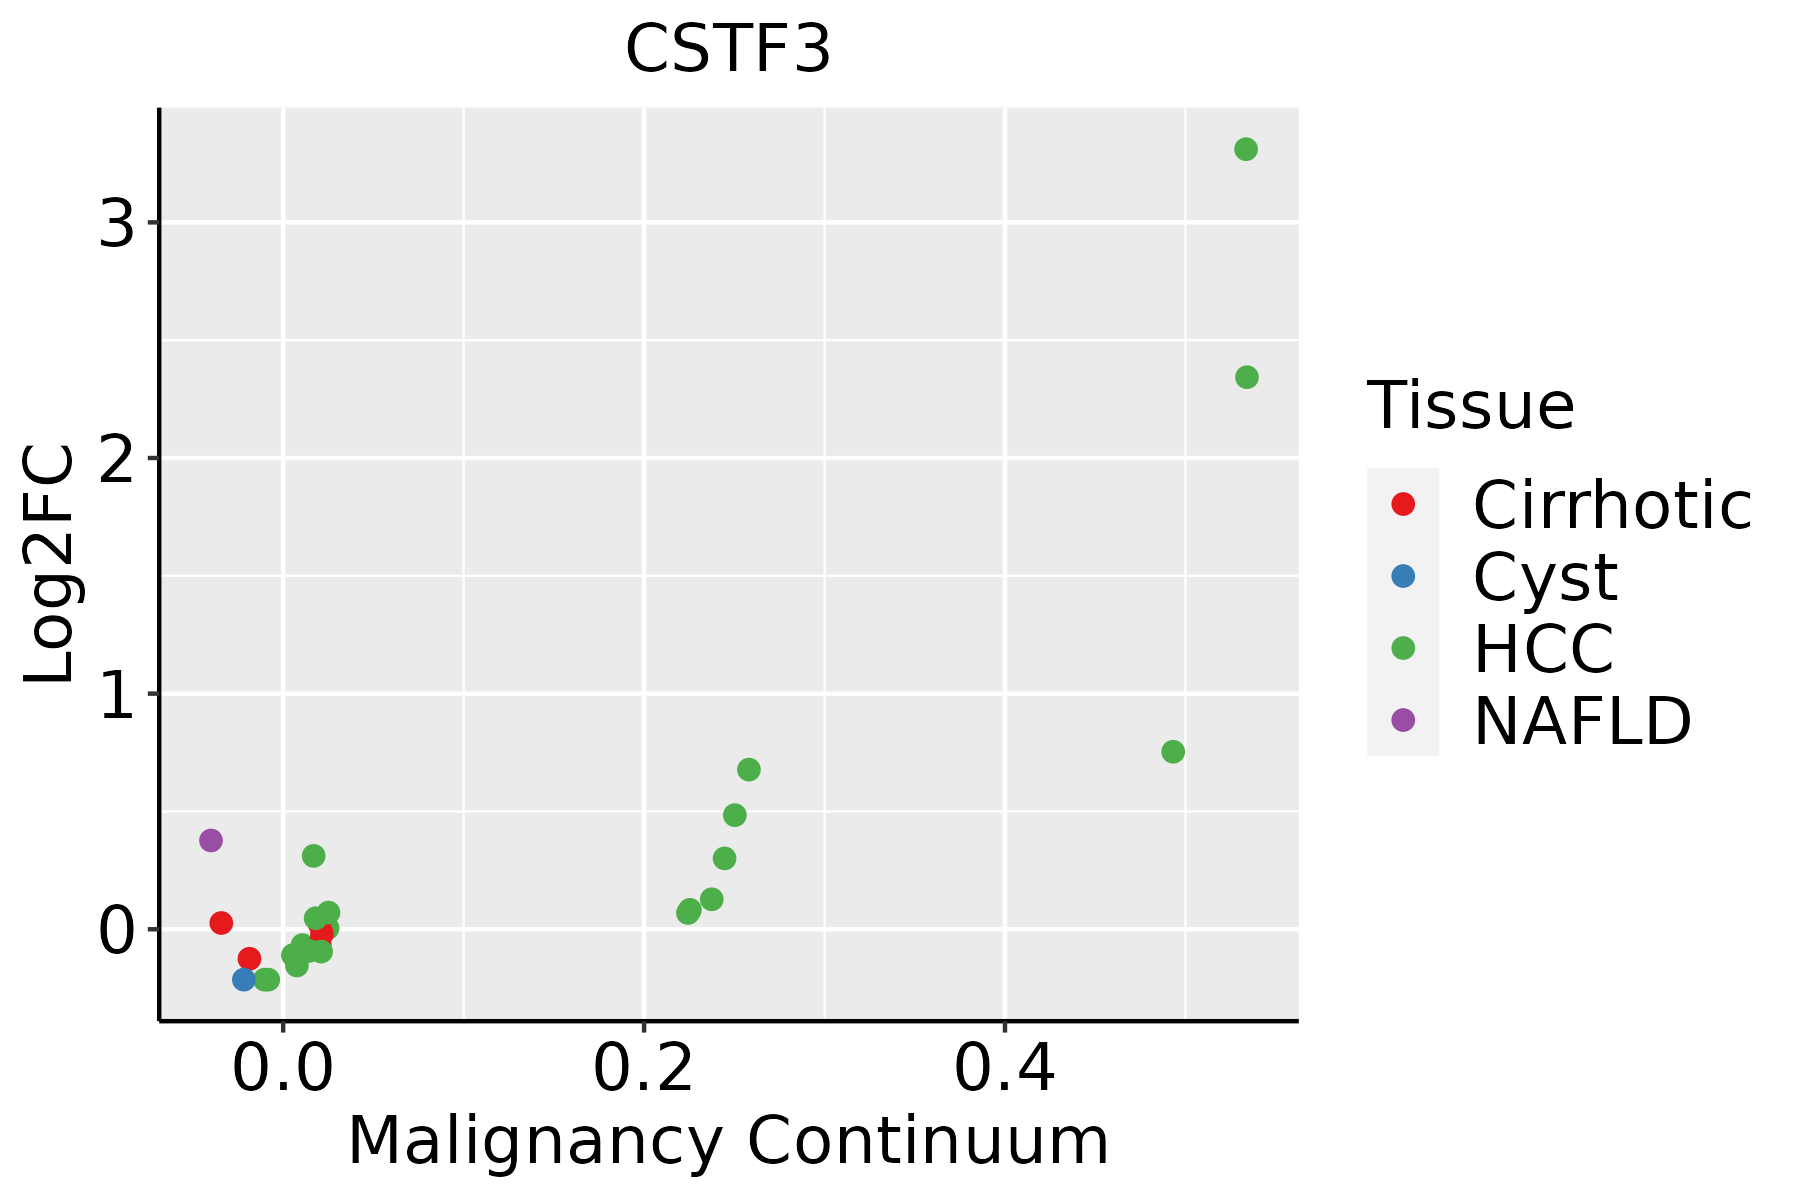 | HCC: Hepatocellular carcinoma |
| NAFLD: Non-alcoholic fatty liver disease | ||
| Oral Cavity | 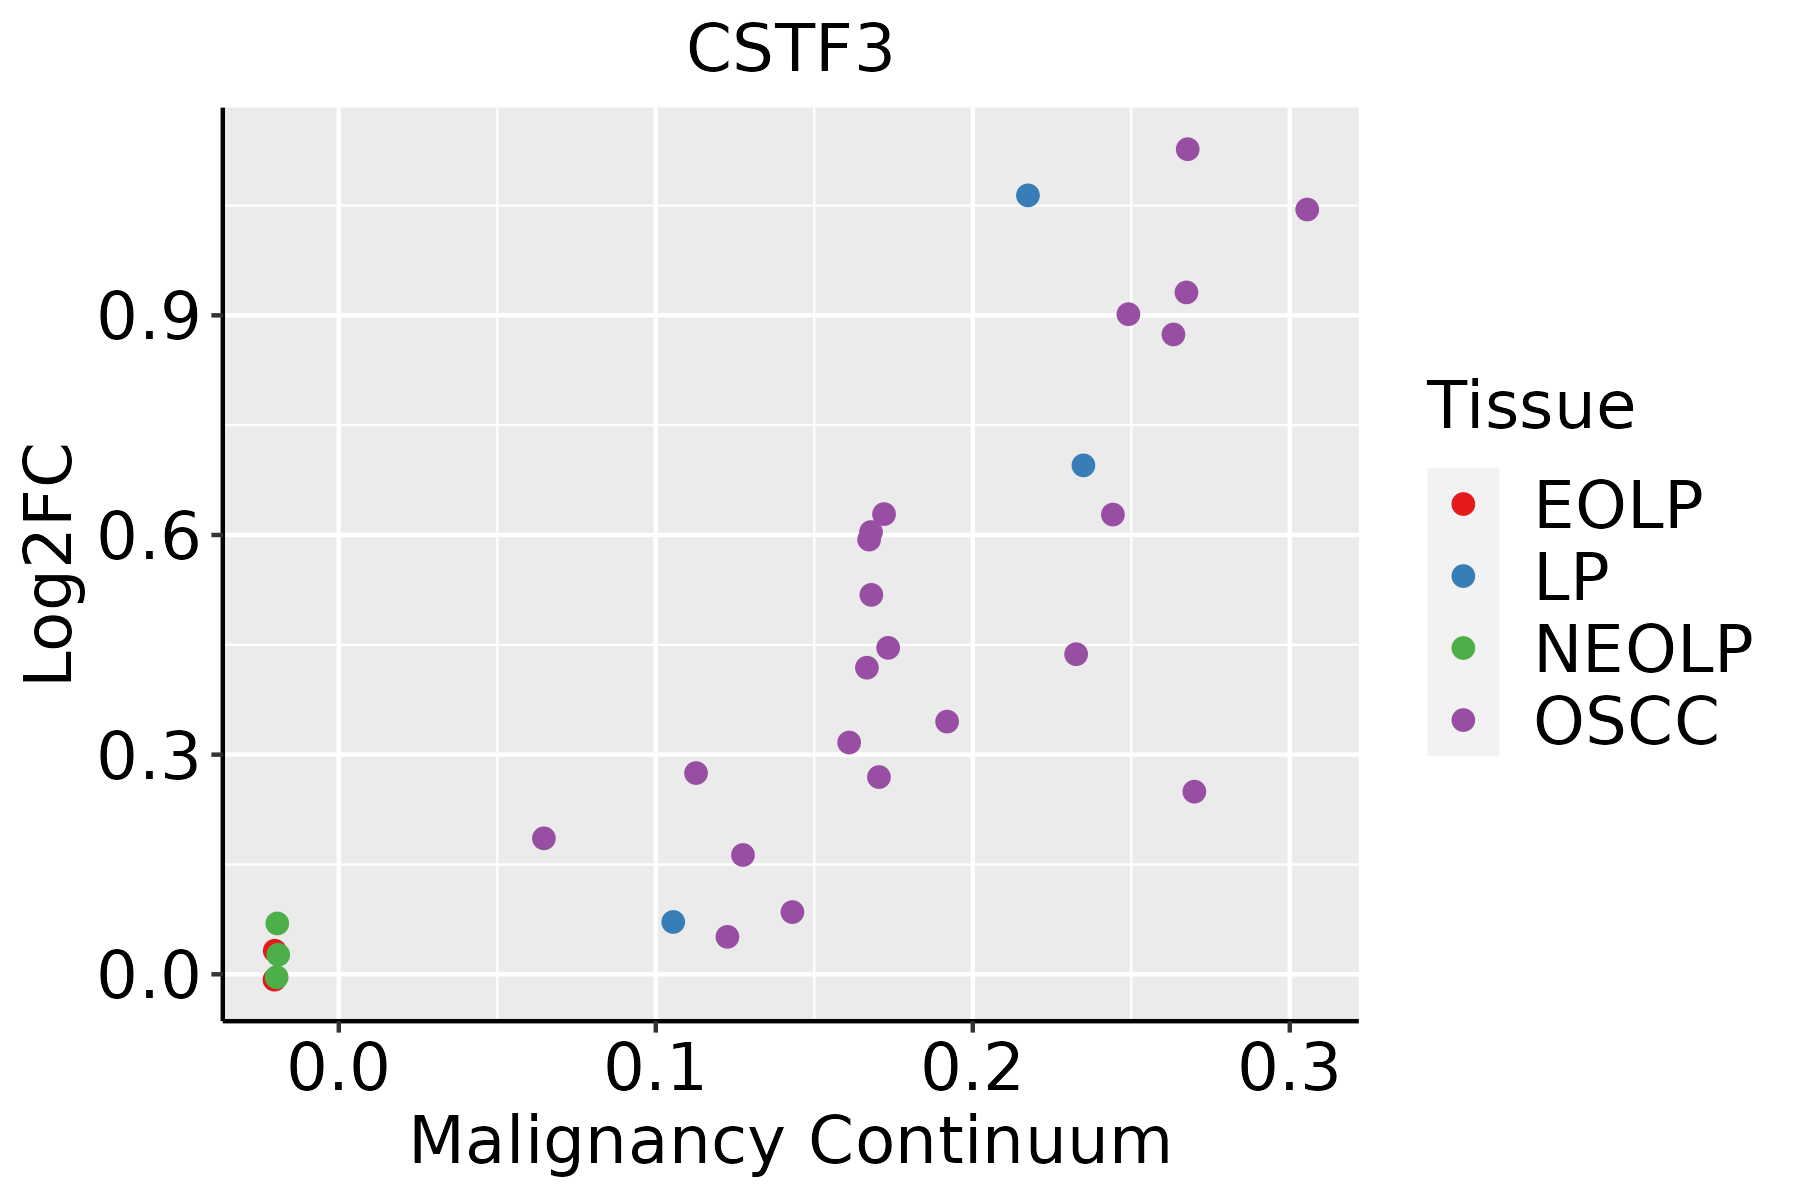 | EOLP: Erosive Oral lichen planus |
| LP: leukoplakia | ||
| NEOLP: Non-erosive oral lichen planus | ||
| OSCC: Oral squamous cell carcinoma | ||
| Skin |  | AK: Actinic keratosis |
| cSCC: Cutaneous squamous cell carcinoma | ||
| SCCIS:squamous cell carcinoma in situ | ||
| Thyroid | 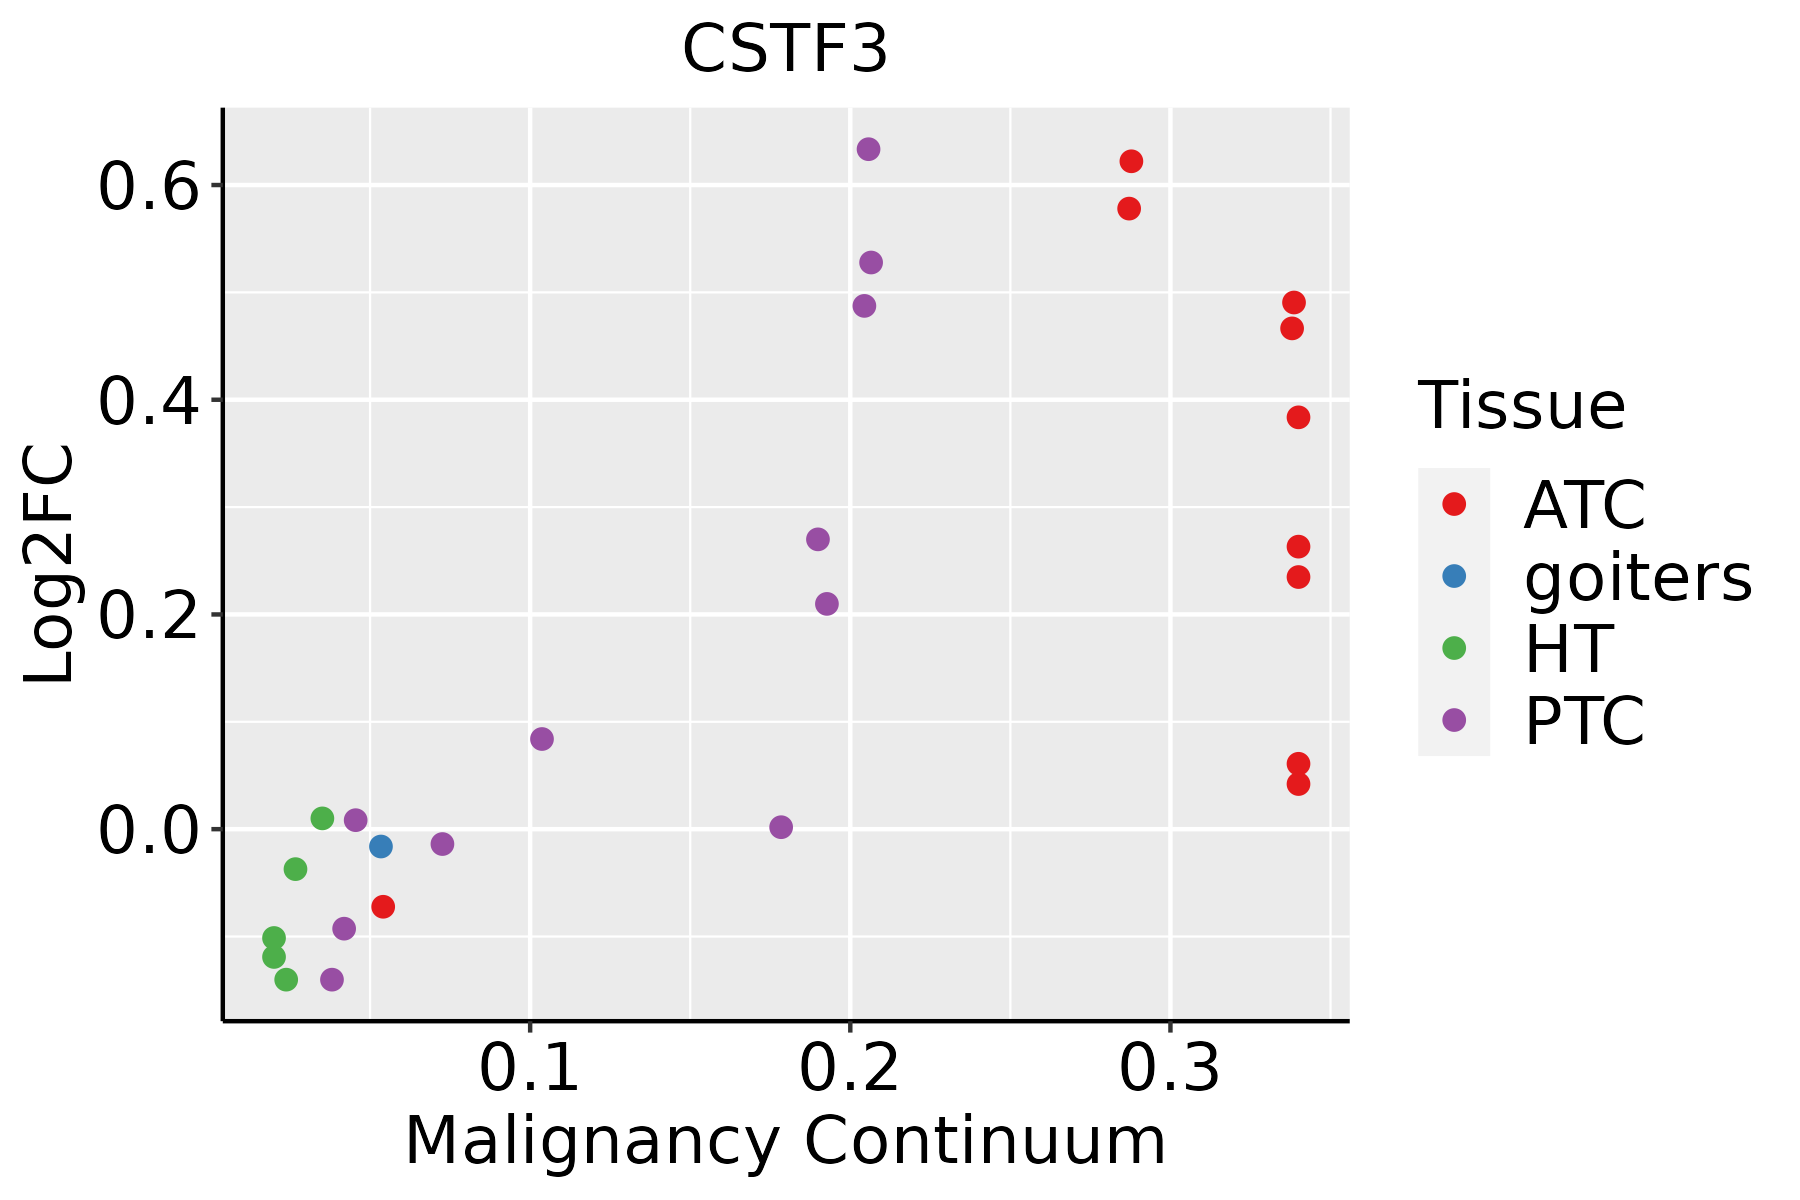 | ATC: Anaplastic thyroid cancer |
| HT: Hashimoto's thyroiditis | ||
| PTC: Papillary thyroid cancer |
| ∗log2FC in expression of this searched gene in stem-like cells from each diseased tissue sample relative to stem-like cells in normal samples in each tissue plotted against the malignancy continuum. Samples are colored based on if they are from different disease stage. |
Top |
Malignant transformation related pathway analysis |
| Find out the enriched GO biological processes and KEGG pathways involved in transition from healthy to precancer to cancer |
| Tissue | Disease Stage | Enriched GO biological Processes |
| Colorectum | AD |  |
| Colorectum | SER |  |
| Colorectum | MSS |  |
| Colorectum | MSI-H |  |
| Colorectum | FAP |  |
| ∗Top 15 enriched GO BP terms are showed in the bar plot of each disease state in each tissue. Each row represents a significant GO biological process which is colored according to the -log10(p.adjust). |
| Page: 1 2 3 4 5 6 7 8 9 |
| GO ID | Tissue | Disease Stage | Description | Gene Ratio | Bg Ratio | pvalue | p.adjust | Count |
| GO:0090501 | Liver | Cirrhotic | RNA phosphodiester bond hydrolysis | 54/4634 | 152/18723 | 1.89e-03 | 1.19e-02 | 54 |
| GO:0031123 | Liver | Cirrhotic | RNA 3'-end processing | 42/4634 | 116/18723 | 3.85e-03 | 2.10e-02 | 42 |
| GO:0031124 | Liver | Cirrhotic | mRNA 3'-end processing | 25/4634 | 62/18723 | 4.90e-03 | 2.56e-02 | 25 |
| GO:00311241 | Liver | HCC | mRNA 3'-end processing | 50/7958 | 62/18723 | 8.44e-10 | 2.60e-08 | 50 |
| GO:00905011 | Liver | HCC | RNA phosphodiester bond hydrolysis | 101/7958 | 152/18723 | 1.99e-09 | 5.63e-08 | 101 |
| GO:00311231 | Liver | HCC | RNA 3'-end processing | 81/7958 | 116/18723 | 2.27e-09 | 6.32e-08 | 81 |
| GO:0090305 | Liver | HCC | nucleic acid phosphodiester bond hydrolysis | 152/7958 | 261/18723 | 1.90e-07 | 3.46e-06 | 152 |
| GO:0006378 | Liver | HCC | mRNA polyadenylation | 35/7958 | 44/18723 | 5.70e-07 | 9.03e-06 | 35 |
| GO:0043631 | Liver | HCC | RNA polyadenylation | 35/7958 | 45/18723 | 1.51e-06 | 2.15e-05 | 35 |
| GO:0006379 | Liver | HCC | mRNA cleavage | 17/7958 | 22/18723 | 9.84e-04 | 5.70e-03 | 17 |
| GO:00311242 | Oral cavity | OSCC | mRNA 3'-end processing | 49/7305 | 62/18723 | 1.40e-10 | 4.14e-09 | 49 |
| GO:00905012 | Oral cavity | OSCC | RNA phosphodiester bond hydrolysis | 95/7305 | 152/18723 | 3.65e-09 | 8.22e-08 | 95 |
| GO:00311232 | Oral cavity | OSCC | RNA 3'-end processing | 75/7305 | 116/18723 | 1.93e-08 | 3.79e-07 | 75 |
| GO:00063782 | Oral cavity | OSCC | mRNA polyadenylation | 34/7305 | 44/18723 | 2.63e-07 | 4.10e-06 | 34 |
| GO:00903052 | Oral cavity | OSCC | nucleic acid phosphodiester bond hydrolysis | 142/7305 | 261/18723 | 2.90e-07 | 4.43e-06 | 142 |
| GO:00436312 | Oral cavity | OSCC | RNA polyadenylation | 34/7305 | 45/18723 | 6.73e-07 | 9.53e-06 | 34 |
| GO:00063792 | Oral cavity | OSCC | mRNA cleavage | 18/7305 | 22/18723 | 5.05e-05 | 4.23e-04 | 18 |
| GO:009050111 | Oral cavity | LP | RNA phosphodiester bond hydrolysis | 63/4623 | 152/18723 | 3.88e-06 | 8.13e-05 | 63 |
| GO:003112311 | Oral cavity | LP | RNA 3'-end processing | 48/4623 | 116/18723 | 5.51e-05 | 7.58e-04 | 48 |
| GO:00903051 | Oral cavity | LP | nucleic acid phosphodiester bond hydrolysis | 92/4623 | 261/18723 | 8.07e-05 | 1.04e-03 | 92 |
| Page: 1 2 3 |
| Pathway ID | Tissue | Disease Stage | Description | Gene Ratio | Bg Ratio | pvalue | p.adjust | qvalue | Count |
| hsa030154 | Liver | Cirrhotic | mRNA surveillance pathway | 46/2530 | 97/8465 | 1.92e-04 | 1.30e-03 | 8.03e-04 | 46 |
| hsa0301511 | Liver | Cirrhotic | mRNA surveillance pathway | 46/2530 | 97/8465 | 1.92e-04 | 1.30e-03 | 8.03e-04 | 46 |
| hsa0301521 | Liver | HCC | mRNA surveillance pathway | 66/4020 | 97/8465 | 3.16e-05 | 1.88e-04 | 1.04e-04 | 66 |
| hsa0301531 | Liver | HCC | mRNA surveillance pathway | 66/4020 | 97/8465 | 3.16e-05 | 1.88e-04 | 1.04e-04 | 66 |
| hsa030158 | Oral cavity | OSCC | mRNA surveillance pathway | 75/3704 | 97/8465 | 1.30e-11 | 2.01e-10 | 1.02e-10 | 75 |
| hsa0301513 | Oral cavity | OSCC | mRNA surveillance pathway | 75/3704 | 97/8465 | 1.30e-11 | 2.01e-10 | 1.02e-10 | 75 |
| hsa0301523 | Oral cavity | LP | mRNA surveillance pathway | 50/2418 | 97/8465 | 1.39e-06 | 1.50e-05 | 9.66e-06 | 50 |
| hsa0301533 | Oral cavity | LP | mRNA surveillance pathway | 50/2418 | 97/8465 | 1.39e-06 | 1.50e-05 | 9.66e-06 | 50 |
| Page: 1 |
Top |
Cell-cell communication analysis |
| Identification of potential cell-cell interactions between two cell types and their ligand-receptor pairs for different disease states |
| Ligand | Receptor | LRpair | Pathway | Tissue | Disease Stage |
| Page: 1 |
Top |
Single-cell gene regulatory network inference analysis |
| Find out the significant the regulons (TFs) and the target genes of each regulon across cell types for different disease states |
| TF | Cell Type | Tissue | Disease Stage | Target Gene | RSS | Regulon Activity |
| ∗The dot plots of a searched regulon are shown for all cell subpopulations in each disease state of each tissue based on the regulon specific score inferred using pySCENIC and by calculating the average expression. |
| Page: 1 |
Top |
Somatic mutation of malignant transformation related genes |
| Annotation of somatic variants for genes involved in malignant transformation |
| Hugo Symbol | Variant Class | Variant Classification | dbSNP RS | HGVSc | HGVSp | HGVSp Short | SWISSPROT | BIOTYPE | SIFT | PolyPhen | Tumor Sample Barcode | Tissue | Histology | Sex | Age | Stage | Therapy Types | Drugs | Outcome |
| CSTF3 | SNV | Missense_Mutation | c.809C>T | p.Thr270Ile | p.T270I | Q12996 | protein_coding | tolerated(0.2) | benign(0.033) | TCGA-AC-A23H-01 | Breast | breast invasive carcinoma | Female | >=65 | I/II | Unknown | Unknown | PD | |
| CSTF3 | SNV | Missense_Mutation | c.2072N>T | p.Ser691Leu | p.S691L | Q12996 | protein_coding | tolerated(0.16) | benign(0.112) | TCGA-AN-A0XN-01 | Breast | breast invasive carcinoma | Female | >=65 | III/IV | Unknown | Unknown | SD | |
| CSTF3 | SNV | Missense_Mutation | rs771844785 | c.1840N>T | p.Pro614Ser | p.P614S | Q12996 | protein_coding | tolerated(0.05) | benign(0.417) | TCGA-BH-A0HP-01 | Breast | breast invasive carcinoma | Female | >=65 | III/IV | Chemotherapy | doxorubicin | SD |
| CSTF3 | SNV | Missense_Mutation | c.317N>T | p.Ser106Leu | p.S106L | Q12996 | protein_coding | tolerated(0.32) | benign(0.046) | TCGA-BH-A1EN-01 | Breast | breast invasive carcinoma | Female | >=65 | I/II | Unknown | Unknown | SD | |
| CSTF3 | SNV | Missense_Mutation | c.1738G>C | p.Glu580Gln | p.E580Q | Q12996 | protein_coding | tolerated(0.4) | benign(0.02) | TCGA-C8-A12K-01 | Breast | breast invasive carcinoma | Female | >=65 | I/II | Unknown | Unknown | SD | |
| CSTF3 | SNV | Missense_Mutation | c.928N>A | p.Glu310Lys | p.E310K | Q12996 | protein_coding | deleterious(0.04) | benign(0.358) | TCGA-C8-A12T-01 | Breast | breast invasive carcinoma | Female | <65 | I/II | Unknown | Unknown | SD | |
| CSTF3 | SNV | Missense_Mutation | novel | c.1735C>A | p.Pro579Thr | p.P579T | Q12996 | protein_coding | tolerated(0.1) | benign(0.082) | TCGA-D8-A1X7-01 | Breast | breast invasive carcinoma | Female | <65 | I/II | ChemotherapyHormone Therapy | doxorubicine+cyclophosphamide+tamoxifen | SD |
| CSTF3 | SNV | Missense_Mutation | c.1652N>A | p.Arg551His | p.R551H | Q12996 | protein_coding | tolerated(0.09) | benign(0.042) | TCGA-D8-A1XK-01 | Breast | breast invasive carcinoma | Female | <65 | I/II | Chemotherapy | doxorubicine+cyclophosphamide | SD | |
| CSTF3 | SNV | Missense_Mutation | novel | c.1414N>C | p.Thr472Pro | p.T472P | Q12996 | protein_coding | deleterious(0.01) | possibly_damaging(0.818) | TCGA-D8-A1XK-01 | Breast | breast invasive carcinoma | Female | <65 | I/II | Chemotherapy | doxorubicine+cyclophosphamide | SD |
| CSTF3 | SNV | Missense_Mutation | c.346C>T | p.Pro116Ser | p.P116S | Q12996 | protein_coding | tolerated(0.29) | benign(0.003) | TCGA-E9-A1NH-01 | Breast | breast invasive carcinoma | Female | >=65 | I/II | Hormone Therapy | tamoxiphen | SD |
| Page: 1 2 3 4 5 6 7 |
Top |
Related drugs of malignant transformation related genes |
| Identification of chemicals and drugs interact with genes involved in malignant transfromation |
| (DGIdb 4.0) |
| Entrez ID | Symbol | Category | Interaction Types | Drug Claim Name | Drug Name | PMIDs |
| Page: 1 |

Copyright 2023-Present -The University of Texas Health Science Center at Houston |