
|
|||||
|
 | |
| |
| |
| |
| |
| |
|
Gene: CSTF2T |
Gene summary for CSTF2T |
| Gene information | Species | Human | Gene symbol | CSTF2T | Gene ID | 23283 |
| Gene name | cleavage stimulation factor subunit 2 tau variant | |
| Gene Alias | CstF-64T | |
| Cytomap | 10q21.1 | |
| Gene Type | protein-coding | GO ID | GO:0006139 | UniProtAcc | Q9H0L4 |
Top |
Malignant transformation analysis |
| Identification of the aberrant gene expression in precancerous and cancerous lesions by comparing the gene expression of stem-like cells in diseased tissues with normal stem cells |
| Entrez ID | Symbol | Replicates | Species | Organ | Tissue | Adj P-value | Log2FC | Malignancy |
| 23283 | CSTF2T | HCC1_Meng | Human | Liver | HCC | 8.19e-13 | -1.93e-02 | 0.0246 |
| 23283 | CSTF2T | HCC2_Meng | Human | Liver | HCC | 2.05e-11 | 4.30e-02 | 0.0107 |
| 23283 | CSTF2T | cirrhotic2 | Human | Liver | Cirrhotic | 1.39e-02 | 9.54e-02 | 0.0201 |
| 23283 | CSTF2T | S014 | Human | Liver | HCC | 2.86e-23 | 7.96e-01 | 0.2254 |
| 23283 | CSTF2T | S015 | Human | Liver | HCC | 2.79e-16 | 8.21e-01 | 0.2375 |
| 23283 | CSTF2T | S016 | Human | Liver | HCC | 9.01e-28 | 8.87e-01 | 0.2243 |
| 23283 | CSTF2T | S028 | Human | Liver | HCC | 3.82e-04 | 2.92e-01 | 0.2503 |
| 23283 | CSTF2T | S029 | Human | Liver | HCC | 1.23e-02 | 2.08e-01 | 0.2581 |
| 23283 | CSTF2T | C04 | Human | Oral cavity | OSCC | 3.08e-03 | 3.20e-01 | 0.2633 |
| 23283 | CSTF2T | C21 | Human | Oral cavity | OSCC | 3.63e-09 | 3.94e-01 | 0.2678 |
| 23283 | CSTF2T | C30 | Human | Oral cavity | OSCC | 2.56e-11 | 6.76e-01 | 0.3055 |
| 23283 | CSTF2T | C38 | Human | Oral cavity | OSCC | 2.90e-03 | 5.85e-01 | 0.172 |
| 23283 | CSTF2T | C46 | Human | Oral cavity | OSCC | 3.15e-06 | 2.75e-01 | 0.1673 |
| 23283 | CSTF2T | C08 | Human | Oral cavity | OSCC | 8.75e-16 | 2.83e-01 | 0.1919 |
| 23283 | CSTF2T | SYSMH1 | Human | Oral cavity | OSCC | 1.15e-03 | 7.18e-02 | 0.1127 |
| 23283 | CSTF2T | SYSMH2 | Human | Oral cavity | OSCC | 5.41e-09 | 1.54e-01 | 0.2326 |
| 23283 | CSTF2T | SYSMH3 | Human | Oral cavity | OSCC | 1.37e-10 | 2.01e-01 | 0.2442 |
| 23283 | CSTF2T | SYSMH6 | Human | Oral cavity | OSCC | 6.39e-05 | 6.53e-02 | 0.1275 |
| Page: 1 |
| Tissue | Expression Dynamics | Abbreviation |
| Liver | 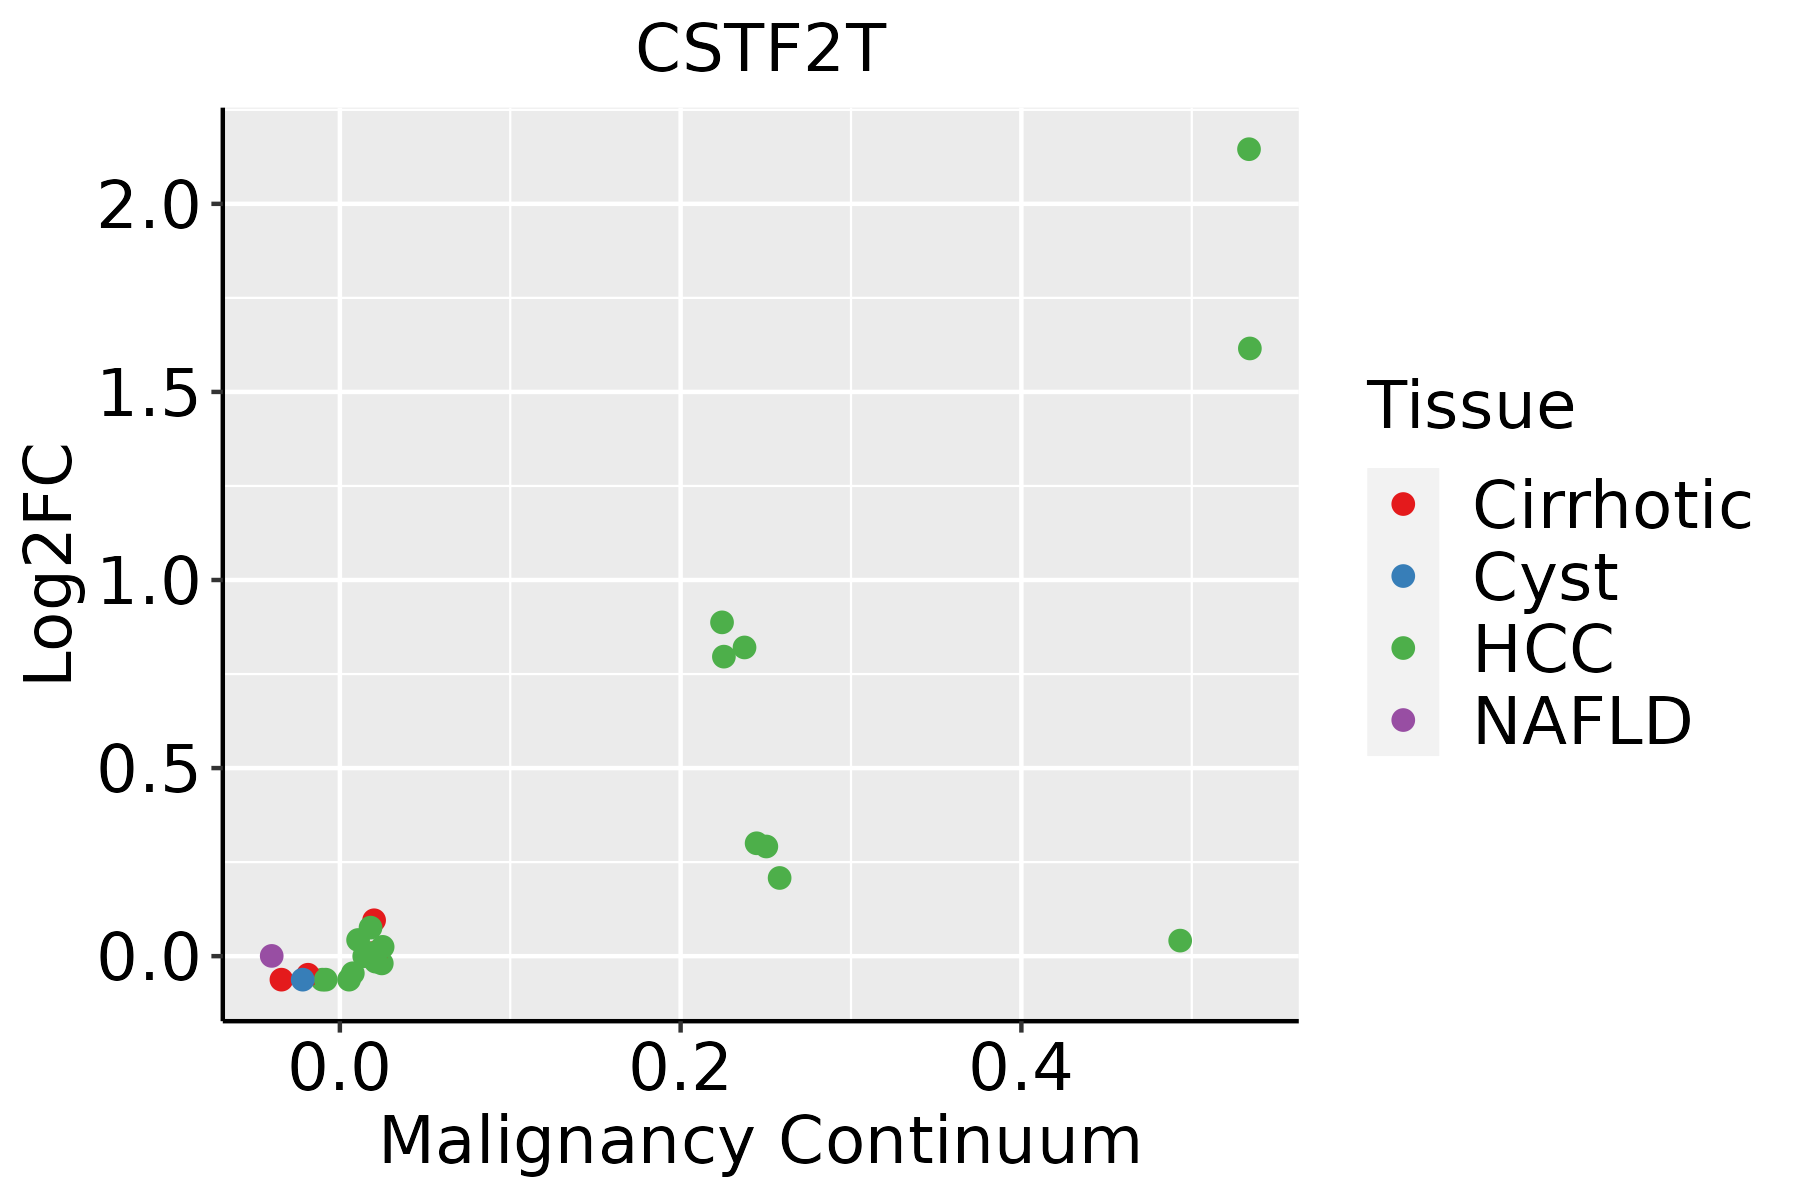 | HCC: Hepatocellular carcinoma |
| NAFLD: Non-alcoholic fatty liver disease | ||
| Oral Cavity | 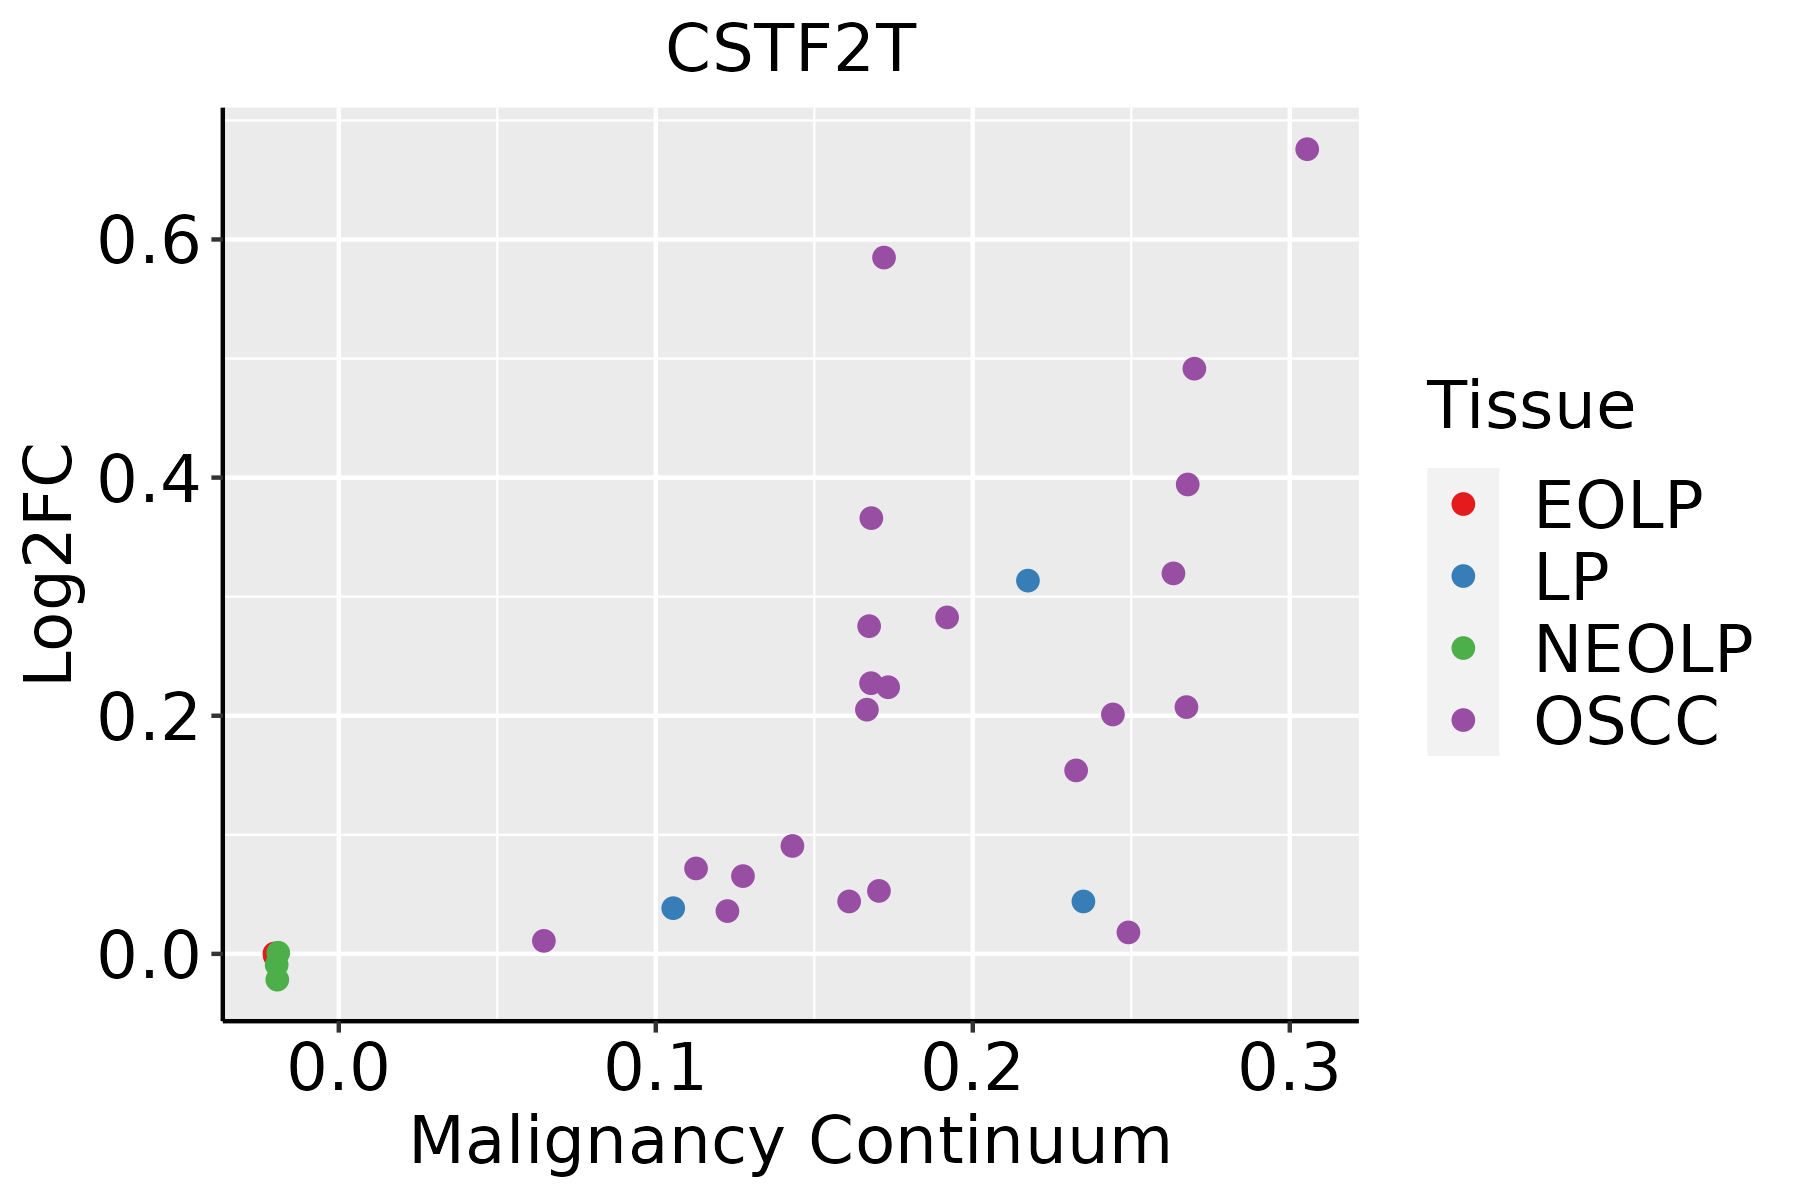 | EOLP: Erosive Oral lichen planus |
| LP: leukoplakia | ||
| NEOLP: Non-erosive oral lichen planus | ||
| OSCC: Oral squamous cell carcinoma |
| ∗log2FC in expression of this searched gene in stem-like cells from each diseased tissue sample relative to stem-like cells in normal samples in each tissue plotted against the malignancy continuum. Samples are colored based on if they are from different disease stage. |
Top |
Malignant transformation related pathway analysis |
| Find out the enriched GO biological processes and KEGG pathways involved in transition from healthy to precancer to cancer |
| Tissue | Disease Stage | Enriched GO biological Processes |
| Colorectum | AD |  |
| Colorectum | SER |  |
| Colorectum | MSS |  |
| Colorectum | MSI-H |  |
| Colorectum | FAP |  |
| ∗Top 15 enriched GO BP terms are showed in the bar plot of each disease state in each tissue. Each row represents a significant GO biological process which is colored according to the -log10(p.adjust). |
| Page: 1 2 3 4 5 6 7 8 9 |
| GO ID | Tissue | Disease Stage | Description | Gene Ratio | Bg Ratio | pvalue | p.adjust | Count |
| GO:0090501 | Liver | Cirrhotic | RNA phosphodiester bond hydrolysis | 54/4634 | 152/18723 | 1.89e-03 | 1.19e-02 | 54 |
| GO:0031123 | Liver | Cirrhotic | RNA 3'-end processing | 42/4634 | 116/18723 | 3.85e-03 | 2.10e-02 | 42 |
| GO:0031124 | Liver | Cirrhotic | mRNA 3'-end processing | 25/4634 | 62/18723 | 4.90e-03 | 2.56e-02 | 25 |
| GO:00311241 | Liver | HCC | mRNA 3'-end processing | 50/7958 | 62/18723 | 8.44e-10 | 2.60e-08 | 50 |
| GO:00905011 | Liver | HCC | RNA phosphodiester bond hydrolysis | 101/7958 | 152/18723 | 1.99e-09 | 5.63e-08 | 101 |
| GO:00311231 | Liver | HCC | RNA 3'-end processing | 81/7958 | 116/18723 | 2.27e-09 | 6.32e-08 | 81 |
| GO:0090305 | Liver | HCC | nucleic acid phosphodiester bond hydrolysis | 152/7958 | 261/18723 | 1.90e-07 | 3.46e-06 | 152 |
| GO:0006379 | Liver | HCC | mRNA cleavage | 17/7958 | 22/18723 | 9.84e-04 | 5.70e-03 | 17 |
| GO:0098789 | Liver | HCC | pre-mRNA cleavage required for polyadenylation | 11/7958 | 13/18723 | 2.38e-03 | 1.16e-02 | 11 |
| GO:0098787 | Liver | HCC | mRNA cleavage involved in mRNA processing | 11/7958 | 14/18723 | 6.81e-03 | 2.73e-02 | 11 |
| GO:00311242 | Oral cavity | OSCC | mRNA 3'-end processing | 49/7305 | 62/18723 | 1.40e-10 | 4.14e-09 | 49 |
| GO:00905012 | Oral cavity | OSCC | RNA phosphodiester bond hydrolysis | 95/7305 | 152/18723 | 3.65e-09 | 8.22e-08 | 95 |
| GO:00311232 | Oral cavity | OSCC | RNA 3'-end processing | 75/7305 | 116/18723 | 1.93e-08 | 3.79e-07 | 75 |
| GO:00903052 | Oral cavity | OSCC | nucleic acid phosphodiester bond hydrolysis | 142/7305 | 261/18723 | 2.90e-07 | 4.43e-06 | 142 |
| GO:00063792 | Oral cavity | OSCC | mRNA cleavage | 18/7305 | 22/18723 | 5.05e-05 | 4.23e-04 | 18 |
| GO:00987871 | Oral cavity | OSCC | mRNA cleavage involved in mRNA processing | 12/7305 | 14/18723 | 4.62e-04 | 2.76e-03 | 12 |
| GO:00987892 | Oral cavity | OSCC | pre-mRNA cleavage required for polyadenylation | 11/7305 | 13/18723 | 1.02e-03 | 5.29e-03 | 11 |
| Page: 1 |
| Pathway ID | Tissue | Disease Stage | Description | Gene Ratio | Bg Ratio | pvalue | p.adjust | qvalue | Count |
| hsa030154 | Liver | Cirrhotic | mRNA surveillance pathway | 46/2530 | 97/8465 | 1.92e-04 | 1.30e-03 | 8.03e-04 | 46 |
| hsa0301511 | Liver | Cirrhotic | mRNA surveillance pathway | 46/2530 | 97/8465 | 1.92e-04 | 1.30e-03 | 8.03e-04 | 46 |
| hsa0301521 | Liver | HCC | mRNA surveillance pathway | 66/4020 | 97/8465 | 3.16e-05 | 1.88e-04 | 1.04e-04 | 66 |
| hsa0301531 | Liver | HCC | mRNA surveillance pathway | 66/4020 | 97/8465 | 3.16e-05 | 1.88e-04 | 1.04e-04 | 66 |
| hsa030158 | Oral cavity | OSCC | mRNA surveillance pathway | 75/3704 | 97/8465 | 1.30e-11 | 2.01e-10 | 1.02e-10 | 75 |
| hsa0301513 | Oral cavity | OSCC | mRNA surveillance pathway | 75/3704 | 97/8465 | 1.30e-11 | 2.01e-10 | 1.02e-10 | 75 |
| Page: 1 |
Top |
Cell-cell communication analysis |
| Identification of potential cell-cell interactions between two cell types and their ligand-receptor pairs for different disease states |
| Ligand | Receptor | LRpair | Pathway | Tissue | Disease Stage |
| Page: 1 |
Top |
Single-cell gene regulatory network inference analysis |
| Find out the significant the regulons (TFs) and the target genes of each regulon across cell types for different disease states |
| TF | Cell Type | Tissue | Disease Stage | Target Gene | RSS | Regulon Activity |
| ∗The dot plots of a searched regulon are shown for all cell subpopulations in each disease state of each tissue based on the regulon specific score inferred using pySCENIC and by calculating the average expression. |
| Page: 1 |
Top |
Somatic mutation of malignant transformation related genes |
| Annotation of somatic variants for genes involved in malignant transformation |
| Hugo Symbol | Variant Class | Variant Classification | dbSNP RS | HGVSc | HGVSp | HGVSp Short | SWISSPROT | BIOTYPE | SIFT | PolyPhen | Tumor Sample Barcode | Tissue | Histology | Sex | Age | Stage | Therapy Types | Drugs | Outcome |
| CSTF2T | SNV | Missense_Mutation | novel | c.1006N>T | p.Asp336Tyr | p.D336Y | Q9H0L4 | protein_coding | deleterious(0) | probably_damaging(0.999) | TCGA-AN-A046-01 | Breast | breast invasive carcinoma | Female | >=65 | I/II | Unknown | Unknown | SD |
| CSTF2T | SNV | Missense_Mutation | rs750598423 | c.947N>A | p.Arg316His | p.R316H | Q9H0L4 | protein_coding | tolerated(0.25) | benign(0.021) | TCGA-AR-A0U2-01 | Breast | breast invasive carcinoma | Female | <65 | III/IV | Hormone Therapy | tamoxiphen | PD |
| CSTF2T | SNV | Missense_Mutation | c.876N>A | p.Met292Ile | p.M292I | Q9H0L4 | protein_coding | tolerated(0.37) | benign(0.018) | TCGA-BH-A0HF-01 | Breast | breast invasive carcinoma | Female | >=65 | I/II | Hormone Therapy | arimidex | SD | |
| CSTF2T | SNV | Missense_Mutation | c.1417G>A | p.Gly473Ser | p.G473S | Q9H0L4 | protein_coding | tolerated_low_confidence(0.33) | benign(0) | TCGA-BH-A0HK-01 | Breast | breast invasive carcinoma | Female | >=65 | I/II | Hormone Therapy | arimidex | SD | |
| CSTF2T | SNV | Missense_Mutation | novel | c.774C>G | p.Ile258Met | p.I258M | Q9H0L4 | protein_coding | tolerated(1) | benign(0.031) | TCGA-LD-A74U-01 | Breast | breast invasive carcinoma | Female | >=65 | III/IV | Chemotherapy | taxotere | SD |
| CSTF2T | insertion | Nonsense_Mutation | novel | c.1605_1606insAAACAGAAAGAAAGAAAAAGAACAAAAAATAAGATTAGGTTCTAGGAGGAGGGATGCAGGGGGCAGGCATACAAGGA | p.Val536LysfsTer15 | p.V536Kfs*15 | Q9H0L4 | protein_coding | TCGA-AR-A0TU-01 | Breast | breast invasive carcinoma | Female | <65 | I/II | Unspecific | Doxorubicin | SD | ||
| CSTF2T | SNV | Missense_Mutation | novel | c.263G>A | p.Arg88Gln | p.R88Q | Q9H0L4 | protein_coding | deleterious(0.02) | probably_damaging(0.993) | TCGA-2W-A8YY-01 | Cervix | cervical & endocervical cancer | Female | <65 | I/II | Chemotherapy | cisplatin | CR |
| CSTF2T | SNV | Missense_Mutation | c.38G>C | p.Arg13Pro | p.R13P | Q9H0L4 | protein_coding | deleterious(0) | probably_damaging(0.951) | TCGA-IR-A3LA-01 | Cervix | cervical & endocervical cancer | Female | <65 | I/II | Chemotherapy | cisplatin | CR | |
| CSTF2T | SNV | Missense_Mutation | novel | c.1532N>T | p.Thr511Ile | p.T511I | Q9H0L4 | protein_coding | tolerated_low_confidence(0.33) | benign(0) | TCGA-AA-3815-01 | Colorectum | colon adenocarcinoma | Female | >=65 | I/II | Unknown | Unknown | SD |
| CSTF2T | SNV | Missense_Mutation | rs772485778 | c.896N>A | p.Pro299His | p.P299H | Q9H0L4 | protein_coding | deleterious(0) | probably_damaging(0.962) | TCGA-AA-3966-01 | Colorectum | colon adenocarcinoma | Female | >=65 | I/II | Unknown | Unknown | SD |
| Page: 1 2 3 4 5 6 7 8 9 |
Top |
Related drugs of malignant transformation related genes |
| Identification of chemicals and drugs interact with genes involved in malignant transfromation |
| (DGIdb 4.0) |
| Entrez ID | Symbol | Category | Interaction Types | Drug Claim Name | Drug Name | PMIDs |
| Page: 1 |

Copyright 2023-Present -The University of Texas Health Science Center at Houston |