
|
|||||
|
 | |
| |
| |
| |
| |
| |
|
Gene: CSTF2 |
Gene summary for CSTF2 |
| Gene information | Species | Human | Gene symbol | CSTF2 | Gene ID | 1478 |
| Gene name | cleavage stimulation factor subunit 2 | |
| Gene Alias | CstF-64 | |
| Cytomap | Xq22.1 | |
| Gene Type | protein-coding | GO ID | GO:0006139 | UniProtAcc | B3V096 |
Top |
Malignant transformation analysis |
| Identification of the aberrant gene expression in precancerous and cancerous lesions by comparing the gene expression of stem-like cells in diseased tissues with normal stem cells |
| Entrez ID | Symbol | Replicates | Species | Organ | Tissue | Adj P-value | Log2FC | Malignancy |
| 1478 | CSTF2 | LZE4T | Human | Esophagus | ESCC | 1.35e-07 | 1.89e-01 | 0.0811 |
| 1478 | CSTF2 | LZE7T | Human | Esophagus | ESCC | 1.80e-07 | 3.76e-01 | 0.0667 |
| 1478 | CSTF2 | LZE8T | Human | Esophagus | ESCC | 5.77e-04 | 1.88e-01 | 0.067 |
| 1478 | CSTF2 | LZE20T | Human | Esophagus | ESCC | 8.99e-08 | 3.95e-01 | 0.0662 |
| 1478 | CSTF2 | LZE24T | Human | Esophagus | ESCC | 1.87e-11 | 3.31e-01 | 0.0596 |
| 1478 | CSTF2 | LZE6T | Human | Esophagus | ESCC | 4.54e-03 | 2.12e-01 | 0.0845 |
| 1478 | CSTF2 | P1T-E | Human | Esophagus | ESCC | 7.19e-10 | 5.02e-01 | 0.0875 |
| 1478 | CSTF2 | P2T-E | Human | Esophagus | ESCC | 1.69e-27 | 4.55e-01 | 0.1177 |
| 1478 | CSTF2 | P4T-E | Human | Esophagus | ESCC | 3.00e-14 | 4.03e-01 | 0.1323 |
| 1478 | CSTF2 | P5T-E | Human | Esophagus | ESCC | 2.33e-15 | 3.05e-01 | 0.1327 |
| 1478 | CSTF2 | P8T-E | Human | Esophagus | ESCC | 1.36e-27 | 3.79e-01 | 0.0889 |
| 1478 | CSTF2 | P9T-E | Human | Esophagus | ESCC | 1.09e-11 | 3.21e-01 | 0.1131 |
| 1478 | CSTF2 | P10T-E | Human | Esophagus | ESCC | 6.00e-16 | 2.25e-01 | 0.116 |
| 1478 | CSTF2 | P11T-E | Human | Esophagus | ESCC | 4.46e-05 | 2.57e-01 | 0.1426 |
| 1478 | CSTF2 | P12T-E | Human | Esophagus | ESCC | 1.65e-12 | 2.02e-01 | 0.1122 |
| 1478 | CSTF2 | P15T-E | Human | Esophagus | ESCC | 9.77e-11 | 2.71e-01 | 0.1149 |
| 1478 | CSTF2 | P16T-E | Human | Esophagus | ESCC | 2.26e-20 | 2.07e-01 | 0.1153 |
| 1478 | CSTF2 | P17T-E | Human | Esophagus | ESCC | 4.11e-08 | 3.06e-01 | 0.1278 |
| 1478 | CSTF2 | P19T-E | Human | Esophagus | ESCC | 1.28e-02 | 3.22e-01 | 0.1662 |
| 1478 | CSTF2 | P20T-E | Human | Esophagus | ESCC | 3.91e-06 | 2.03e-01 | 0.1124 |
| Page: 1 2 3 4 5 |
| Tissue | Expression Dynamics | Abbreviation |
| Esophagus | 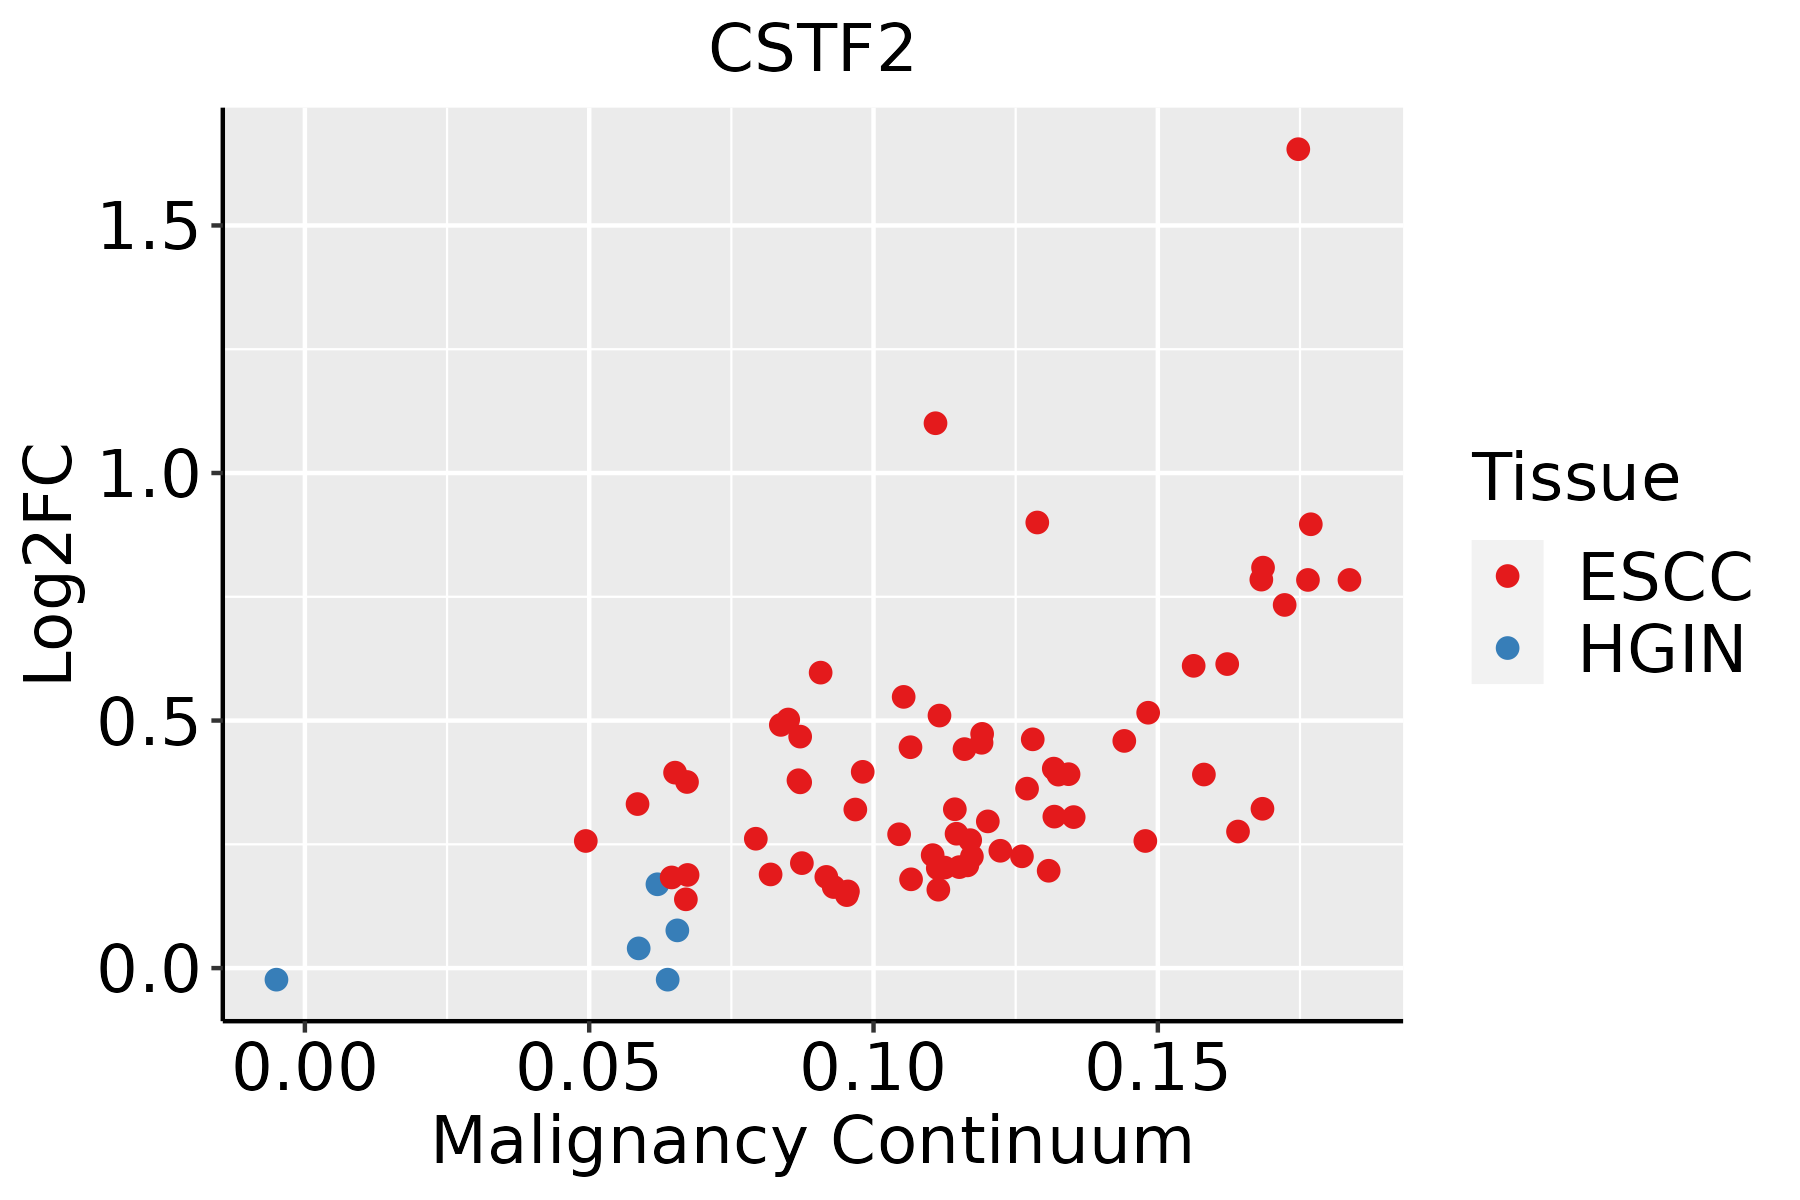 | ESCC: Esophageal squamous cell carcinoma |
| HGIN: High-grade intraepithelial neoplasias | ||
| LGIN: Low-grade intraepithelial neoplasias | ||
| Liver | 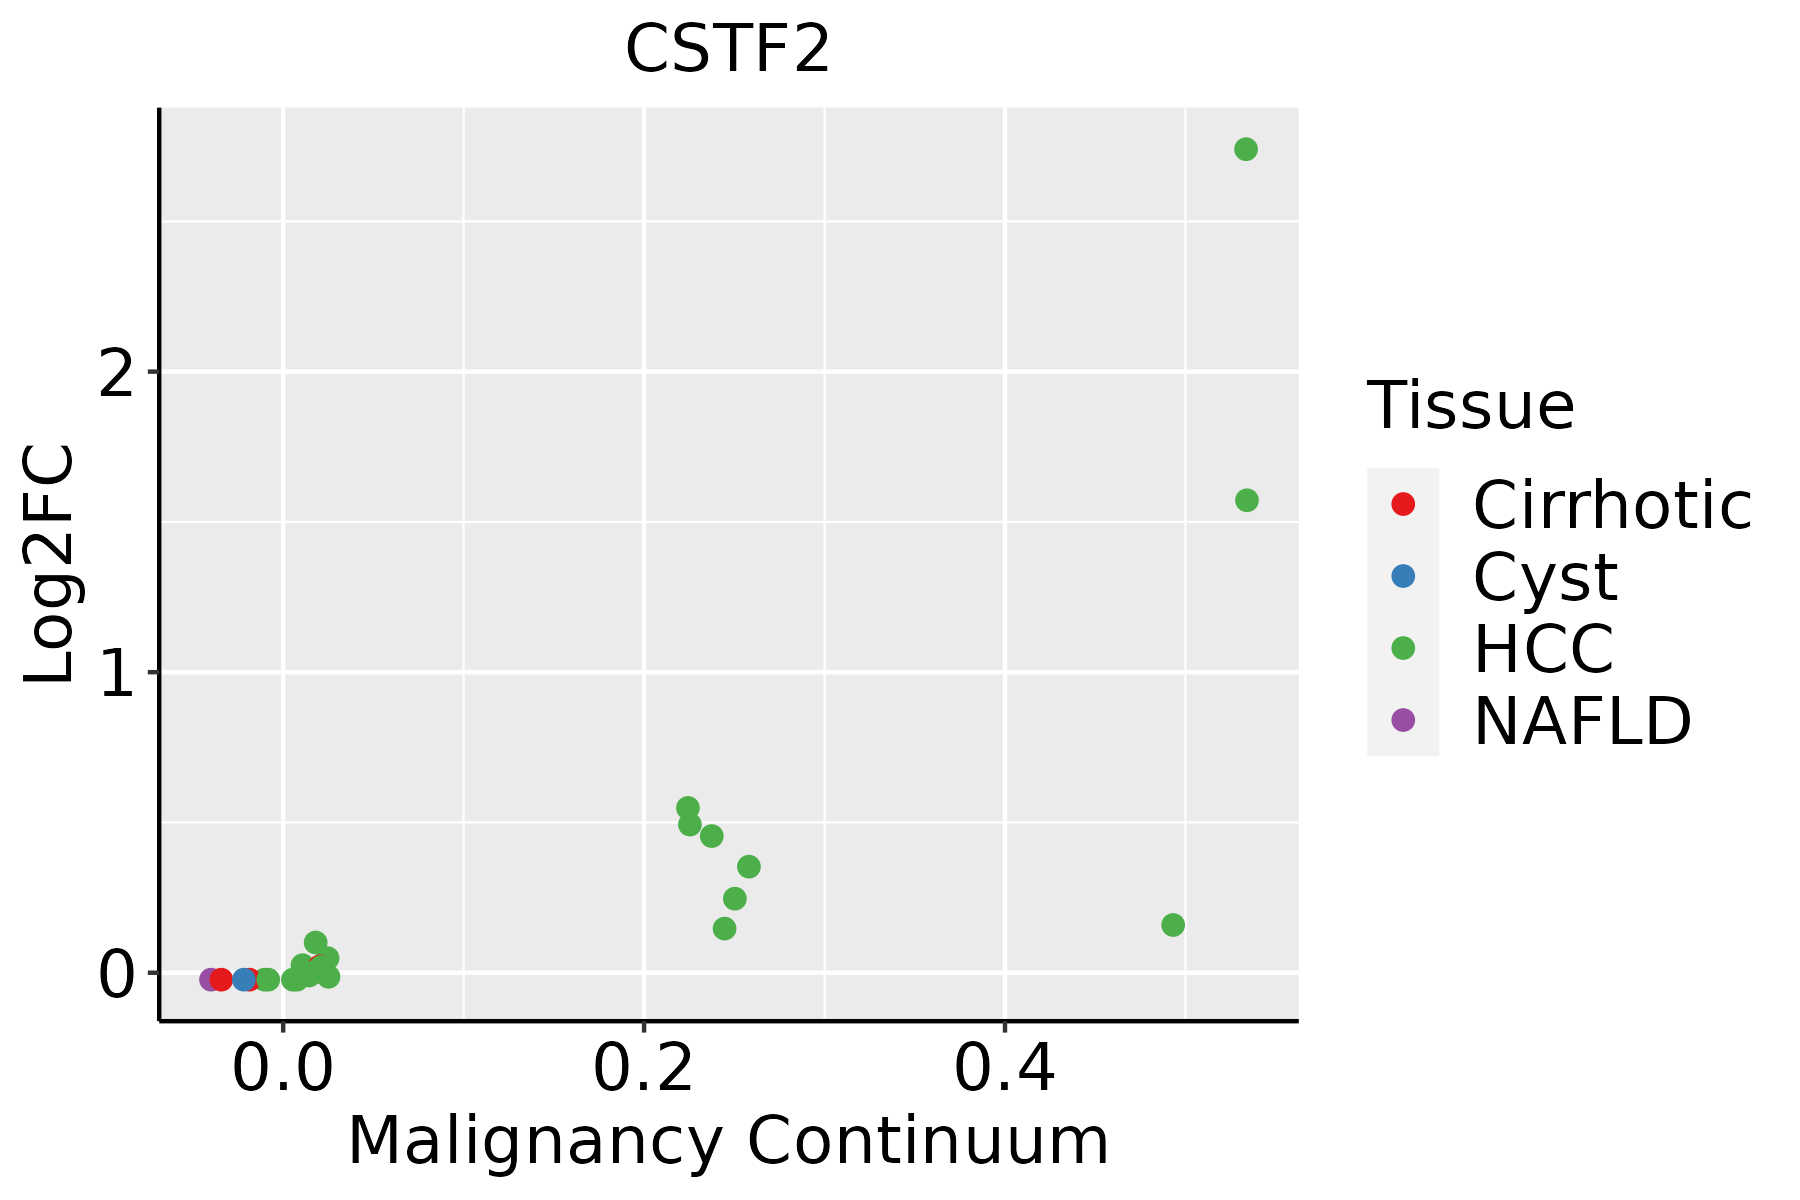 | HCC: Hepatocellular carcinoma |
| NAFLD: Non-alcoholic fatty liver disease | ||
| Oral Cavity | 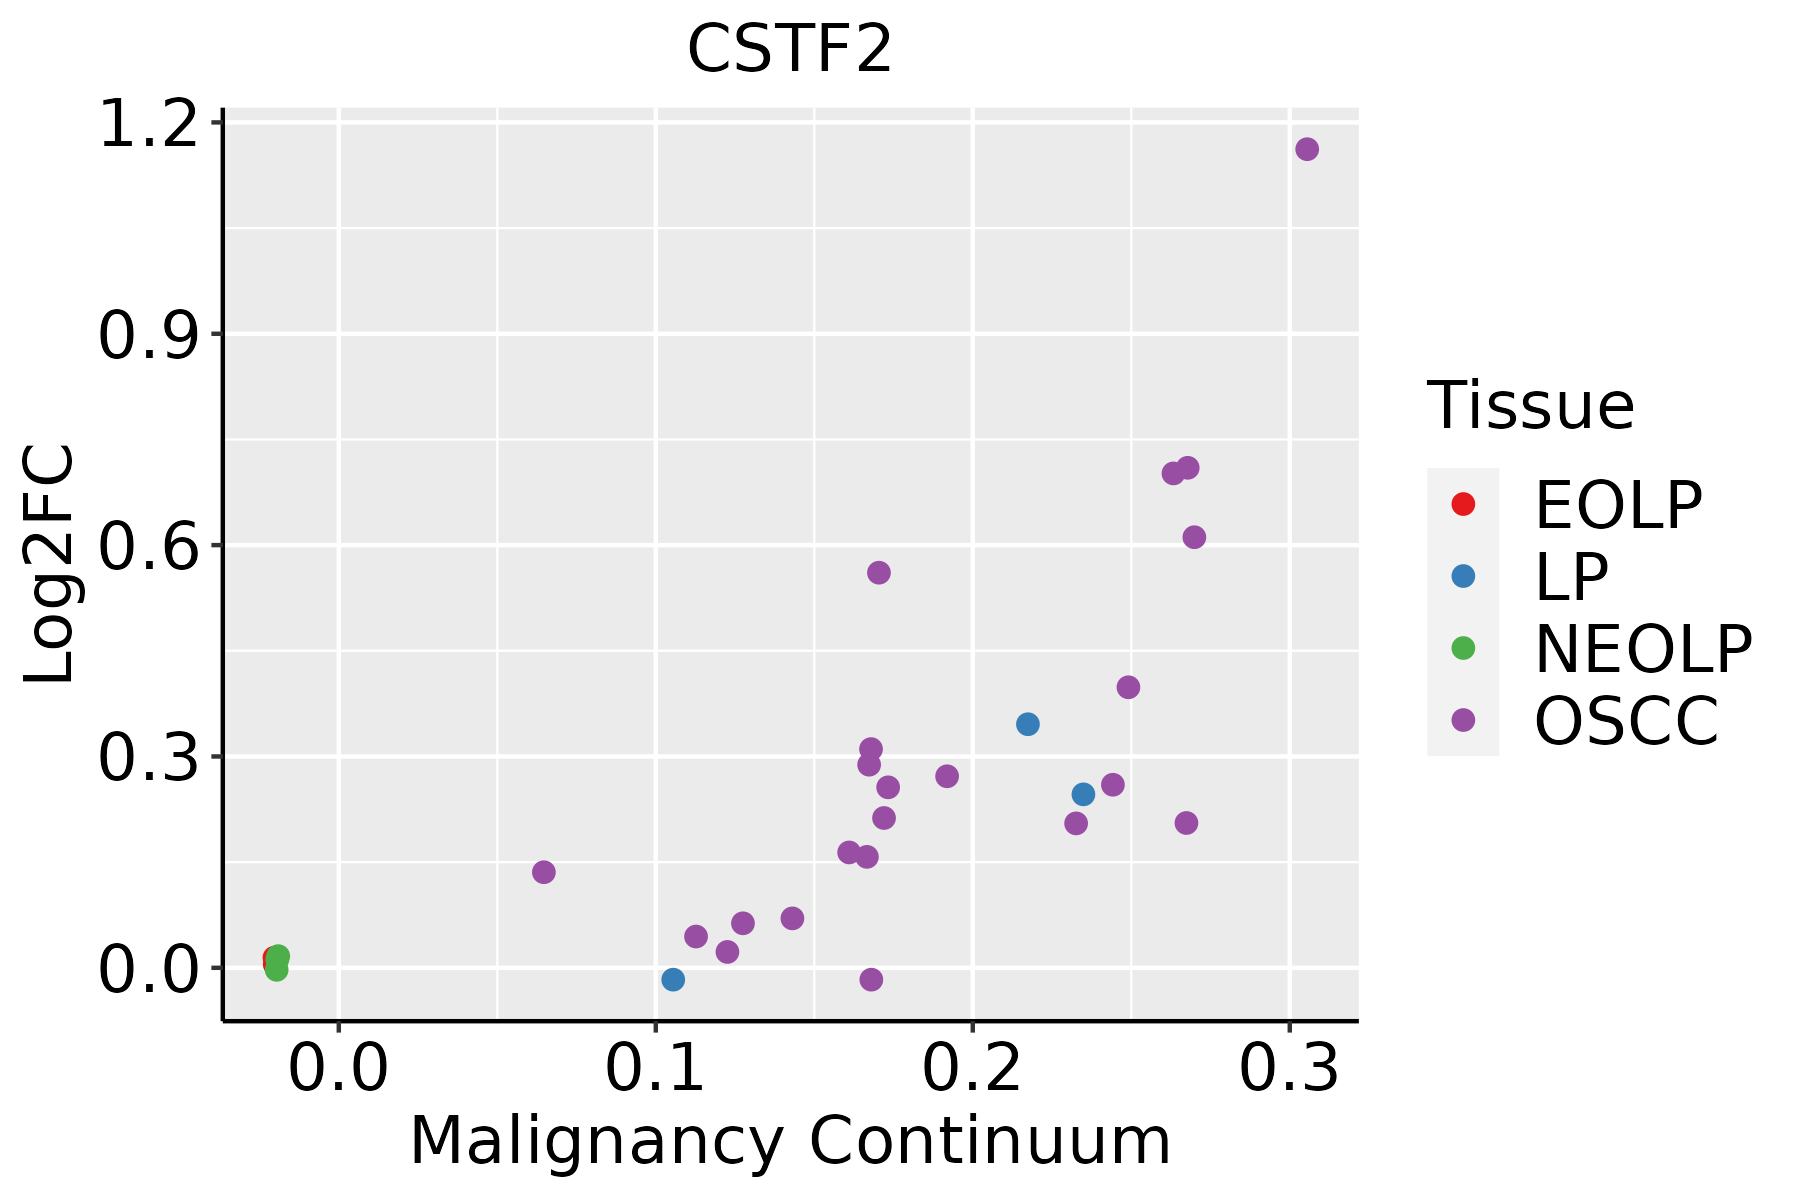 | EOLP: Erosive Oral lichen planus |
| LP: leukoplakia | ||
| NEOLP: Non-erosive oral lichen planus | ||
| OSCC: Oral squamous cell carcinoma |
| ∗log2FC in expression of this searched gene in stem-like cells from each diseased tissue sample relative to stem-like cells in normal samples in each tissue plotted against the malignancy continuum. Samples are colored based on if they are from different disease stage. |
Top |
Malignant transformation related pathway analysis |
| Find out the enriched GO biological processes and KEGG pathways involved in transition from healthy to precancer to cancer |
| Tissue | Disease Stage | Enriched GO biological Processes |
| Colorectum | AD |  |
| Colorectum | SER |  |
| Colorectum | MSS |  |
| Colorectum | MSI-H |  |
| Colorectum | FAP |  |
| ∗Top 15 enriched GO BP terms are showed in the bar plot of each disease state in each tissue. Each row represents a significant GO biological process which is colored according to the -log10(p.adjust). |
| Page: 1 2 3 4 5 6 7 8 9 |
| GO ID | Tissue | Disease Stage | Description | Gene Ratio | Bg Ratio | pvalue | p.adjust | Count |
| GO:00905013 | Esophagus | ESCC | RNA phosphodiester bond hydrolysis | 110/8552 | 152/18723 | 1.95e-11 | 6.81e-10 | 110 |
| GO:00903053 | Esophagus | ESCC | nucleic acid phosphodiester bond hydrolysis | 163/8552 | 261/18723 | 3.07e-08 | 5.73e-07 | 163 |
| GO:003112412 | Esophagus | ESCC | mRNA 3'-end processing | 47/8552 | 62/18723 | 1.29e-06 | 1.58e-05 | 47 |
| GO:00311233 | Esophagus | ESCC | RNA 3'-end processing | 76/8552 | 116/18723 | 1.25e-05 | 1.15e-04 | 76 |
| GO:00063783 | Esophagus | ESCC | mRNA polyadenylation | 33/8552 | 44/18723 | 7.30e-05 | 5.49e-04 | 33 |
| GO:199009017 | Esophagus | ESCC | cellular response to nerve growth factor stimulus | 38/8552 | 53/18723 | 1.10e-04 | 7.69e-04 | 38 |
| GO:00436313 | Esophagus | ESCC | RNA polyadenylation | 33/8552 | 45/18723 | 1.54e-04 | 1.02e-03 | 33 |
| GO:199008916 | Esophagus | ESCC | response to nerve growth factor | 39/8552 | 56/18723 | 2.44e-04 | 1.51e-03 | 39 |
| GO:00063793 | Esophagus | ESCC | mRNA cleavage | 17/8552 | 22/18723 | 2.60e-03 | 1.11e-02 | 17 |
| GO:00987872 | Esophagus | ESCC | mRNA cleavage involved in mRNA processing | 11/8552 | 14/18723 | 1.30e-02 | 4.27e-02 | 11 |
| GO:0090501 | Liver | Cirrhotic | RNA phosphodiester bond hydrolysis | 54/4634 | 152/18723 | 1.89e-03 | 1.19e-02 | 54 |
| GO:0031123 | Liver | Cirrhotic | RNA 3'-end processing | 42/4634 | 116/18723 | 3.85e-03 | 2.10e-02 | 42 |
| GO:0031124 | Liver | Cirrhotic | mRNA 3'-end processing | 25/4634 | 62/18723 | 4.90e-03 | 2.56e-02 | 25 |
| GO:00311241 | Liver | HCC | mRNA 3'-end processing | 50/7958 | 62/18723 | 8.44e-10 | 2.60e-08 | 50 |
| GO:00905011 | Liver | HCC | RNA phosphodiester bond hydrolysis | 101/7958 | 152/18723 | 1.99e-09 | 5.63e-08 | 101 |
| GO:00311231 | Liver | HCC | RNA 3'-end processing | 81/7958 | 116/18723 | 2.27e-09 | 6.32e-08 | 81 |
| GO:0090305 | Liver | HCC | nucleic acid phosphodiester bond hydrolysis | 152/7958 | 261/18723 | 1.90e-07 | 3.46e-06 | 152 |
| GO:0006378 | Liver | HCC | mRNA polyadenylation | 35/7958 | 44/18723 | 5.70e-07 | 9.03e-06 | 35 |
| GO:0043631 | Liver | HCC | RNA polyadenylation | 35/7958 | 45/18723 | 1.51e-06 | 2.15e-05 | 35 |
| GO:199009021 | Liver | HCC | cellular response to nerve growth factor stimulus | 36/7958 | 53/18723 | 1.62e-04 | 1.29e-03 | 36 |
| Page: 1 2 3 |
| Pathway ID | Tissue | Disease Stage | Description | Gene Ratio | Bg Ratio | pvalue | p.adjust | qvalue | Count |
| hsa0301524 | Esophagus | ESCC | mRNA surveillance pathway | 72/4205 | 97/8465 | 6.12e-07 | 4.10e-06 | 2.10e-06 | 72 |
| hsa0301534 | Esophagus | ESCC | mRNA surveillance pathway | 72/4205 | 97/8465 | 6.12e-07 | 4.10e-06 | 2.10e-06 | 72 |
| hsa0301521 | Liver | HCC | mRNA surveillance pathway | 66/4020 | 97/8465 | 3.16e-05 | 1.88e-04 | 1.04e-04 | 66 |
| hsa0301531 | Liver | HCC | mRNA surveillance pathway | 66/4020 | 97/8465 | 3.16e-05 | 1.88e-04 | 1.04e-04 | 66 |
| hsa030158 | Oral cavity | OSCC | mRNA surveillance pathway | 75/3704 | 97/8465 | 1.30e-11 | 2.01e-10 | 1.02e-10 | 75 |
| hsa0301513 | Oral cavity | OSCC | mRNA surveillance pathway | 75/3704 | 97/8465 | 1.30e-11 | 2.01e-10 | 1.02e-10 | 75 |
| hsa0301523 | Oral cavity | LP | mRNA surveillance pathway | 50/2418 | 97/8465 | 1.39e-06 | 1.50e-05 | 9.66e-06 | 50 |
| hsa0301533 | Oral cavity | LP | mRNA surveillance pathway | 50/2418 | 97/8465 | 1.39e-06 | 1.50e-05 | 9.66e-06 | 50 |
| Page: 1 |
Top |
Cell-cell communication analysis |
| Identification of potential cell-cell interactions between two cell types and their ligand-receptor pairs for different disease states |
| Ligand | Receptor | LRpair | Pathway | Tissue | Disease Stage |
| Page: 1 |
Top |
Single-cell gene regulatory network inference analysis |
| Find out the significant the regulons (TFs) and the target genes of each regulon across cell types for different disease states |
| TF | Cell Type | Tissue | Disease Stage | Target Gene | RSS | Regulon Activity |
| ∗The dot plots of a searched regulon are shown for all cell subpopulations in each disease state of each tissue based on the regulon specific score inferred using pySCENIC and by calculating the average expression. |
| Page: 1 |
Top |
Somatic mutation of malignant transformation related genes |
| Annotation of somatic variants for genes involved in malignant transformation |
| Hugo Symbol | Variant Class | Variant Classification | dbSNP RS | HGVSc | HGVSp | HGVSp Short | SWISSPROT | BIOTYPE | SIFT | PolyPhen | Tumor Sample Barcode | Tissue | Histology | Sex | Age | Stage | Therapy Types | Drugs | Outcome |
| CSTF2 | SNV | Missense_Mutation | novel | c.1244G>T | p.Arg415Met | p.R415M | protein_coding | deleterious(0) | probably_damaging(0.962) | TCGA-HN-A2NL-01 | Breast | breast invasive carcinoma | Female | <65 | I/II | Chemotherapy | cyclophosphamide | SD | |
| CSTF2 | insertion | In_Frame_Ins | novel | c.1548_1549insTTTCTCAGATTT | p.Gln516_Gly517insPheLeuArgPhe | p.Q516_G517insFLRF | protein_coding | TCGA-A8-A08Z-01 | Breast | breast invasive carcinoma | Female | >=65 | III/IV | Unknown | Unknown | SD | |||
| CSTF2 | SNV | Missense_Mutation | novel | c.119N>T | p.Gly40Val | p.G40V | protein_coding | deleterious(0) | probably_damaging(1) | TCGA-DS-A1OA-01 | Cervix | cervical & endocervical cancer | Female | >=65 | I/II | Chemotherapy | carboplatin | PD | |
| CSTF2 | SNV | Missense_Mutation | novel | c.1448N>A | p.Arg483Lys | p.R483K | protein_coding | deleterious(0.01) | probably_damaging(0.977) | TCGA-EA-A3HU-01 | Cervix | cervical & endocervical cancer | Female | <65 | I/II | Unknown | Unknown | SD | |
| CSTF2 | SNV | Missense_Mutation | rs139392902 | c.1535C>T | p.Ala512Val | p.A512V | protein_coding | deleterious(0.03) | benign(0.006) | TCGA-EA-A410-01 | Cervix | cervical & endocervical cancer | Female | <65 | I/II | Unknown | Unknown | SD | |
| CSTF2 | SNV | Missense_Mutation | c.1157N>T | p.Gly386Val | p.G386V | protein_coding | deleterious(0) | probably_damaging(1) | TCGA-EK-A2R8-01 | Cervix | cervical & endocervical cancer | Female | <65 | I/II | Unknown | Unknown | SD | ||
| CSTF2 | SNV | Missense_Mutation | novel | c.40T>C | p.Ser14Pro | p.S14P | protein_coding | deleterious(0) | probably_damaging(0.949) | TCGA-CA-6717-01 | Colorectum | colon adenocarcinoma | Male | <65 | I/II | Chemotherapy | oxaliplatin | CR | |
| CSTF2 | SNV | Missense_Mutation | novel | c.1691T>C | p.Val564Ala | p.V564A | protein_coding | tolerated(0.07) | probably_damaging(0.996) | TCGA-CA-6717-01 | Colorectum | colon adenocarcinoma | Male | <65 | I/II | Chemotherapy | oxaliplatin | CR | |
| CSTF2 | SNV | Missense_Mutation | c.1406C>T | p.Ala469Val | p.A469V | protein_coding | tolerated_low_confidence(0.48) | benign(0.178) | TCGA-CK-5913-01 | Colorectum | colon adenocarcinoma | Female | <65 | I/II | Unknown | Unknown | SD | ||
| CSTF2 | SNV | Missense_Mutation | rs767318301 | c.1373G>A | p.Arg458His | p.R458H | protein_coding | tolerated_low_confidence(0.09) | probably_damaging(0.996) | TCGA-F4-6570-01 | Colorectum | colon adenocarcinoma | Female | >=65 | I/II | Unknown | Unknown | SD |
| Page: 1 2 3 4 5 6 |
Top |
Related drugs of malignant transformation related genes |
| Identification of chemicals and drugs interact with genes involved in malignant transfromation |
| (DGIdb 4.0) |
| Entrez ID | Symbol | Category | Interaction Types | Drug Claim Name | Drug Name | PMIDs |
| Page: 1 |

Copyright 2023-Present -The University of Texas Health Science Center at Houston |