
|
|||||
|
 | |
| |
| |
| |
| |
| |
|
Gene: CSTF1 |
Gene summary for CSTF1 |
| Gene information | Species | Human | Gene symbol | CSTF1 | Gene ID | 1477 |
| Gene name | cleavage stimulation factor subunit 1 | |
| Gene Alias | CstF-50 | |
| Cytomap | 20q13.2-q13.31 | |
| Gene Type | protein-coding | GO ID | GO:0006139 | UniProtAcc | Q05048 |
Top |
Malignant transformation analysis |
| Identification of the aberrant gene expression in precancerous and cancerous lesions by comparing the gene expression of stem-like cells in diseased tissues with normal stem cells |
| Entrez ID | Symbol | Replicates | Species | Organ | Tissue | Adj P-value | Log2FC | Malignancy |
| 1477 | CSTF1 | GSM4909285 | Human | Breast | IDC | 3.29e-03 | 1.32e-01 | 0.21 |
| 1477 | CSTF1 | GSM4909317 | Human | Breast | IDC | 2.50e-26 | 6.26e-01 | 0.1355 |
| 1477 | CSTF1 | GSM4909318 | Human | Breast | IDC | 5.96e-09 | 8.12e-01 | 0.2031 |
| 1477 | CSTF1 | DCIS2 | Human | Breast | DCIS | 8.35e-16 | 3.27e-02 | 0.0085 |
| 1477 | CSTF1 | LZE4T | Human | Esophagus | ESCC | 1.36e-10 | 2.02e-01 | 0.0811 |
| 1477 | CSTF1 | LZE7T | Human | Esophagus | ESCC | 1.41e-05 | 2.34e-01 | 0.0667 |
| 1477 | CSTF1 | LZE20T | Human | Esophagus | ESCC | 1.39e-07 | 1.26e-01 | 0.0662 |
| 1477 | CSTF1 | LZE24T | Human | Esophagus | ESCC | 2.58e-12 | 2.68e-01 | 0.0596 |
| 1477 | CSTF1 | P1T-E | Human | Esophagus | ESCC | 8.70e-03 | 1.91e-01 | 0.0875 |
| 1477 | CSTF1 | P2T-E | Human | Esophagus | ESCC | 9.82e-17 | 3.44e-01 | 0.1177 |
| 1477 | CSTF1 | P4T-E | Human | Esophagus | ESCC | 2.00e-09 | 1.73e-01 | 0.1323 |
| 1477 | CSTF1 | P5T-E | Human | Esophagus | ESCC | 8.29e-13 | 2.00e-01 | 0.1327 |
| 1477 | CSTF1 | P8T-E | Human | Esophagus | ESCC | 2.18e-06 | 1.17e-01 | 0.0889 |
| 1477 | CSTF1 | P9T-E | Human | Esophagus | ESCC | 1.69e-06 | 9.95e-02 | 0.1131 |
| 1477 | CSTF1 | P10T-E | Human | Esophagus | ESCC | 2.84e-24 | 4.27e-01 | 0.116 |
| 1477 | CSTF1 | P11T-E | Human | Esophagus | ESCC | 4.35e-17 | 3.26e-01 | 0.1426 |
| 1477 | CSTF1 | P12T-E | Human | Esophagus | ESCC | 1.57e-24 | 5.54e-01 | 0.1122 |
| 1477 | CSTF1 | P15T-E | Human | Esophagus | ESCC | 4.68e-22 | 3.80e-01 | 0.1149 |
| 1477 | CSTF1 | P16T-E | Human | Esophagus | ESCC | 6.57e-22 | 3.92e-01 | 0.1153 |
| 1477 | CSTF1 | P17T-E | Human | Esophagus | ESCC | 1.11e-04 | 2.94e-01 | 0.1278 |
| Page: 1 2 3 4 5 |
| Tissue | Expression Dynamics | Abbreviation |
| Breast | 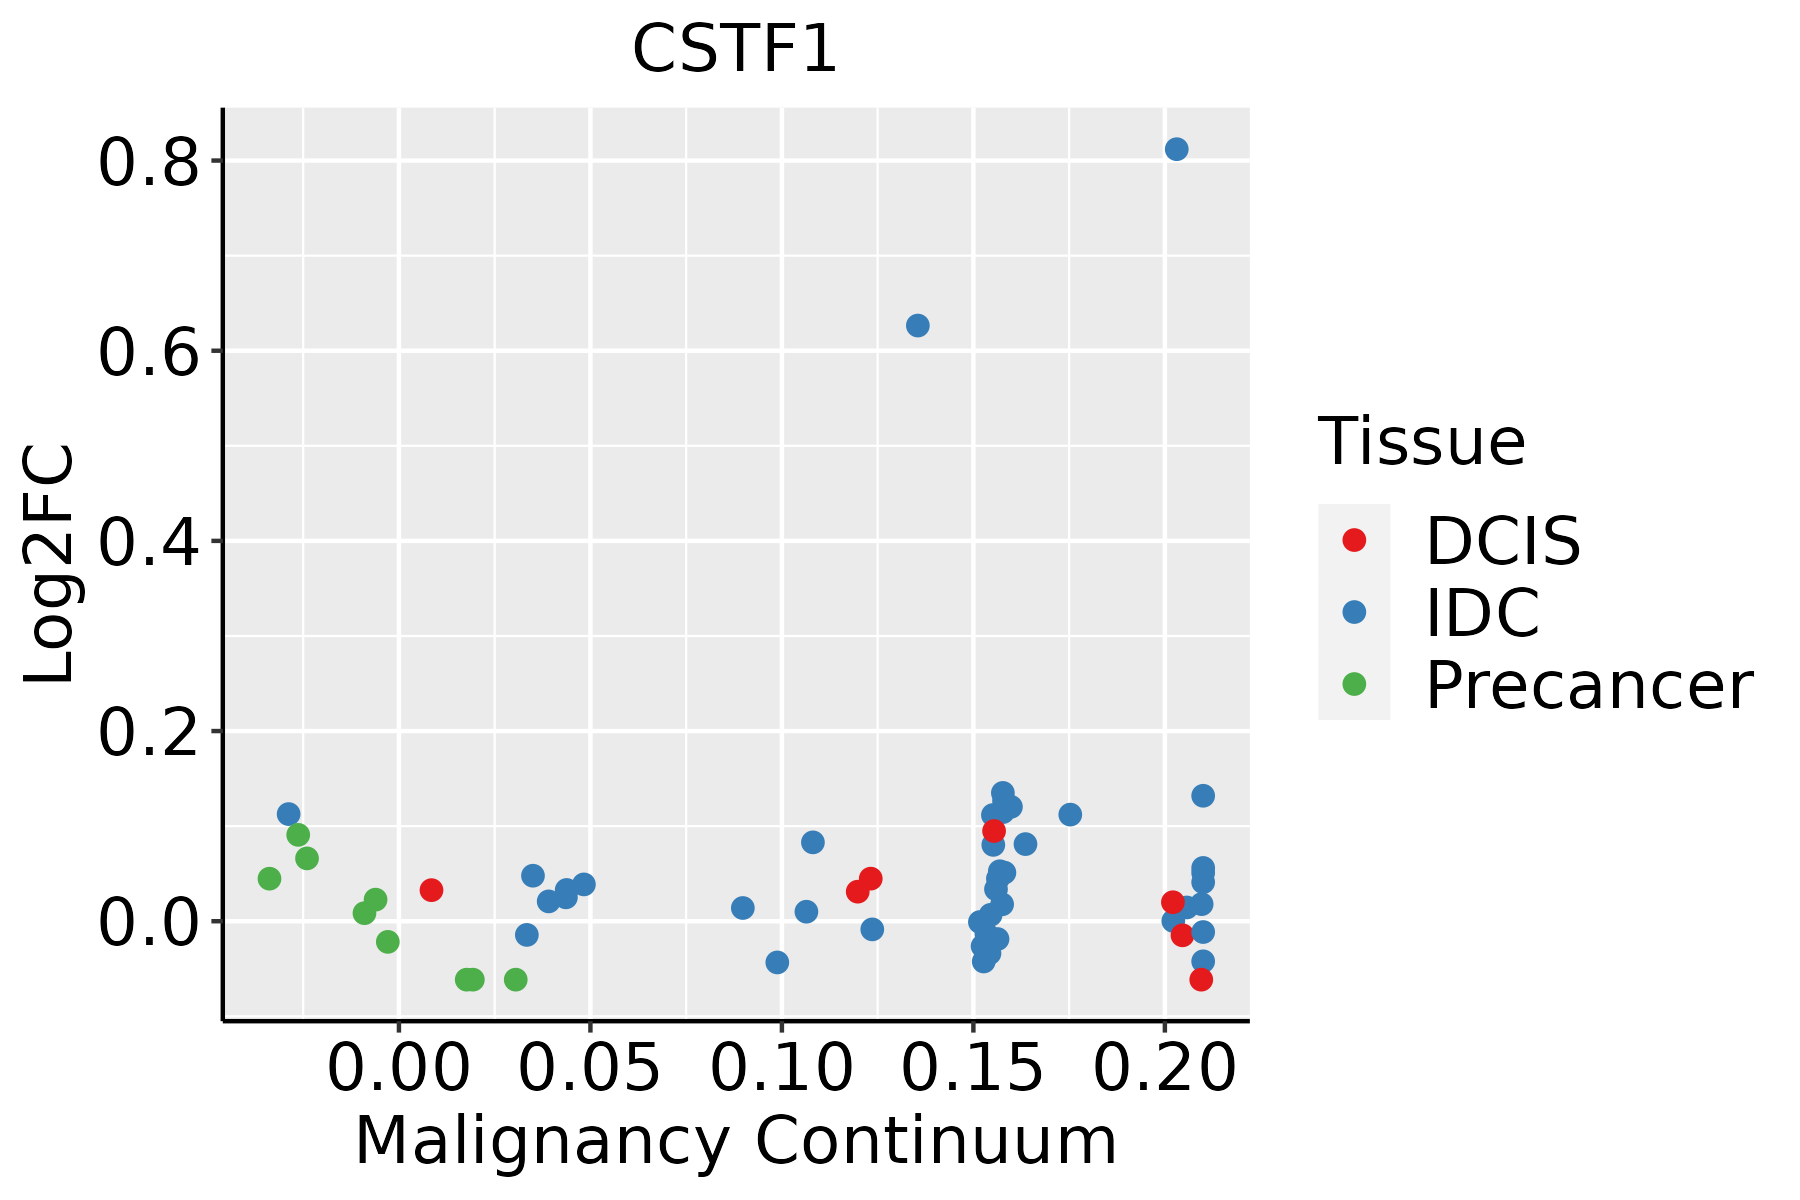 | IDC: Invasive ductal carcinoma |
| DCIS: Ductal carcinoma in situ | ||
| Precancer(BRCA1-mut): Precancerous lesion from BRCA1 mutation carriers | ||
| Esophagus | 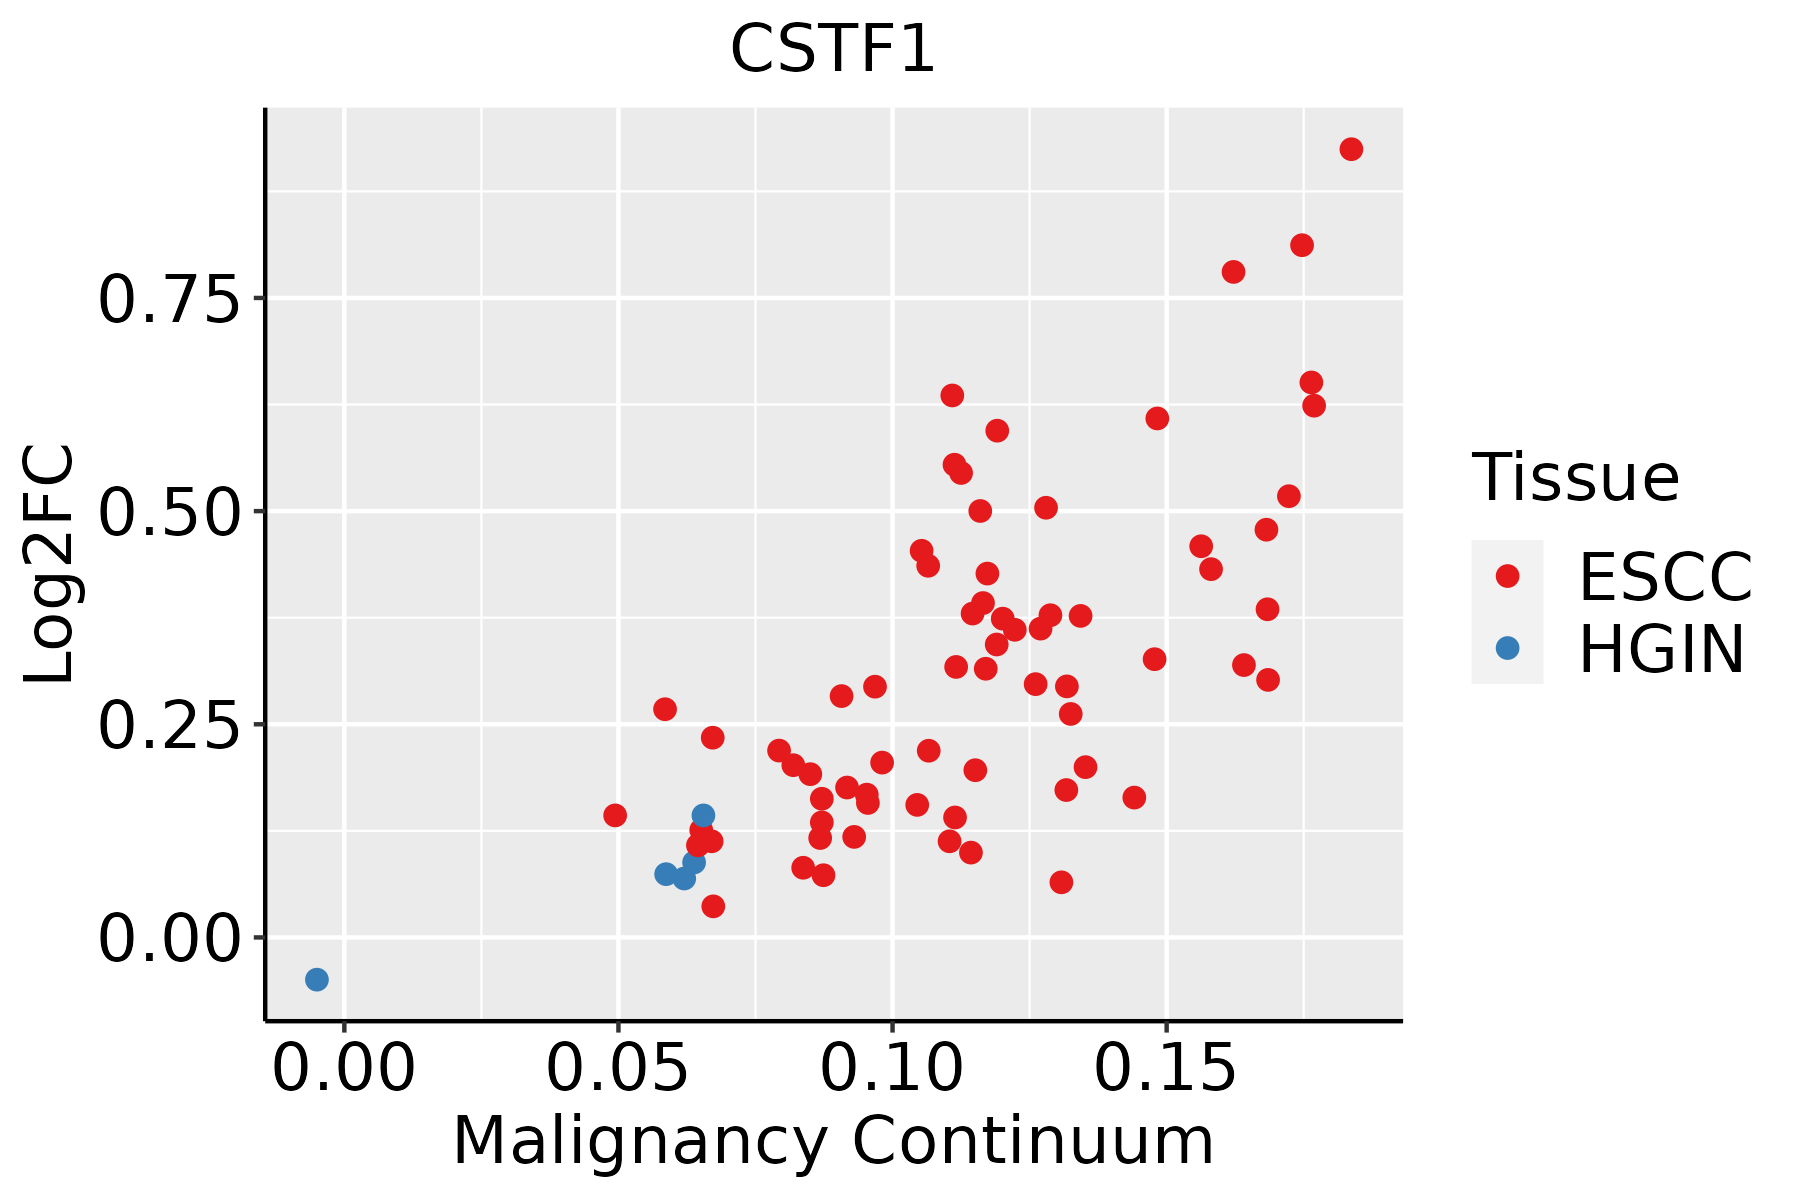 | ESCC: Esophageal squamous cell carcinoma |
| HGIN: High-grade intraepithelial neoplasias | ||
| LGIN: Low-grade intraepithelial neoplasias | ||
| Liver | 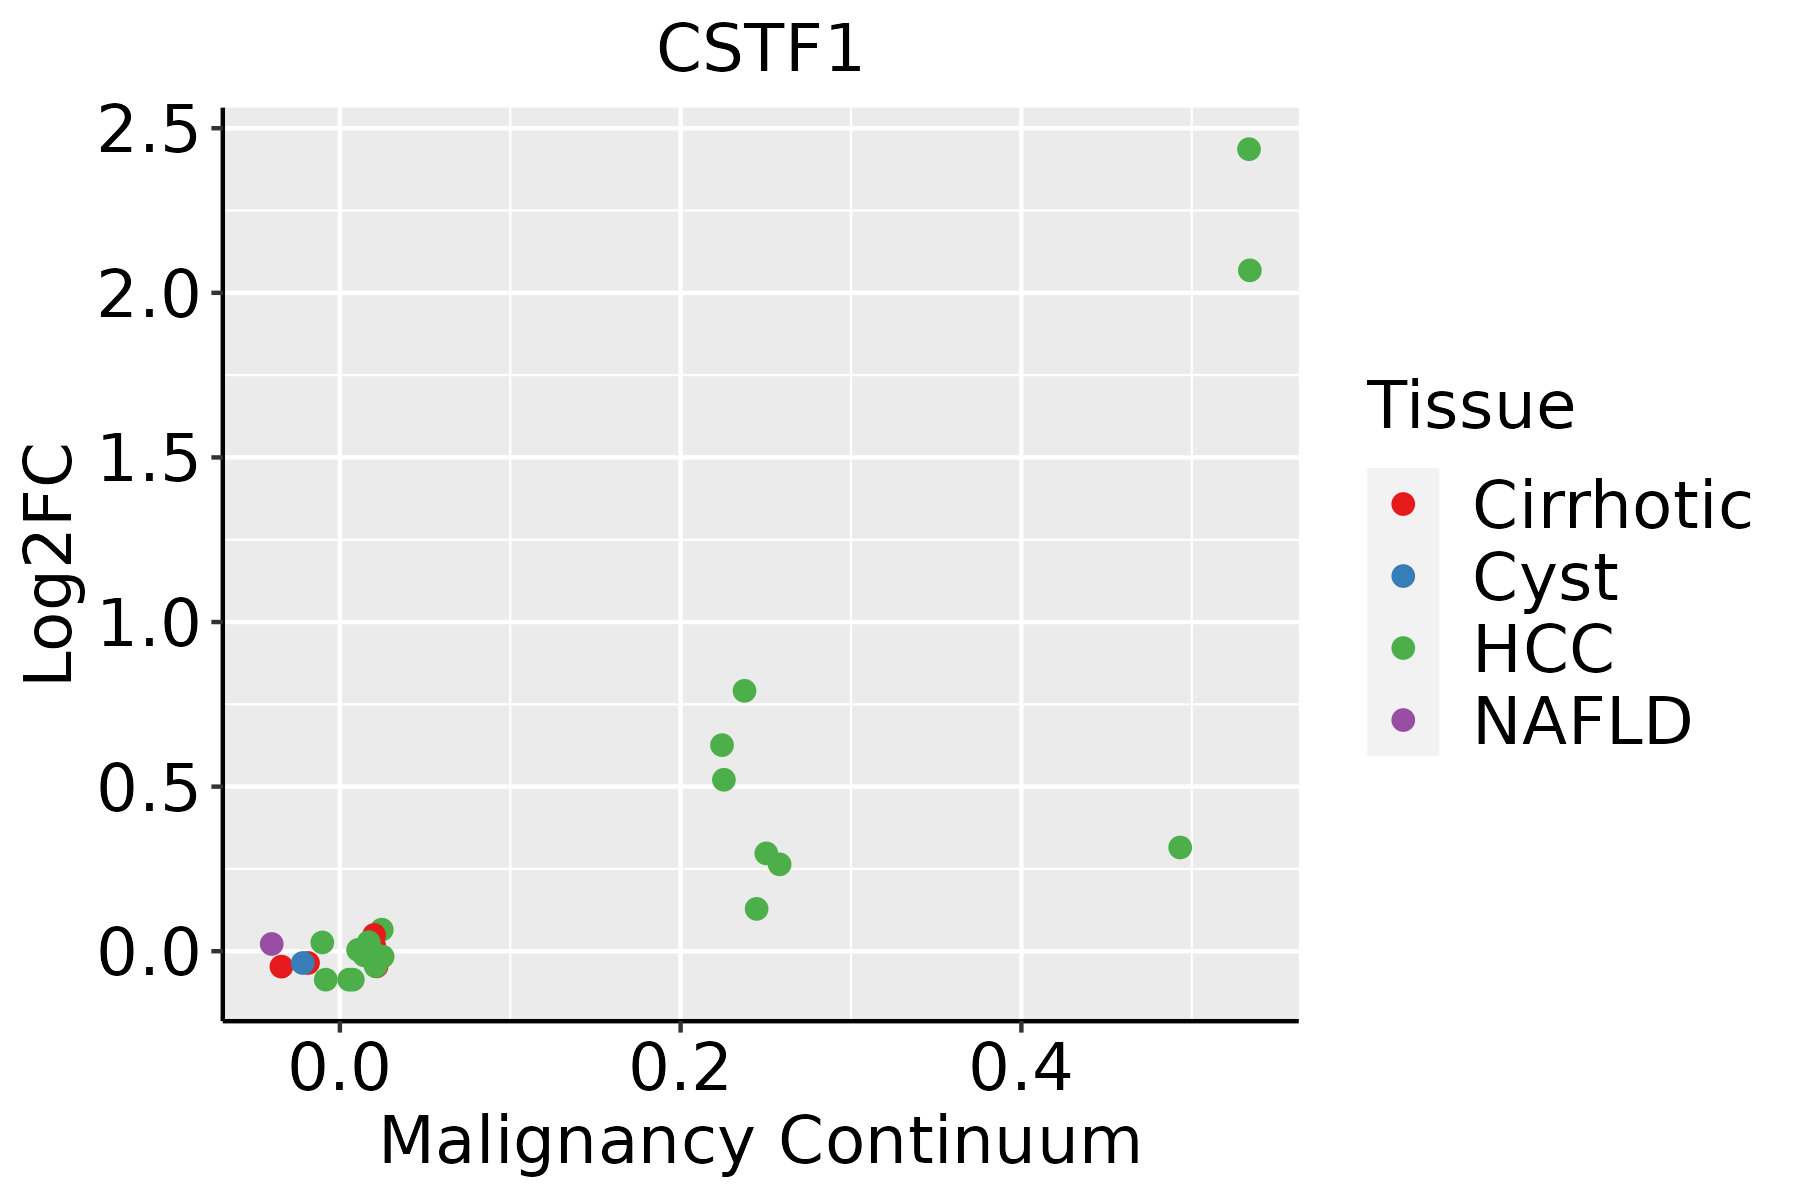 | HCC: Hepatocellular carcinoma |
| NAFLD: Non-alcoholic fatty liver disease | ||
| Oral Cavity | 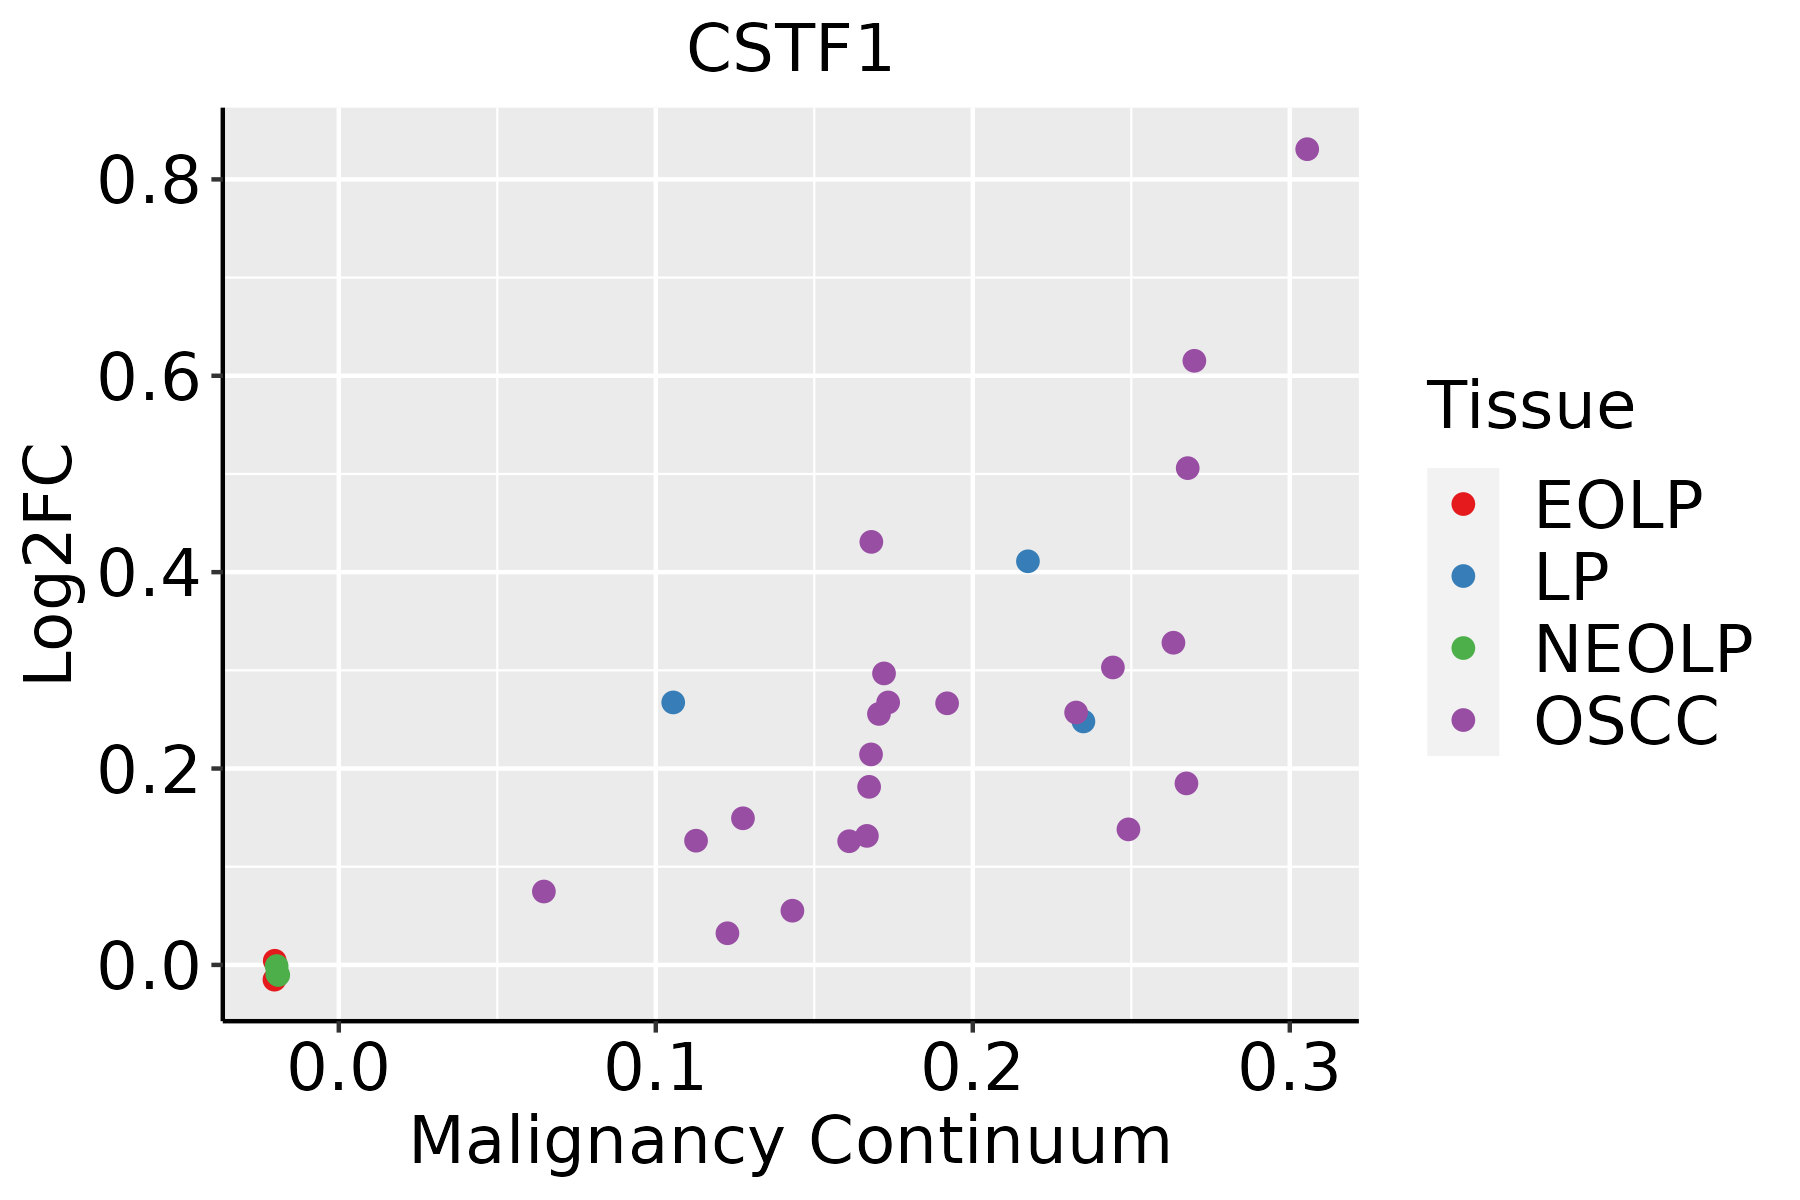 | EOLP: Erosive Oral lichen planus |
| LP: leukoplakia | ||
| NEOLP: Non-erosive oral lichen planus | ||
| OSCC: Oral squamous cell carcinoma |
| ∗log2FC in expression of this searched gene in stem-like cells from each diseased tissue sample relative to stem-like cells in normal samples in each tissue plotted against the malignancy continuum. Samples are colored based on if they are from different disease stage. |
Top |
Malignant transformation related pathway analysis |
| Find out the enriched GO biological processes and KEGG pathways involved in transition from healthy to precancer to cancer |
| Tissue | Disease Stage | Enriched GO biological Processes |
| Colorectum | AD |  |
| Colorectum | SER |  |
| Colorectum | MSS |  |
| Colorectum | MSI-H |  |
| Colorectum | FAP |  |
| ∗Top 15 enriched GO BP terms are showed in the bar plot of each disease state in each tissue. Each row represents a significant GO biological process which is colored according to the -log10(p.adjust). |
| Page: 1 2 3 4 5 6 7 8 9 |
| GO ID | Tissue | Disease Stage | Description | Gene Ratio | Bg Ratio | pvalue | p.adjust | Count |
| GO:003112412 | Esophagus | ESCC | mRNA 3'-end processing | 47/8552 | 62/18723 | 1.29e-06 | 1.58e-05 | 47 |
| GO:00311233 | Esophagus | ESCC | RNA 3'-end processing | 76/8552 | 116/18723 | 1.25e-05 | 1.15e-04 | 76 |
| GO:00311241 | Liver | HCC | mRNA 3'-end processing | 50/7958 | 62/18723 | 8.44e-10 | 2.60e-08 | 50 |
| GO:00311231 | Liver | HCC | RNA 3'-end processing | 81/7958 | 116/18723 | 2.27e-09 | 6.32e-08 | 81 |
| GO:00311242 | Oral cavity | OSCC | mRNA 3'-end processing | 49/7305 | 62/18723 | 1.40e-10 | 4.14e-09 | 49 |
| GO:00311232 | Oral cavity | OSCC | RNA 3'-end processing | 75/7305 | 116/18723 | 1.93e-08 | 3.79e-07 | 75 |
| Page: 1 |
| Pathway ID | Tissue | Disease Stage | Description | Gene Ratio | Bg Ratio | pvalue | p.adjust | qvalue | Count |
| hsa0301524 | Esophagus | ESCC | mRNA surveillance pathway | 72/4205 | 97/8465 | 6.12e-07 | 4.10e-06 | 2.10e-06 | 72 |
| hsa0301534 | Esophagus | ESCC | mRNA surveillance pathway | 72/4205 | 97/8465 | 6.12e-07 | 4.10e-06 | 2.10e-06 | 72 |
| hsa0301521 | Liver | HCC | mRNA surveillance pathway | 66/4020 | 97/8465 | 3.16e-05 | 1.88e-04 | 1.04e-04 | 66 |
| hsa0301531 | Liver | HCC | mRNA surveillance pathway | 66/4020 | 97/8465 | 3.16e-05 | 1.88e-04 | 1.04e-04 | 66 |
| hsa030158 | Oral cavity | OSCC | mRNA surveillance pathway | 75/3704 | 97/8465 | 1.30e-11 | 2.01e-10 | 1.02e-10 | 75 |
| hsa0301513 | Oral cavity | OSCC | mRNA surveillance pathway | 75/3704 | 97/8465 | 1.30e-11 | 2.01e-10 | 1.02e-10 | 75 |
| Page: 1 |
Top |
Cell-cell communication analysis |
| Identification of potential cell-cell interactions between two cell types and their ligand-receptor pairs for different disease states |
| Ligand | Receptor | LRpair | Pathway | Tissue | Disease Stage |
| Page: 1 |
Top |
Single-cell gene regulatory network inference analysis |
| Find out the significant the regulons (TFs) and the target genes of each regulon across cell types for different disease states |
| TF | Cell Type | Tissue | Disease Stage | Target Gene | RSS | Regulon Activity |
| ∗The dot plots of a searched regulon are shown for all cell subpopulations in each disease state of each tissue based on the regulon specific score inferred using pySCENIC and by calculating the average expression. |
| Page: 1 |
Top |
Somatic mutation of malignant transformation related genes |
| Annotation of somatic variants for genes involved in malignant transformation |
| Hugo Symbol | Variant Class | Variant Classification | dbSNP RS | HGVSc | HGVSp | HGVSp Short | SWISSPROT | BIOTYPE | SIFT | PolyPhen | Tumor Sample Barcode | Tissue | Histology | Sex | Age | Stage | Therapy Types | Drugs | Outcome |
| CSTF1 | SNV | Missense_Mutation | c.24N>C | p.Leu8Phe | p.L8F | Q05048 | protein_coding | deleterious(0.01) | benign(0) | TCGA-A2-A0EQ-01 | Breast | breast invasive carcinoma | Female | <65 | I/II | Chemotherapy | adriamycin | SD | |
| CSTF1 | SNV | Missense_Mutation | c.1209N>G | p.Ile403Met | p.I403M | Q05048 | protein_coding | tolerated(0.05) | benign(0.406) | TCGA-D8-A1XK-01 | Breast | breast invasive carcinoma | Female | <65 | I/II | Chemotherapy | doxorubicine+cyclophosphamide | SD | |
| CSTF1 | SNV | Missense_Mutation | novel | c.613N>T | p.Pro205Ser | p.P205S | Q05048 | protein_coding | tolerated(0.53) | benign(0.043) | TCGA-2W-A8YY-01 | Cervix | cervical & endocervical cancer | Female | <65 | I/II | Chemotherapy | cisplatin | CR |
| CSTF1 | SNV | Missense_Mutation | c.1241N>T | p.Thr414Met | p.T414M | Q05048 | protein_coding | deleterious(0) | probably_damaging(0.957) | TCGA-2W-A8YY-01 | Cervix | cervical & endocervical cancer | Female | <65 | I/II | Chemotherapy | cisplatin | CR | |
| CSTF1 | SNV | Missense_Mutation | c.1073A>G | p.Gln358Arg | p.Q358R | Q05048 | protein_coding | tolerated(0.05) | benign(0.043) | TCGA-C5-A8ZZ-01 | Cervix | cervical & endocervical cancer | Female | <65 | I/II | Unspecific | Cisplatin | SD | |
| CSTF1 | SNV | Missense_Mutation | rs140246355 | c.832G>A | p.Val278Ile | p.V278I | Q05048 | protein_coding | tolerated(0.08) | benign(0.317) | TCGA-AA-3696-01 | Colorectum | colon adenocarcinoma | Female | >=65 | III/IV | Unknown | Unknown | PD |
| CSTF1 | SNV | Missense_Mutation | c.31N>T | p.Arg11Cys | p.R11C | Q05048 | protein_coding | deleterious(0.02) | benign(0.003) | TCGA-CM-4746-01 | Colorectum | colon adenocarcinoma | Male | <65 | I/II | Unknown | Unknown | SD | |
| CSTF1 | SNV | Missense_Mutation | c.31N>T | p.Arg11Cys | p.R11C | Q05048 | protein_coding | deleterious(0.02) | benign(0.003) | TCGA-G4-6302-01 | Colorectum | colon adenocarcinoma | Female | >=65 | I/II | Unknown | Unknown | SD | |
| CSTF1 | SNV | Missense_Mutation | novel | c.874N>A | p.Val292Ile | p.V292I | Q05048 | protein_coding | tolerated(0.13) | probably_damaging(0.952) | TCGA-AG-A023-01 | Colorectum | rectum adenocarcinoma | Female | <65 | III/IV | Unknown | Unknown | PD |
| CSTF1 | insertion | Frame_Shift_Ins | novel | c.950dupA | p.Asn317LysfsTer3 | p.N317Kfs*3 | Q05048 | protein_coding | TCGA-AA-3947-01 | Colorectum | colon adenocarcinoma | Female | <65 | I/II | Unknown | Unknown | SD |
| Page: 1 2 3 4 5 6 |
Top |
Related drugs of malignant transformation related genes |
| Identification of chemicals and drugs interact with genes involved in malignant transfromation |
| (DGIdb 4.0) |
| Entrez ID | Symbol | Category | Interaction Types | Drug Claim Name | Drug Name | PMIDs |
| Page: 1 |

Copyright 2023-Present -The University of Texas Health Science Center at Houston |