
|
|||||
|
 | |
| |
| |
| |
| |
| |
|
Gene: CSTB |
Gene summary for CSTB |
| Gene information | Species | Human | Gene symbol | CSTB | Gene ID | 1476 |
| Gene name | cystatin B | |
| Gene Alias | CPI-B | |
| Cytomap | 21q22.3 | |
| Gene Type | protein-coding | GO ID | GO:0006508 | UniProtAcc | P04080 |
Top |
Malignant transformation analysis |
| Identification of the aberrant gene expression in precancerous and cancerous lesions by comparing the gene expression of stem-like cells in diseased tissues with normal stem cells |
| Entrez ID | Symbol | Replicates | Species | Organ | Tissue | Adj P-value | Log2FC | Malignancy |
| 1476 | CSTB | GSM4909280 | Human | Breast | Precancer | 1.28e-04 | -6.94e-01 | 0.0305 |
| 1476 | CSTB | GSM4909282 | Human | Breast | IDC | 5.17e-116 | 1.01e+00 | -0.0288 |
| 1476 | CSTB | GSM4909285 | Human | Breast | IDC | 2.08e-116 | 9.95e-01 | 0.21 |
| 1476 | CSTB | GSM4909286 | Human | Breast | IDC | 7.60e-13 | -1.55e-01 | 0.1081 |
| 1476 | CSTB | GSM4909287 | Human | Breast | IDC | 8.02e-20 | 4.70e-01 | 0.2057 |
| 1476 | CSTB | GSM4909290 | Human | Breast | IDC | 6.81e-27 | 6.10e-01 | 0.2096 |
| 1476 | CSTB | GSM4909293 | Human | Breast | IDC | 4.44e-03 | 2.05e-01 | 0.1581 |
| 1476 | CSTB | GSM4909294 | Human | Breast | IDC | 4.39e-17 | -6.02e-01 | 0.2022 |
| 1476 | CSTB | GSM4909296 | Human | Breast | IDC | 9.43e-06 | -2.48e-01 | 0.1524 |
| 1476 | CSTB | GSM4909297 | Human | Breast | IDC | 3.56e-13 | -2.40e-01 | 0.1517 |
| 1476 | CSTB | GSM4909304 | Human | Breast | IDC | 3.25e-03 | 1.98e-01 | 0.1636 |
| 1476 | CSTB | GSM4909305 | Human | Breast | IDC | 1.55e-03 | -1.31e-01 | 0.0436 |
| 1476 | CSTB | GSM4909306 | Human | Breast | IDC | 1.55e-05 | -2.30e-01 | 0.1564 |
| 1476 | CSTB | GSM4909308 | Human | Breast | IDC | 7.73e-05 | 2.51e-01 | 0.158 |
| 1476 | CSTB | GSM4909311 | Human | Breast | IDC | 1.03e-34 | -2.23e-01 | 0.1534 |
| 1476 | CSTB | GSM4909312 | Human | Breast | IDC | 3.66e-02 | -1.66e-01 | 0.1552 |
| 1476 | CSTB | GSM4909317 | Human | Breast | IDC | 4.86e-12 | -4.84e-01 | 0.1355 |
| 1476 | CSTB | GSM4909319 | Human | Breast | IDC | 2.56e-51 | -7.28e-01 | 0.1563 |
| 1476 | CSTB | GSM4909321 | Human | Breast | IDC | 1.58e-07 | -1.86e-01 | 0.1559 |
| 1476 | CSTB | brca1 | Human | Breast | Precancer | 1.06e-21 | 5.36e-01 | -0.0338 |
| Page: 1 2 3 4 5 6 7 8 9 10 11 12 13 14 15 |
| Tissue | Expression Dynamics | Abbreviation |
| Breast |  | IDC: Invasive ductal carcinoma |
| DCIS: Ductal carcinoma in situ | ||
| Precancer(BRCA1-mut): Precancerous lesion from BRCA1 mutation carriers | ||
| Cervix |  | CC: Cervix cancer |
| HSIL_HPV: HPV-infected high-grade squamous intraepithelial lesions | ||
| N_HPV: HPV-infected normal cervix | ||
| Colorectum (GSE201348) | 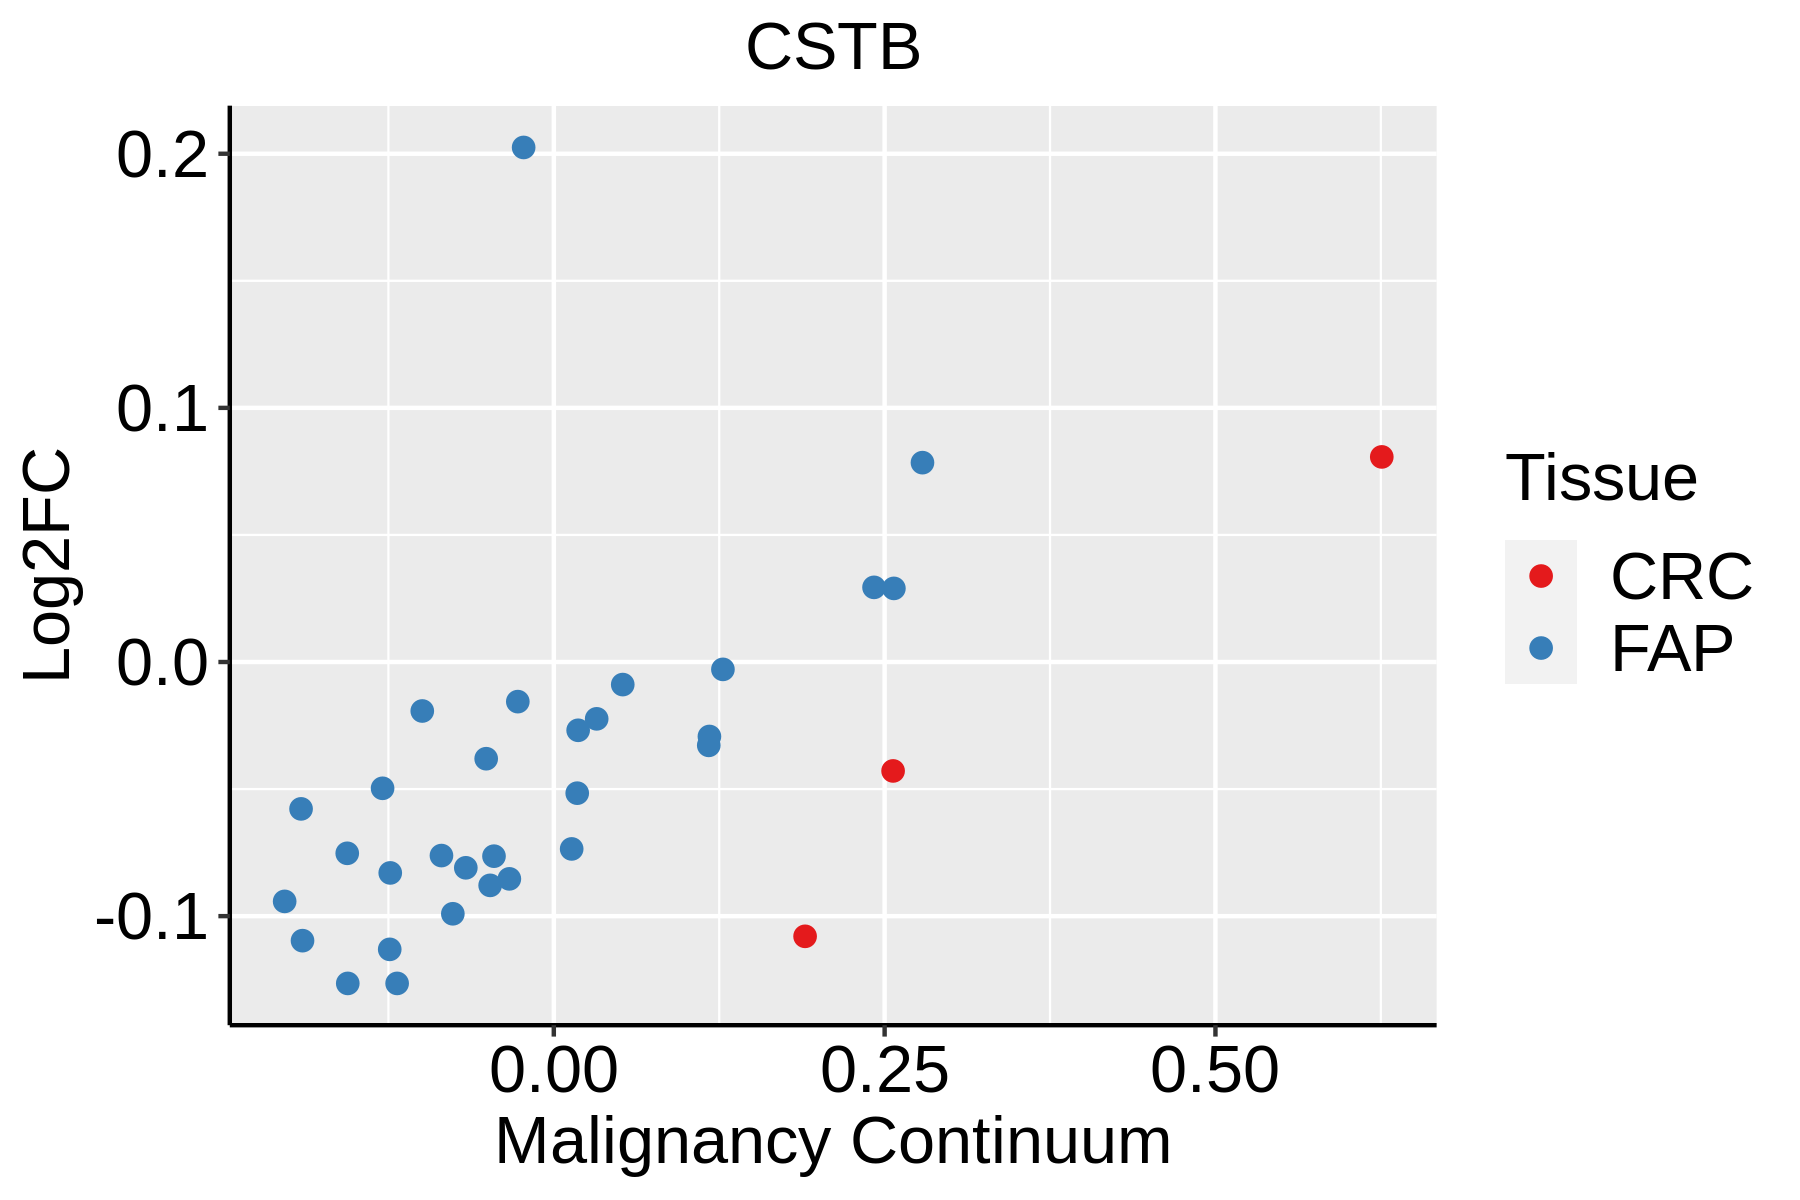 | FAP: Familial adenomatous polyposis |
| CRC: Colorectal cancer | ||
| Colorectum (HTA11) |  | AD: Adenomas |
| SER: Sessile serrated lesions | ||
| MSI-H: Microsatellite-high colorectal cancer | ||
| MSS: Microsatellite stable colorectal cancer | ||
| Endometrium | 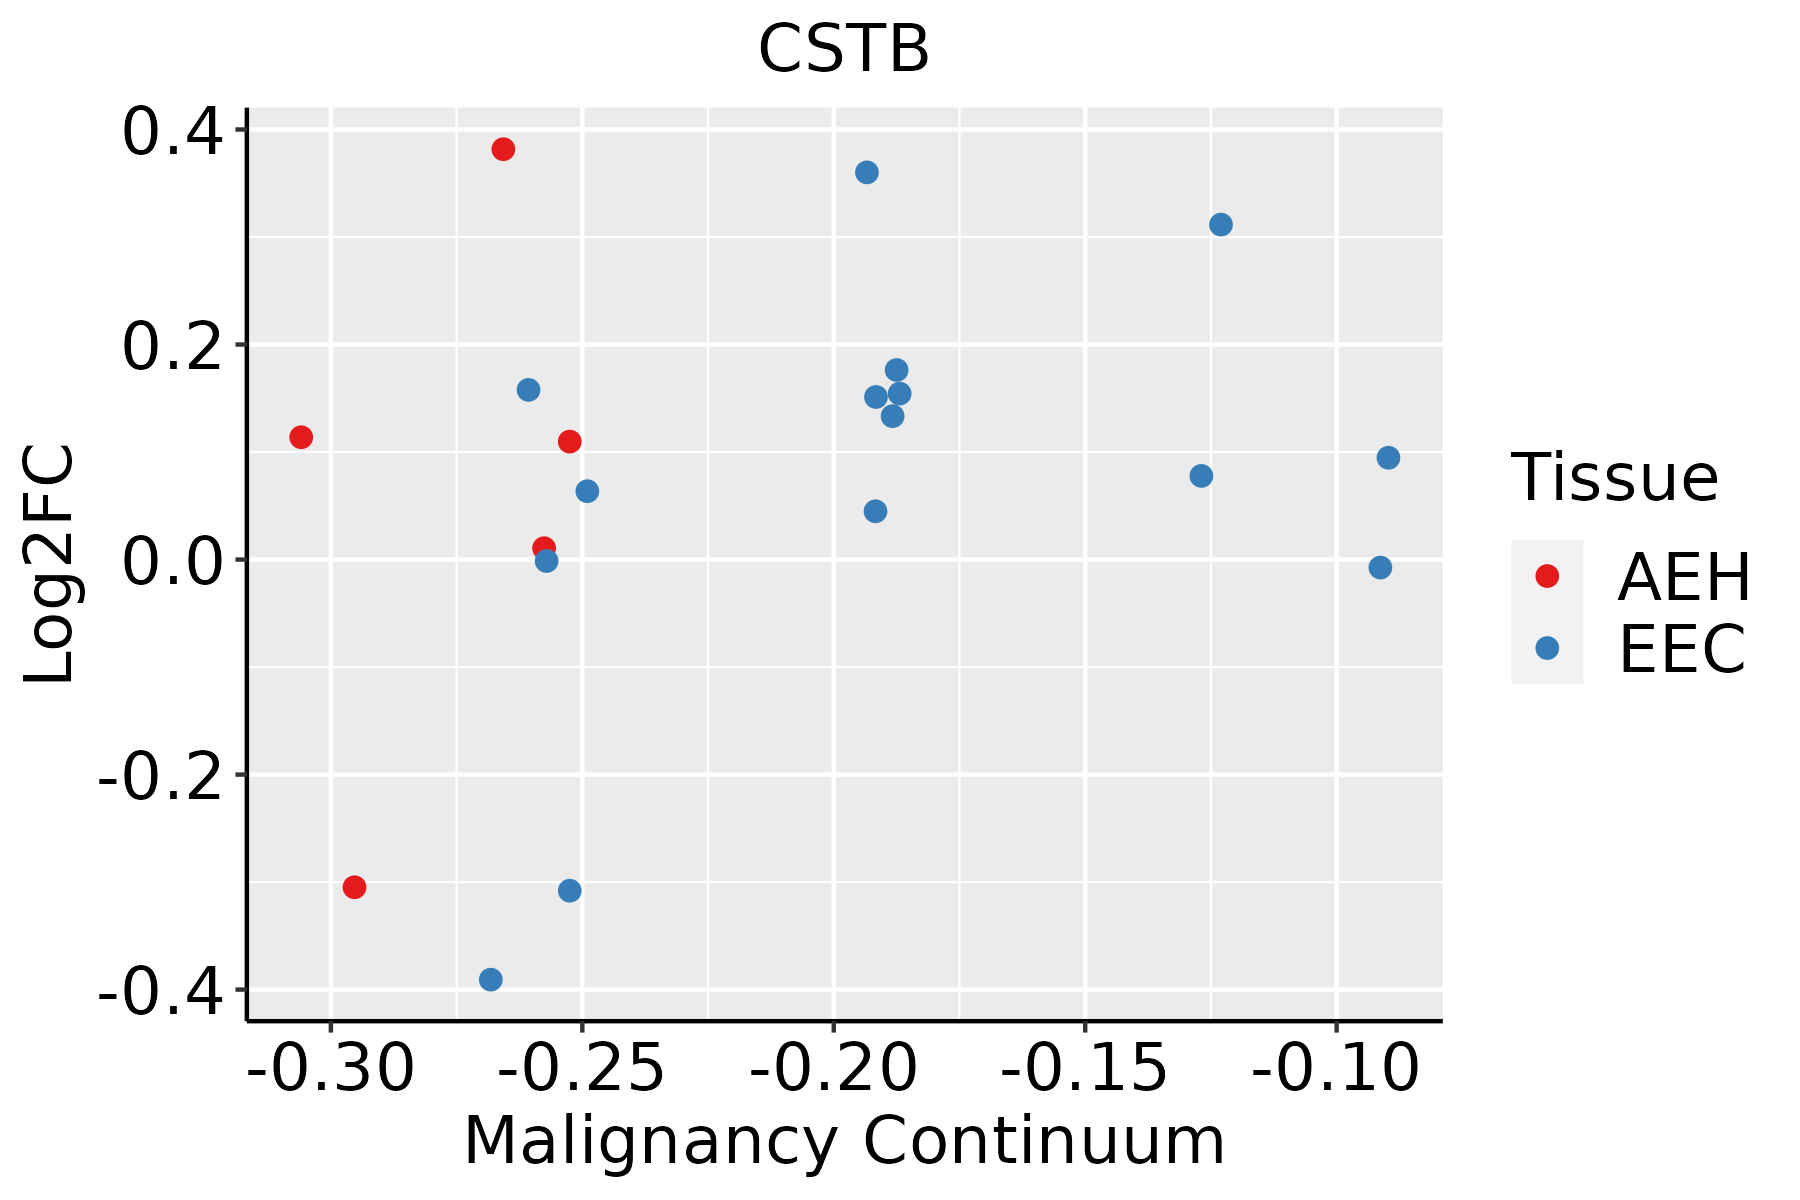 | AEH: Atypical endometrial hyperplasia |
| EEC: Endometrioid Cancer | ||
| Esophagus | 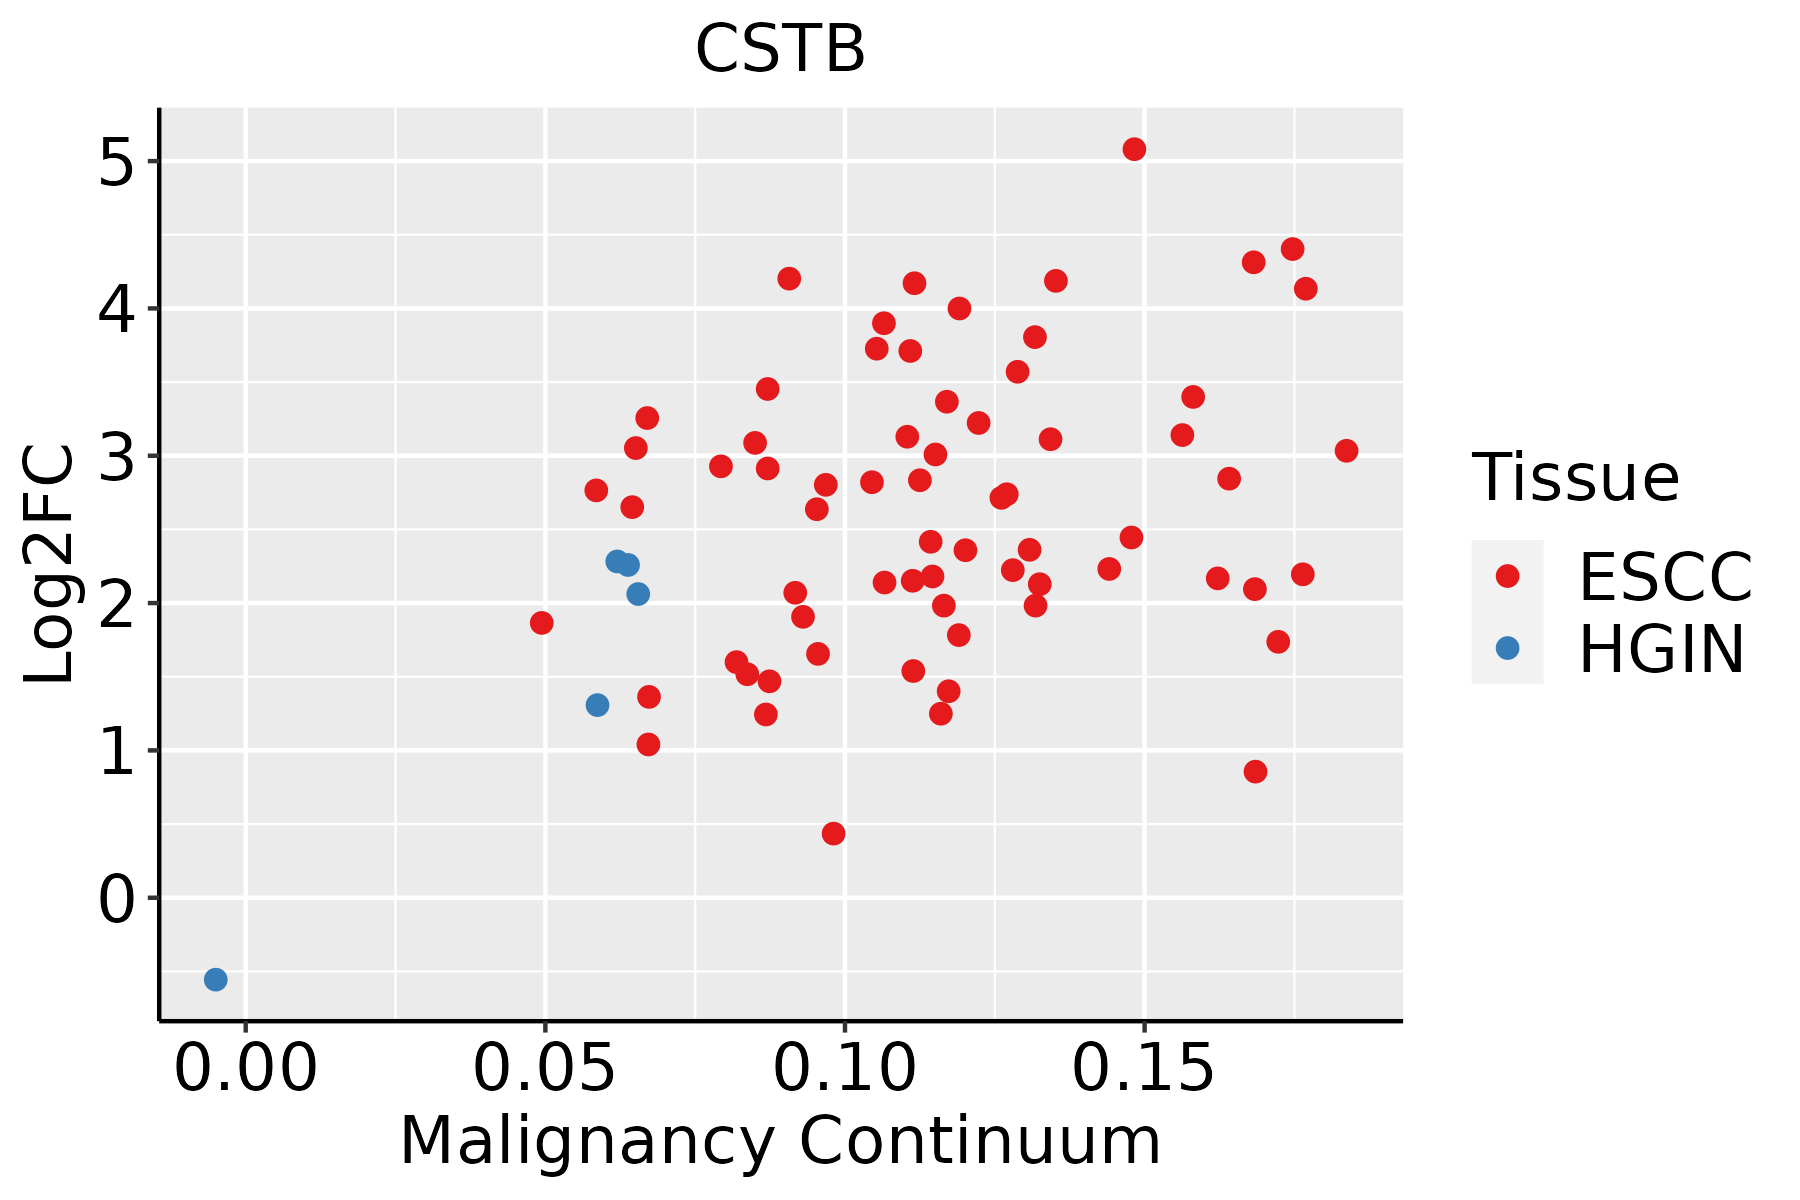 | ESCC: Esophageal squamous cell carcinoma |
| HGIN: High-grade intraepithelial neoplasias | ||
| LGIN: Low-grade intraepithelial neoplasias | ||
| Liver | 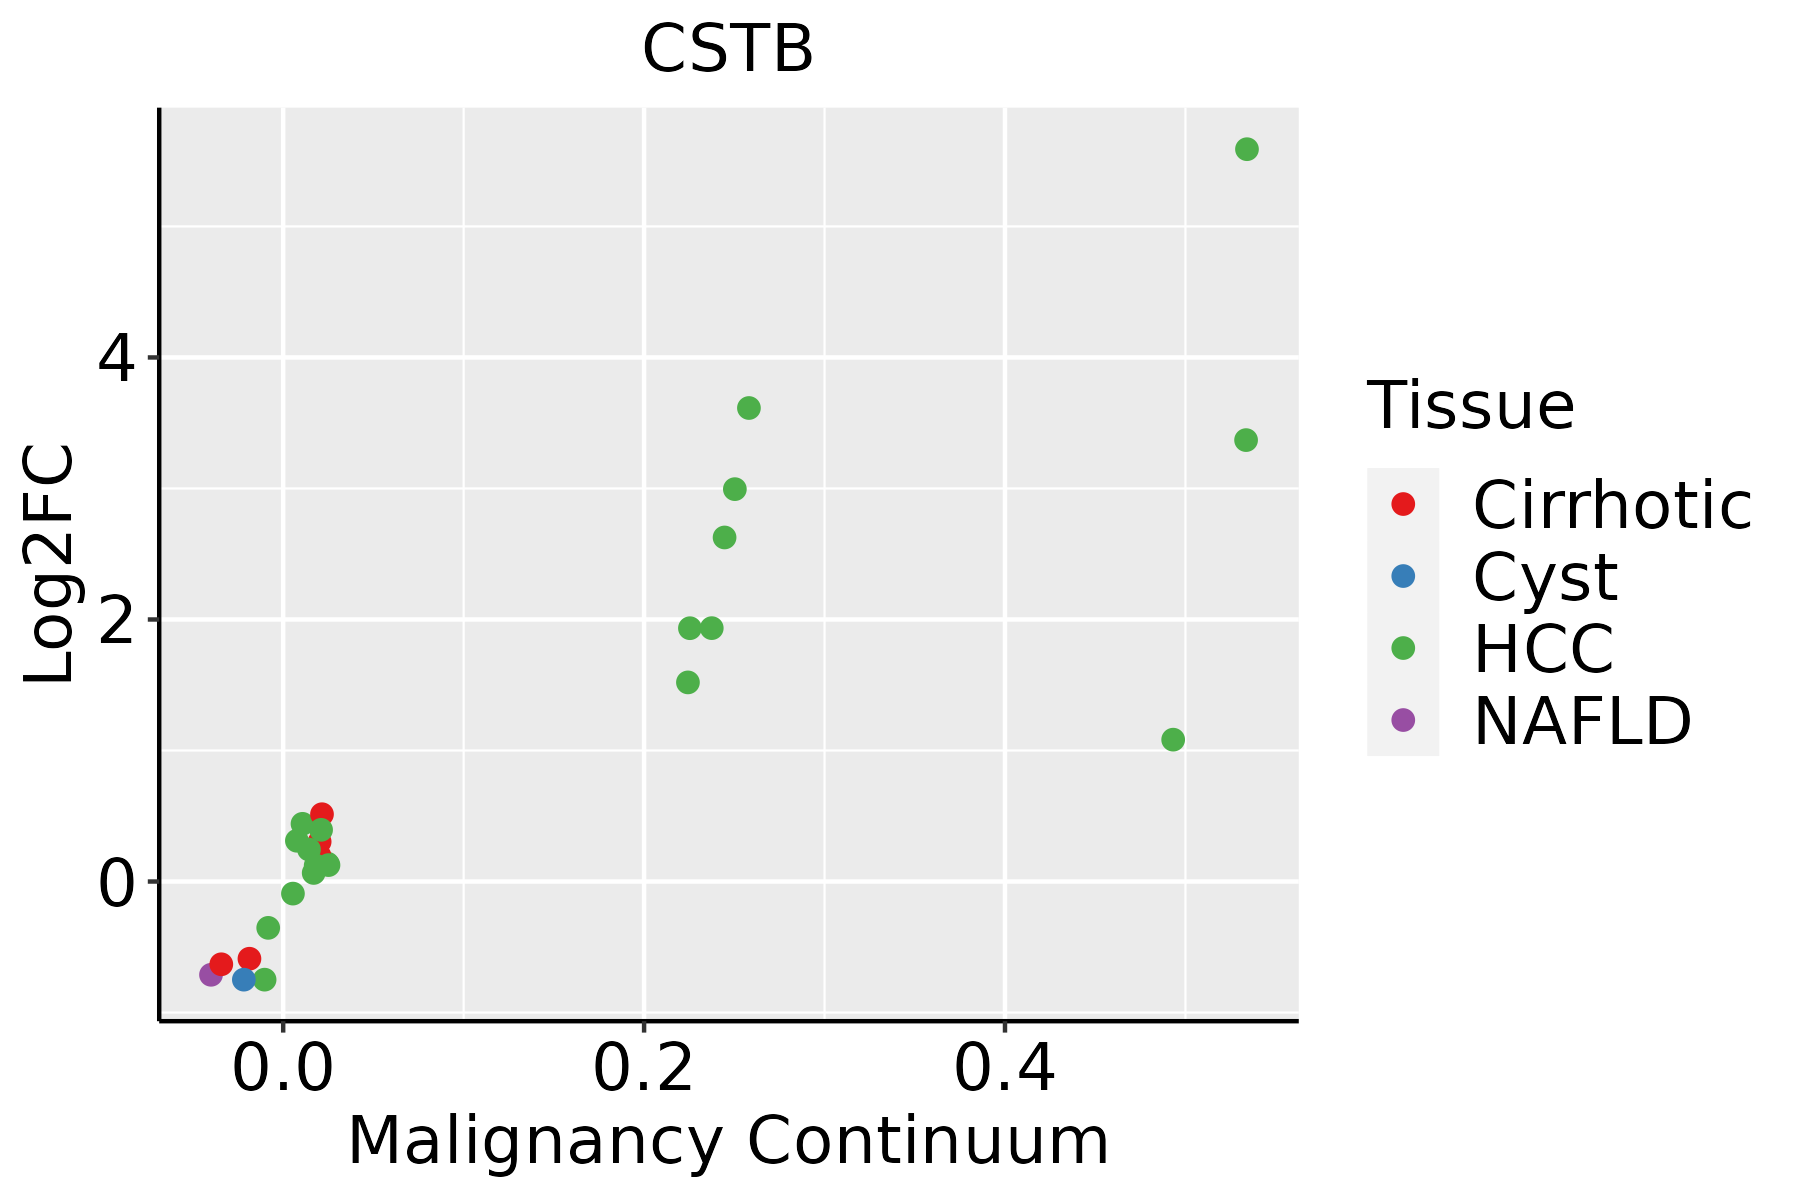 | HCC: Hepatocellular carcinoma |
| NAFLD: Non-alcoholic fatty liver disease | ||
| Oral Cavity |  | EOLP: Erosive Oral lichen planus |
| LP: leukoplakia | ||
| NEOLP: Non-erosive oral lichen planus | ||
| OSCC: Oral squamous cell carcinoma | ||
| Prostate |  | BPH: Benign Prostatic Hyperplasia |
| Skin |  | AK: Actinic keratosis |
| cSCC: Cutaneous squamous cell carcinoma | ||
| SCCIS:squamous cell carcinoma in situ | ||
| Thyroid | 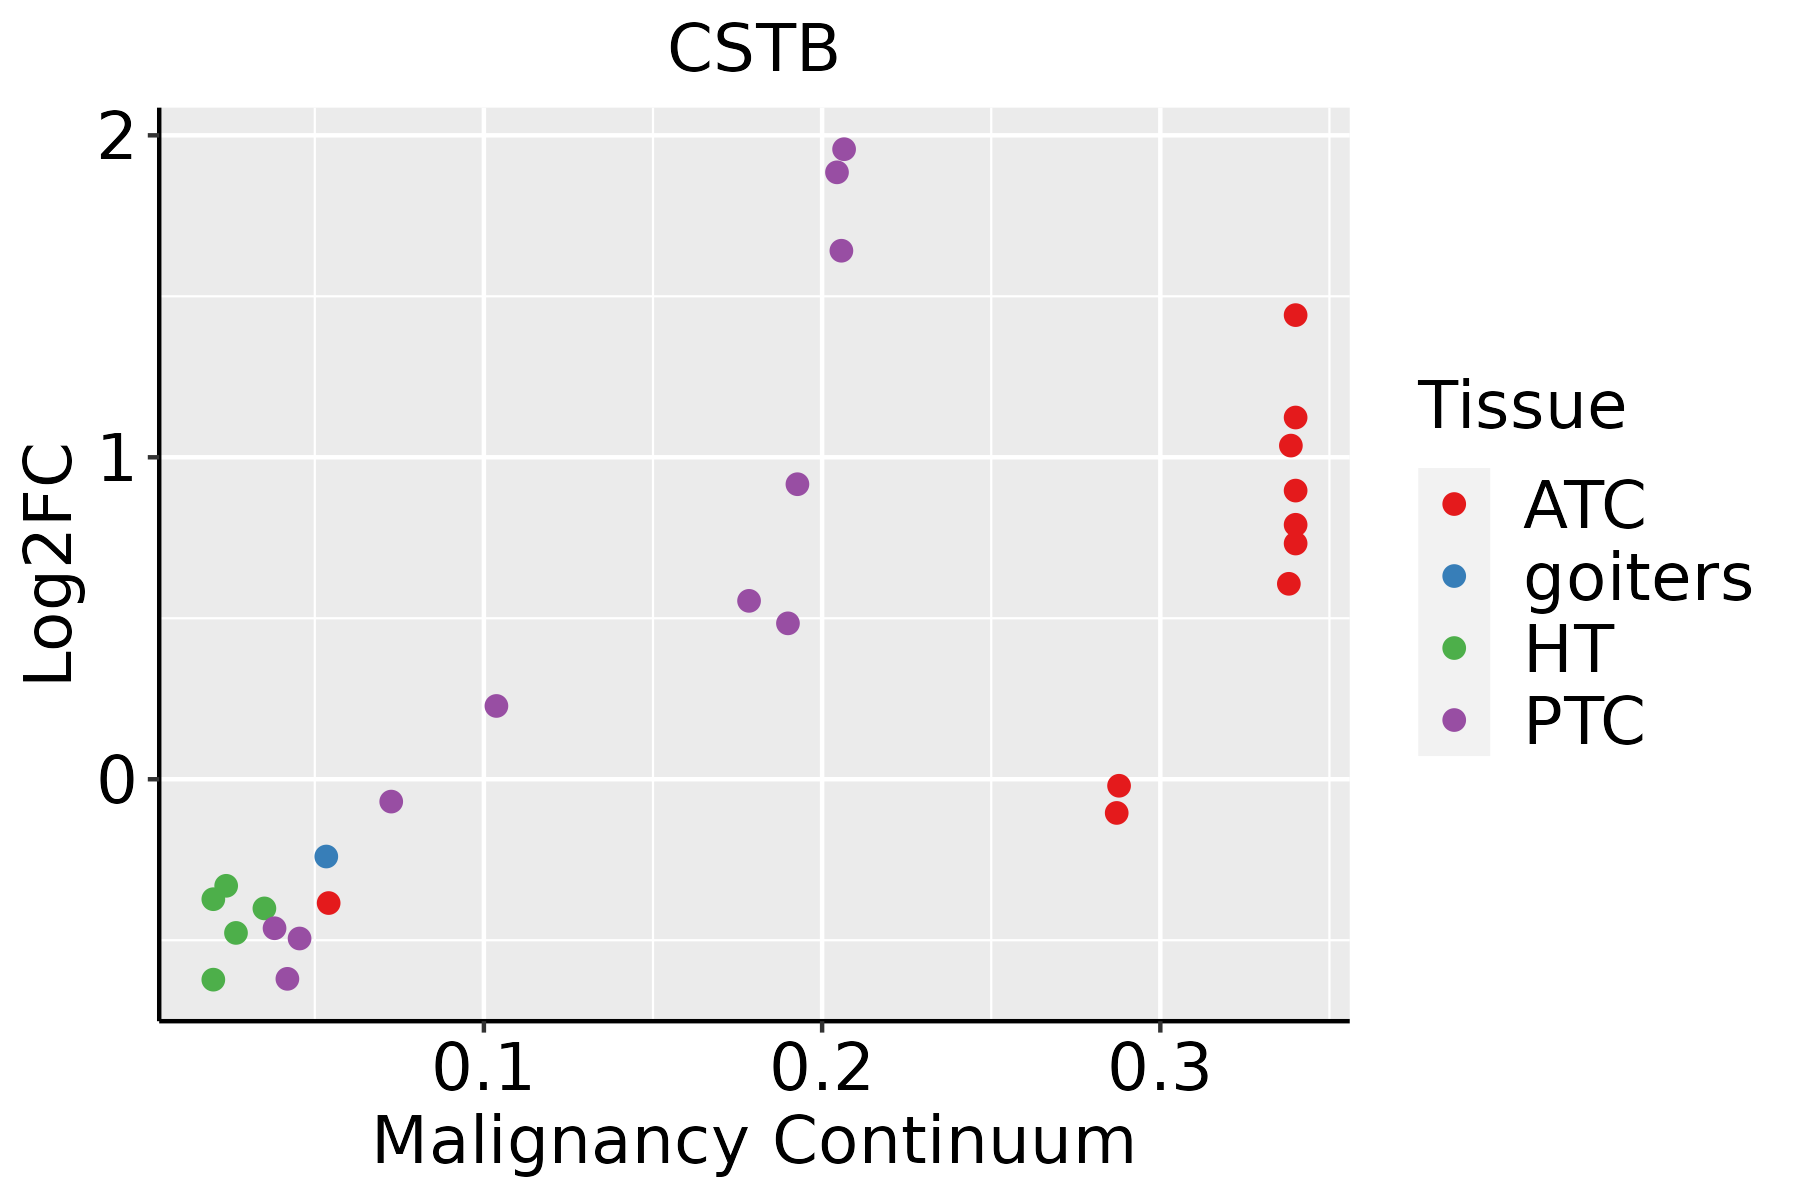 | ATC: Anaplastic thyroid cancer |
| HT: Hashimoto's thyroiditis | ||
| PTC: Papillary thyroid cancer |
| ∗log2FC in expression of this searched gene in stem-like cells from each diseased tissue sample relative to stem-like cells in normal samples in each tissue plotted against the malignancy continuum. Samples are colored based on if they are from different disease stage. |
Top |
Malignant transformation related pathway analysis |
| Find out the enriched GO biological processes and KEGG pathways involved in transition from healthy to precancer to cancer |
| Tissue | Disease Stage | Enriched GO biological Processes |
| Colorectum | AD |  |
| Colorectum | SER |  |
| Colorectum | MSS |  |
| Colorectum | MSI-H |  |
| Colorectum | FAP |  |
| ∗Top 15 enriched GO BP terms are showed in the bar plot of each disease state in each tissue. Each row represents a significant GO biological process which is colored according to the -log10(p.adjust). |
| Page: 1 2 3 4 5 6 7 8 9 |
| GO ID | Tissue | Disease Stage | Description | Gene Ratio | Bg Ratio | pvalue | p.adjust | Count |
| GO:00525479 | Breast | Precancer | regulation of peptidase activity | 71/1080 | 461/18723 | 2.72e-14 | 6.94e-12 | 71 |
| GO:00525489 | Breast | Precancer | regulation of endopeptidase activity | 67/1080 | 432/18723 | 1.06e-13 | 2.36e-11 | 67 |
| GO:00458619 | Breast | Precancer | negative regulation of proteolysis | 50/1080 | 351/18723 | 2.99e-09 | 2.39e-07 | 50 |
| GO:00513468 | Breast | Precancer | negative regulation of hydrolase activity | 50/1080 | 379/18723 | 3.85e-08 | 2.34e-06 | 50 |
| GO:00104668 | Breast | Precancer | negative regulation of peptidase activity | 38/1080 | 262/18723 | 1.46e-07 | 7.82e-06 | 38 |
| GO:00109519 | Breast | Precancer | negative regulation of endopeptidase activity | 37/1080 | 252/18723 | 1.55e-07 | 8.05e-06 | 37 |
| GO:005254714 | Breast | IDC | regulation of peptidase activity | 96/1434 | 461/18723 | 7.58e-20 | 6.15e-17 | 96 |
| GO:005254814 | Breast | IDC | regulation of endopeptidase activity | 88/1434 | 432/18723 | 1.20e-17 | 4.85e-15 | 88 |
| GO:004586114 | Breast | IDC | negative regulation of proteolysis | 70/1434 | 351/18723 | 8.21e-14 | 2.22e-11 | 70 |
| GO:005134613 | Breast | IDC | negative regulation of hydrolase activity | 71/1434 | 379/18723 | 1.33e-12 | 2.90e-10 | 71 |
| GO:001046613 | Breast | IDC | negative regulation of peptidase activity | 56/1434 | 262/18723 | 1.39e-12 | 2.92e-10 | 56 |
| GO:001095112 | Breast | IDC | negative regulation of endopeptidase activity | 52/1434 | 252/18723 | 3.53e-11 | 5.57e-09 | 52 |
| GO:005254723 | Breast | DCIS | regulation of peptidase activity | 88/1390 | 461/18723 | 1.18e-16 | 4.78e-14 | 88 |
| GO:005254823 | Breast | DCIS | regulation of endopeptidase activity | 83/1390 | 432/18723 | 6.07e-16 | 2.15e-13 | 83 |
| GO:004586123 | Breast | DCIS | negative regulation of proteolysis | 63/1390 | 351/18723 | 4.39e-11 | 6.06e-09 | 63 |
| GO:005134623 | Breast | DCIS | negative regulation of hydrolase activity | 64/1390 | 379/18723 | 4.32e-10 | 4.80e-08 | 64 |
| GO:001046622 | Breast | DCIS | negative regulation of peptidase activity | 49/1390 | 262/18723 | 1.54e-09 | 1.43e-07 | 49 |
| GO:001095122 | Breast | DCIS | negative regulation of endopeptidase activity | 47/1390 | 252/18723 | 3.63e-09 | 3.11e-07 | 47 |
| GO:005254710 | Cervix | CC | regulation of peptidase activity | 112/2311 | 461/18723 | 6.70e-13 | 3.08e-10 | 112 |
| GO:005254810 | Cervix | CC | regulation of endopeptidase activity | 103/2311 | 432/18723 | 1.89e-11 | 5.14e-09 | 103 |
| Page: 1 2 3 4 5 6 7 8 |
| Pathway ID | Tissue | Disease Stage | Description | Gene Ratio | Bg Ratio | pvalue | p.adjust | qvalue | Count |
| Page: 1 |
Top |
Cell-cell communication analysis |
| Identification of potential cell-cell interactions between two cell types and their ligand-receptor pairs for different disease states |
| Ligand | Receptor | LRpair | Pathway | Tissue | Disease Stage |
| Page: 1 |
Top |
Single-cell gene regulatory network inference analysis |
| Find out the significant the regulons (TFs) and the target genes of each regulon across cell types for different disease states |
| TF | Cell Type | Tissue | Disease Stage | Target Gene | RSS | Regulon Activity |
| ∗The dot plots of a searched regulon are shown for all cell subpopulations in each disease state of each tissue based on the regulon specific score inferred using pySCENIC and by calculating the average expression. |
| Page: 1 |
Top |
Somatic mutation of malignant transformation related genes |
| Annotation of somatic variants for genes involved in malignant transformation |
| Hugo Symbol | Variant Class | Variant Classification | dbSNP RS | HGVSc | HGVSp | HGVSp Short | SWISSPROT | BIOTYPE | SIFT | PolyPhen | Tumor Sample Barcode | Tissue | Histology | Sex | Age | Stage | Therapy Types | Drugs | Outcome |
| CSTB | insertion | Nonsense_Mutation | novel | c.190_191insCCCCGTTTGTAACGCGGGCCCCGTCCTGAA | p.Phe64delinsSerProPheValThrArgAlaProSerTerIle | p.F64delinsSPFVTRAPS*I | P04080 | protein_coding | TCGA-AO-A0JB-01 | Breast | breast invasive carcinoma | Female | <65 | III/IV | Chemotherapy | cyclophosphamide | SD | ||
| CSTB | SNV | Missense_Mutation | c.226N>A | p.Glu76Lys | p.E76K | P04080 | protein_coding | tolerated(0.13) | benign(0.132) | TCGA-C5-A1BM-01 | Cervix | cervical & endocervical cancer | Female | >=65 | I/II | Unknown | Unknown | SD | |
| CSTB | SNV | Missense_Mutation | c.215N>G | p.Ser72Cys | p.S72C | P04080 | protein_coding | deleterious(0) | probably_damaging(0.975) | TCGA-A6-3810-01 | Colorectum | colon adenocarcinoma | Male | <65 | I/II | Unknown | Unknown | SD | |
| CSTB | SNV | Missense_Mutation | novel | c.107N>A | p.Pro36His | p.P36H | P04080 | protein_coding | tolerated(0.07) | possibly_damaging(0.8) | TCGA-DF-A2KN-01 | Endometrium | uterine corpus endometrioid carcinoma | Female | Unknown | I/II | Unknown | Unknown | SD |
| CSTB | SNV | Missense_Mutation | novel | c.87G>T | p.Glu29Asp | p.E29D | P04080 | protein_coding | deleterious(0.01) | benign(0.134) | TCGA-E6-A1LX-01 | Endometrium | uterine corpus endometrioid carcinoma | Female | <65 | I/II | Unknown | Unknown | SD |
| CSTB | SNV | Missense_Mutation | c.227N>G | p.Glu76Gly | p.E76G | P04080 | protein_coding | tolerated(0.05) | possibly_damaging(0.825) | TCGA-ED-A4XI-01 | Liver | liver hepatocellular carcinoma | Male | <65 | I/II | Unknown | Unknown | SD | |
| CSTB | SNV | Missense_Mutation | novel | c.217N>G | p.Leu73Val | p.L73V | P04080 | protein_coding | deleterious(0) | probably_damaging(0.993) | TCGA-T2-A6X2-01 | Oral cavity | head & neck squamous cell carcinoma | Male | >=65 | III/IV | Unknown | Unknown | SD |
| CSTB | SNV | Missense_Mutation | c.172C>T | p.His58Tyr | p.H58Y | P04080 | protein_coding | tolerated(0.14) | possibly_damaging(0.664) | TCGA-EJ-5516-01 | Prostate | prostate adenocarcinoma | Male | <65 | 7 | Unknown | Unknown | SD |
| Page: 1 |
Top |
Related drugs of malignant transformation related genes |
| Identification of chemicals and drugs interact with genes involved in malignant transfromation |
| (DGIdb 4.0) |
| Entrez ID | Symbol | Category | Interaction Types | Drug Claim Name | Drug Name | PMIDs |
| Page: 1 |

Copyright 2023-Present -The University of Texas Health Science Center at Houston |