
|
|||||
|
 | |
| |
| |
| |
| |
| |
|
Gene: CSTA |
Gene summary for CSTA |
| Gene information | Species | Human | Gene symbol | CSTA | Gene ID | 1475 |
| Gene name | cystatin A | |
| Gene Alias | AREI | |
| Cytomap | 3q21.1 | |
| Gene Type | protein-coding | GO ID | GO:0006464 | UniProtAcc | P01040 |
Top |
Malignant transformation analysis |
| Identification of the aberrant gene expression in precancerous and cancerous lesions by comparing the gene expression of stem-like cells in diseased tissues with normal stem cells |
| Entrez ID | Symbol | Replicates | Species | Organ | Tissue | Adj P-value | Log2FC | Malignancy |
| 1475 | CSTA | GSM4909282 | Human | Breast | IDC | 4.54e-27 | 6.99e-01 | -0.0288 |
| 1475 | CSTA | GSM4909285 | Human | Breast | IDC | 6.26e-09 | 1.39e-01 | 0.21 |
| 1475 | CSTA | GSM4909290 | Human | Breast | IDC | 1.05e-03 | 2.55e-01 | 0.2096 |
| 1475 | CSTA | GSM4909294 | Human | Breast | IDC | 8.66e-14 | 5.91e-01 | 0.2022 |
| 1475 | CSTA | DCIS2 | Human | Breast | DCIS | 3.94e-09 | -1.69e-02 | 0.0085 |
| 1475 | CSTA | CA_HPV_1 | Human | Cervix | CC | 5.74e-03 | -1.46e-01 | 0.0264 |
| 1475 | CSTA | N_HPV_2 | Human | Cervix | N_HPV | 4.41e-12 | 5.93e-01 | -0.0131 |
| 1475 | CSTA | Tumor | Human | Cervix | CC | 5.51e-60 | 1.19e+00 | 0.1241 |
| 1475 | CSTA | sample3 | Human | Cervix | CC | 3.31e-77 | 1.24e+00 | 0.1387 |
| 1475 | CSTA | H2 | Human | Cervix | HSIL_HPV | 1.09e-03 | 3.50e-01 | 0.0632 |
| 1475 | CSTA | L1 | Human | Cervix | CC | 6.38e-21 | 8.64e-01 | 0.0802 |
| 1475 | CSTA | T3 | Human | Cervix | CC | 3.81e-64 | 1.24e+00 | 0.1389 |
| 1475 | CSTA | LZE2T | Human | Esophagus | ESCC | 1.46e-06 | 1.41e+00 | 0.082 |
| 1475 | CSTA | LZE5T | Human | Esophagus | ESCC | 1.18e-06 | 1.15e-01 | 0.0514 |
| 1475 | CSTA | LZE8T | Human | Esophagus | ESCC | 5.90e-13 | 1.18e+00 | 0.067 |
| 1475 | CSTA | LZE20T | Human | Esophagus | ESCC | 6.40e-20 | 1.84e+00 | 0.0662 |
| 1475 | CSTA | LZE22D1 | Human | Esophagus | HGIN | 1.15e-09 | 1.82e+00 | 0.0595 |
| 1475 | CSTA | LZE22T | Human | Esophagus | ESCC | 4.48e-07 | 1.34e+00 | 0.068 |
| 1475 | CSTA | LZE24T | Human | Esophagus | ESCC | 1.49e-03 | 7.34e-01 | 0.0596 |
| 1475 | CSTA | LZE21T | Human | Esophagus | ESCC | 1.95e-09 | 1.91e+00 | 0.0655 |
| Page: 1 2 3 4 5 6 7 |
| Tissue | Expression Dynamics | Abbreviation |
| Breast | 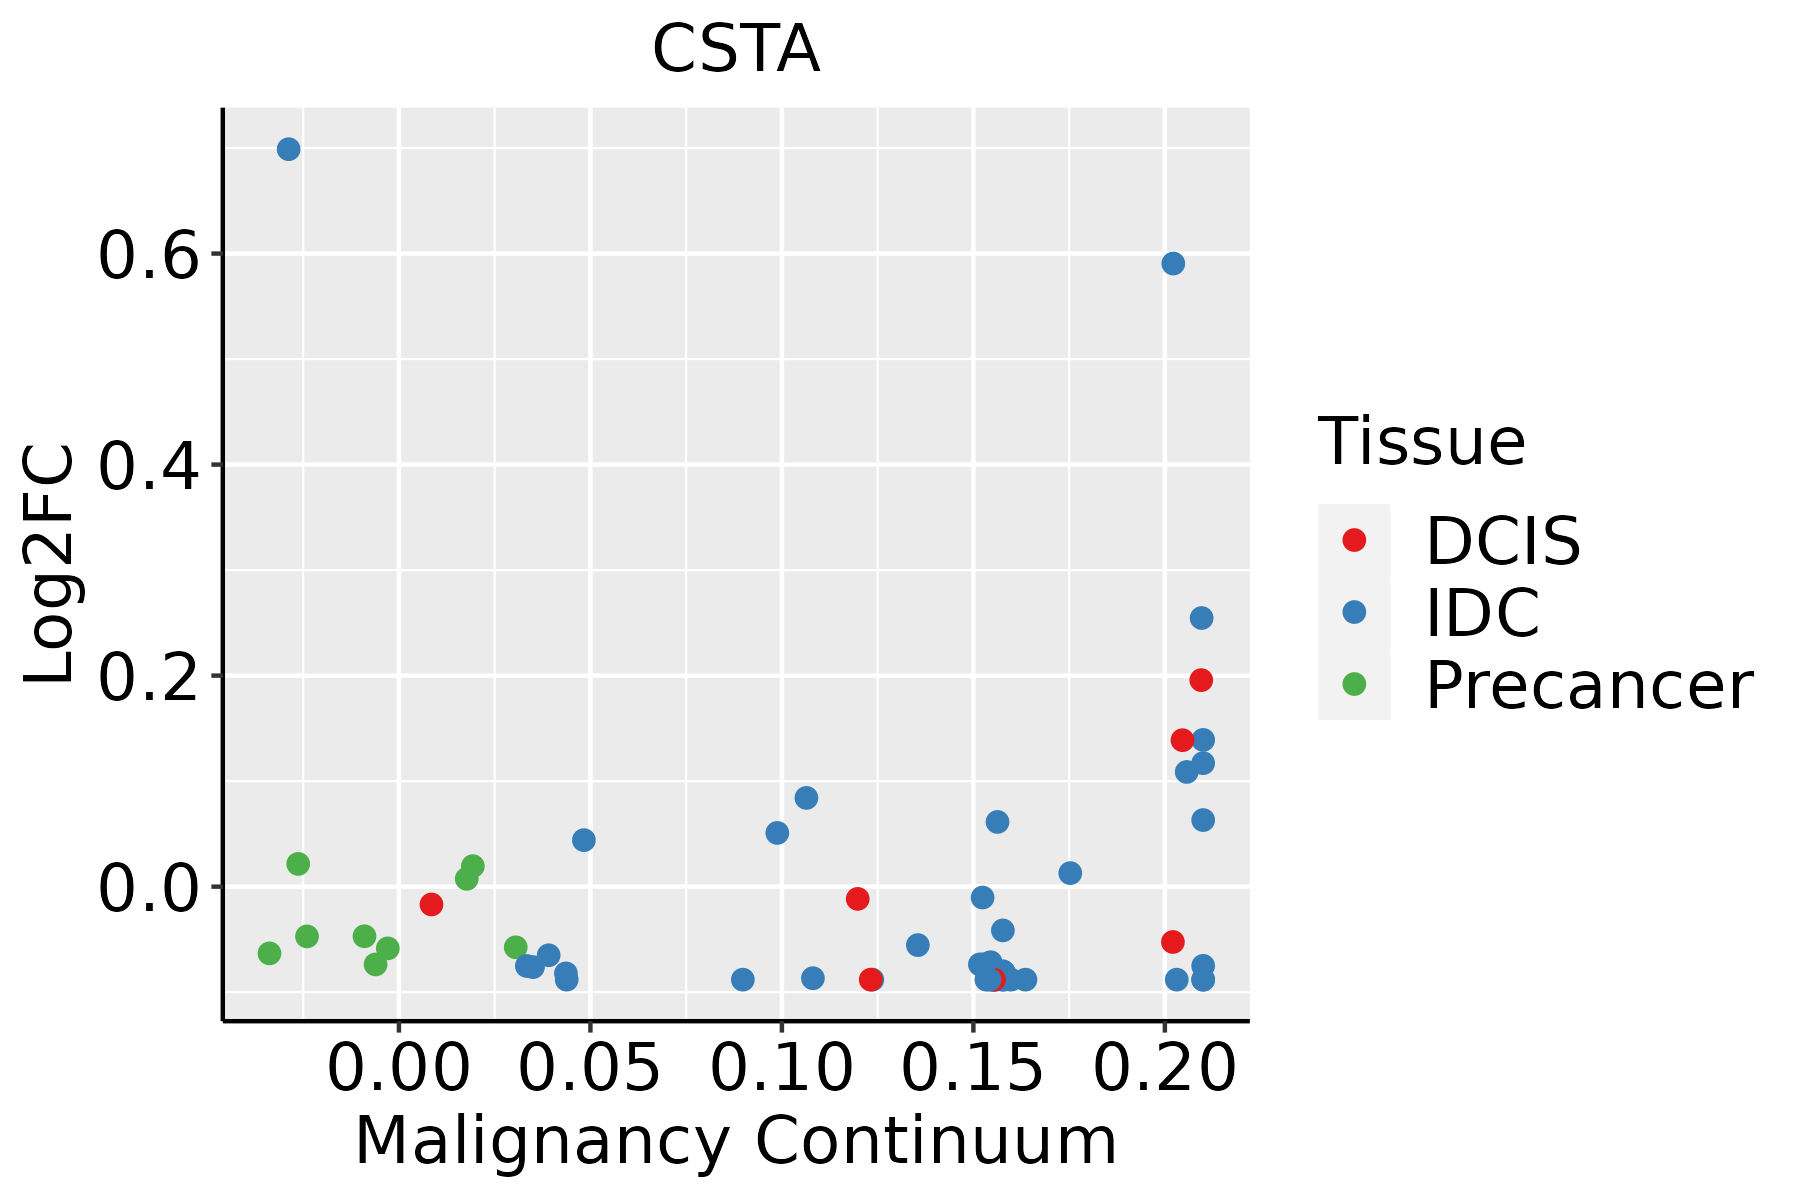 | IDC: Invasive ductal carcinoma |
| DCIS: Ductal carcinoma in situ | ||
| Precancer(BRCA1-mut): Precancerous lesion from BRCA1 mutation carriers | ||
| Cervix | 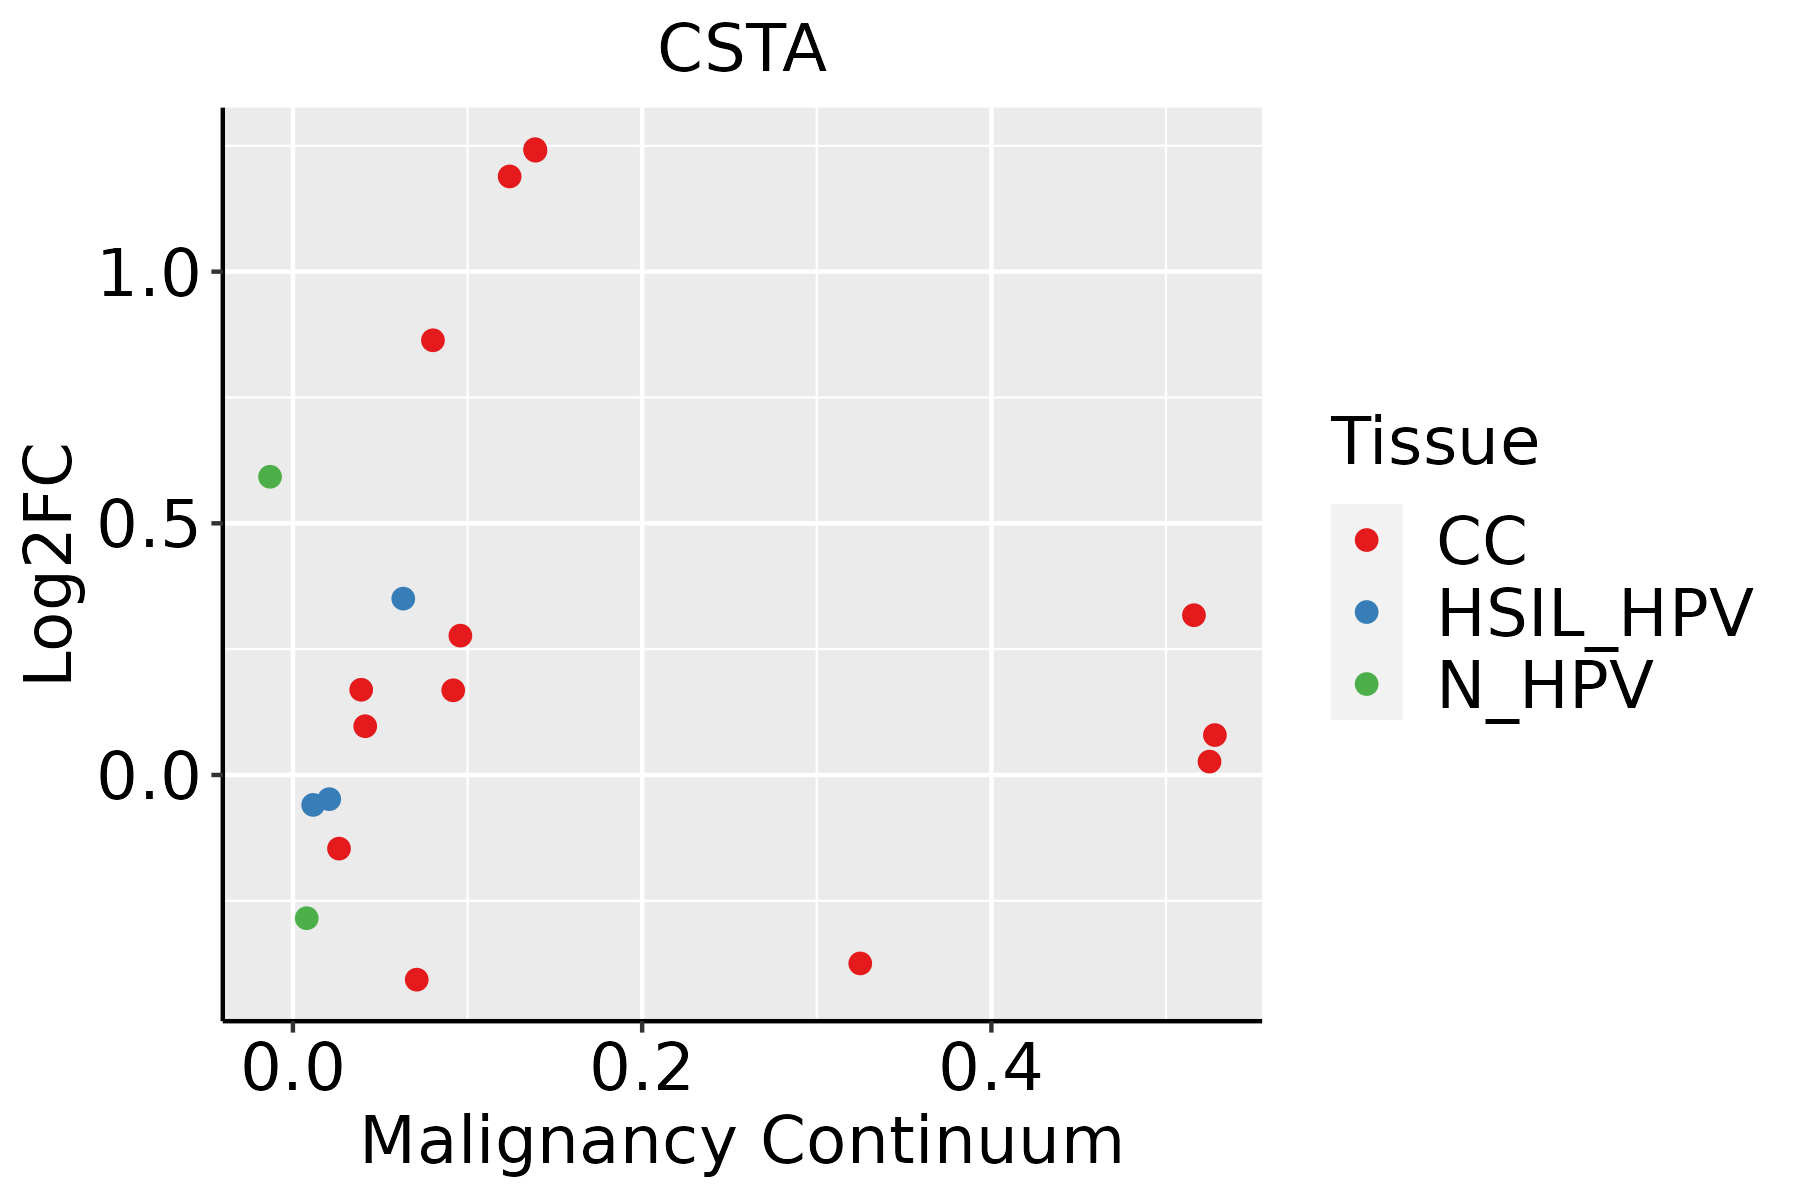 | CC: Cervix cancer |
| HSIL_HPV: HPV-infected high-grade squamous intraepithelial lesions | ||
| N_HPV: HPV-infected normal cervix | ||
| Esophagus | 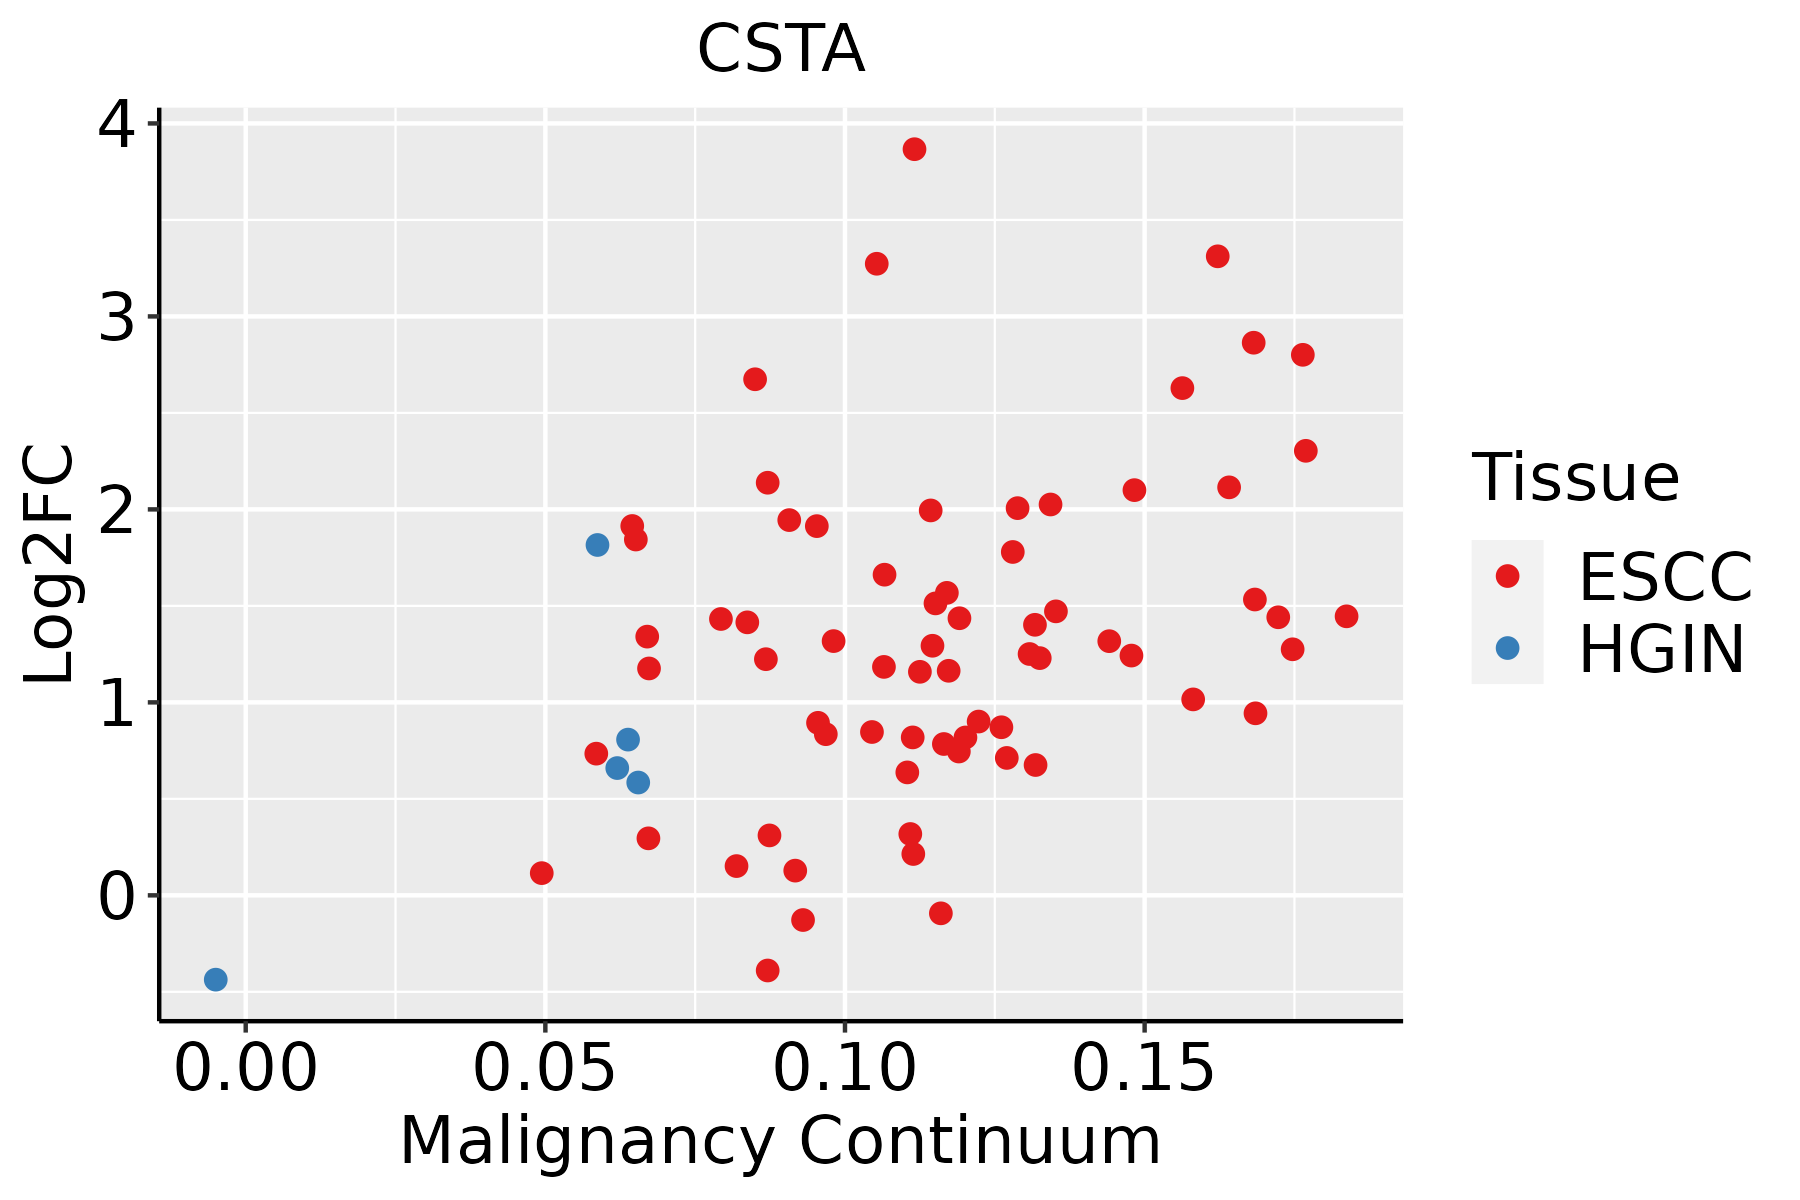 | ESCC: Esophageal squamous cell carcinoma |
| HGIN: High-grade intraepithelial neoplasias | ||
| LGIN: Low-grade intraepithelial neoplasias | ||
| Liver | 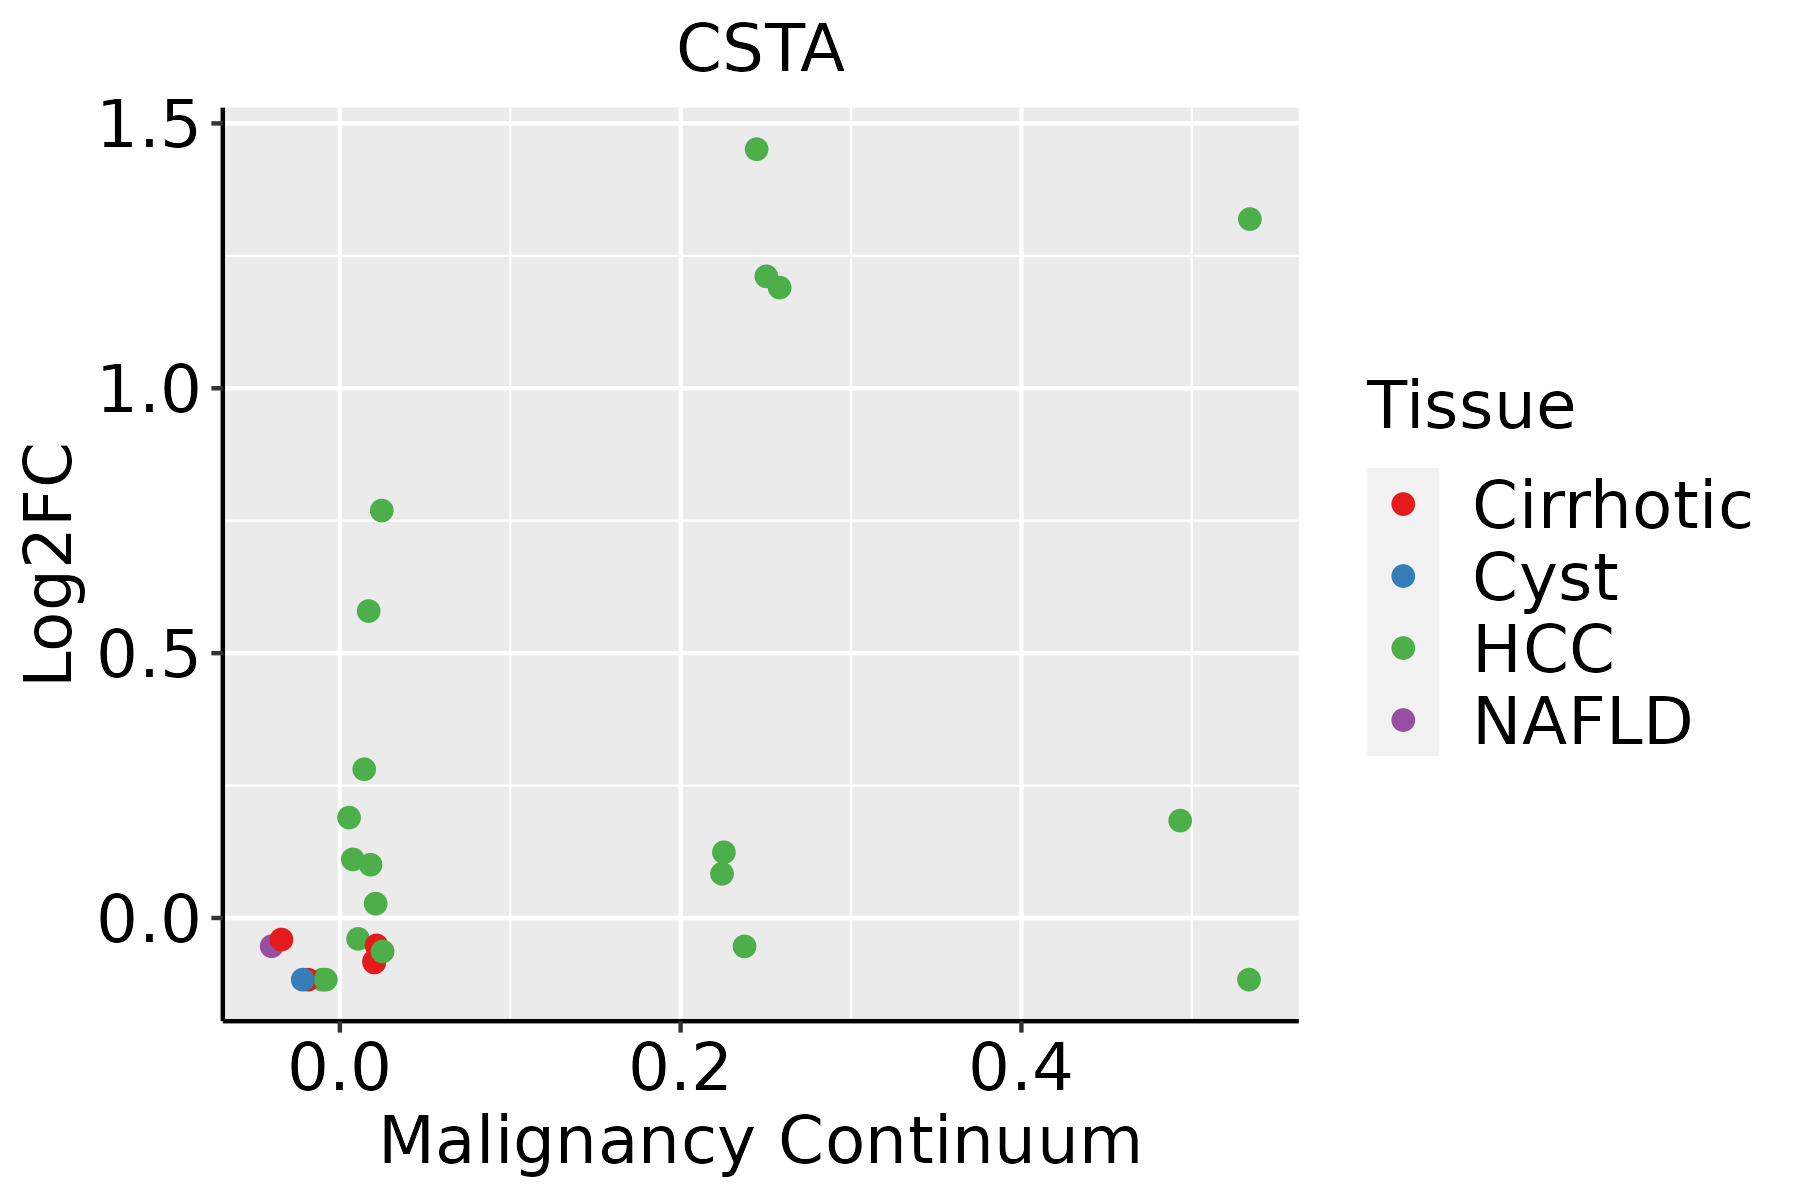 | HCC: Hepatocellular carcinoma |
| NAFLD: Non-alcoholic fatty liver disease | ||
| Oral Cavity | 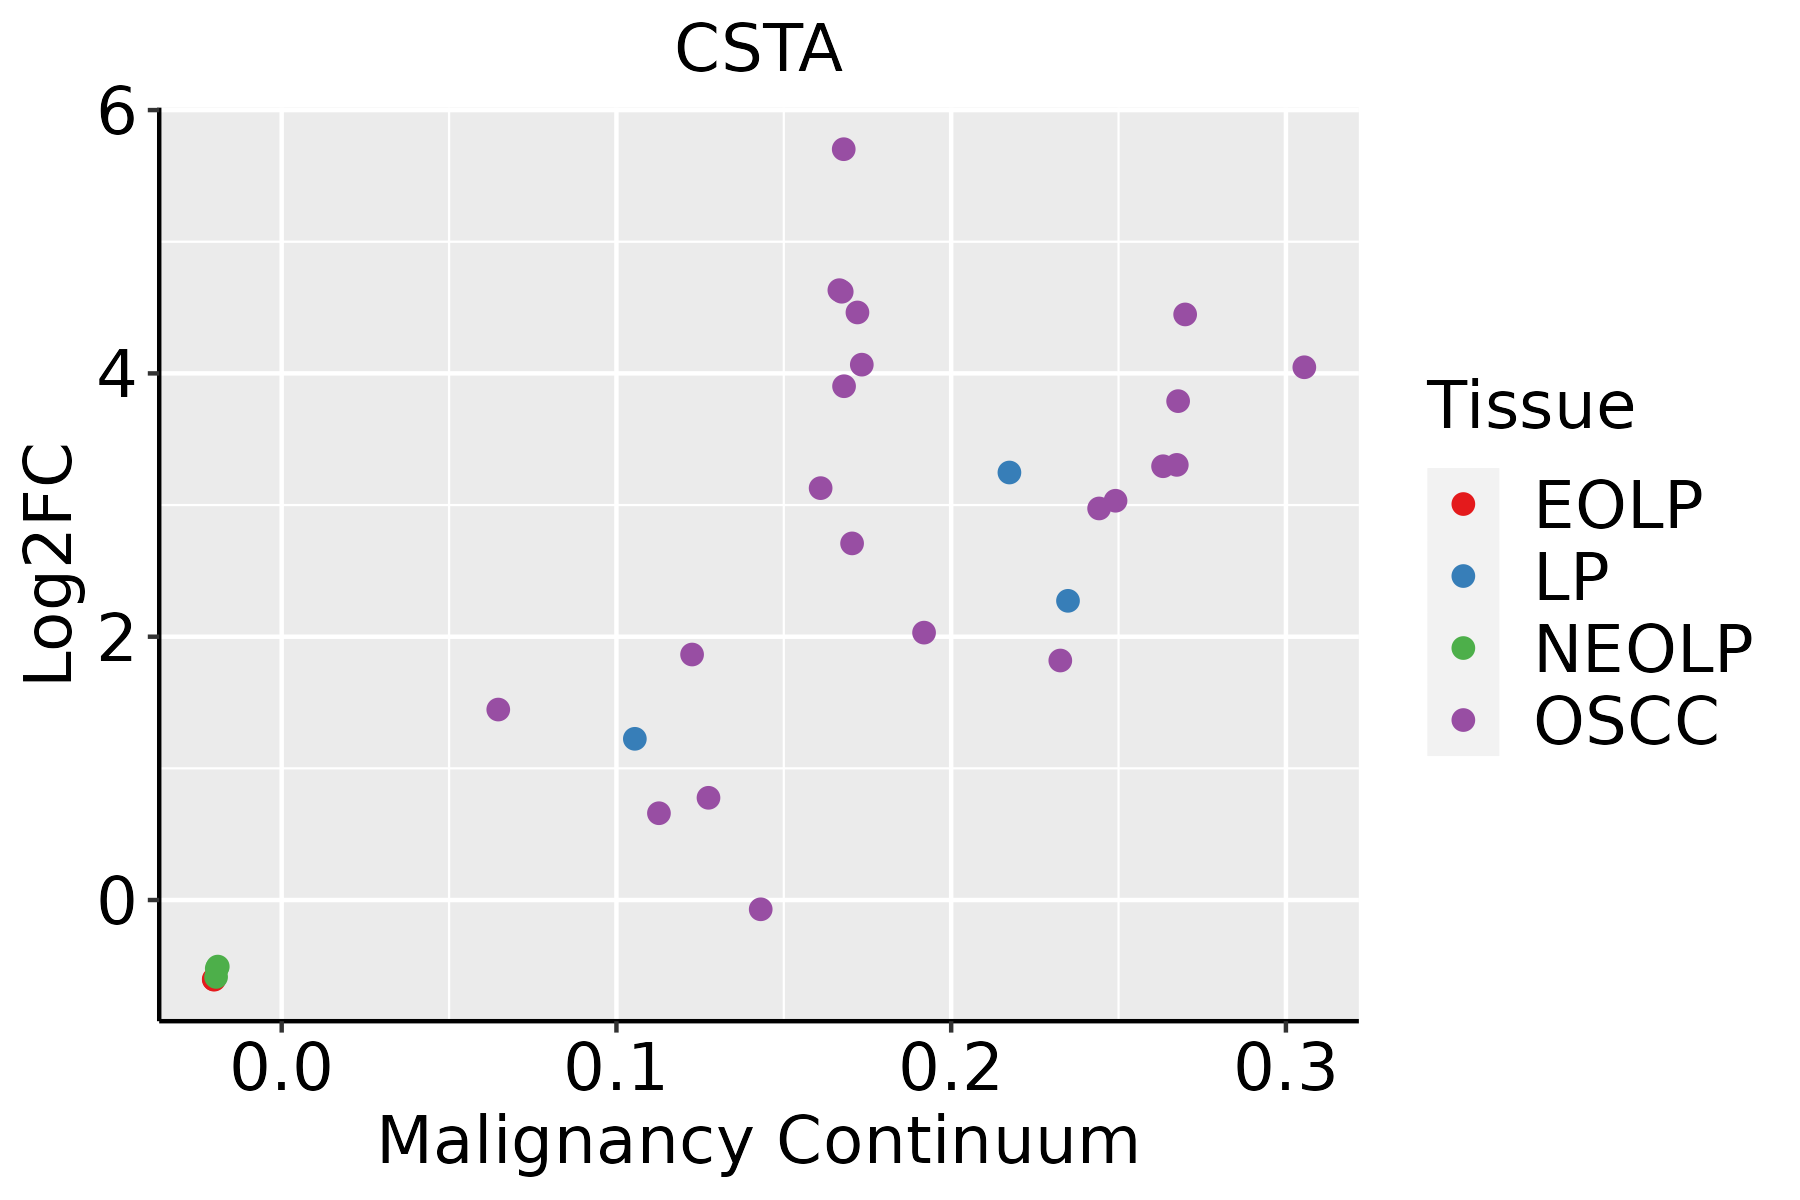 | EOLP: Erosive Oral lichen planus |
| LP: leukoplakia | ||
| NEOLP: Non-erosive oral lichen planus | ||
| OSCC: Oral squamous cell carcinoma | ||
| Prostate |  | BPH: Benign Prostatic Hyperplasia |
| Skin | 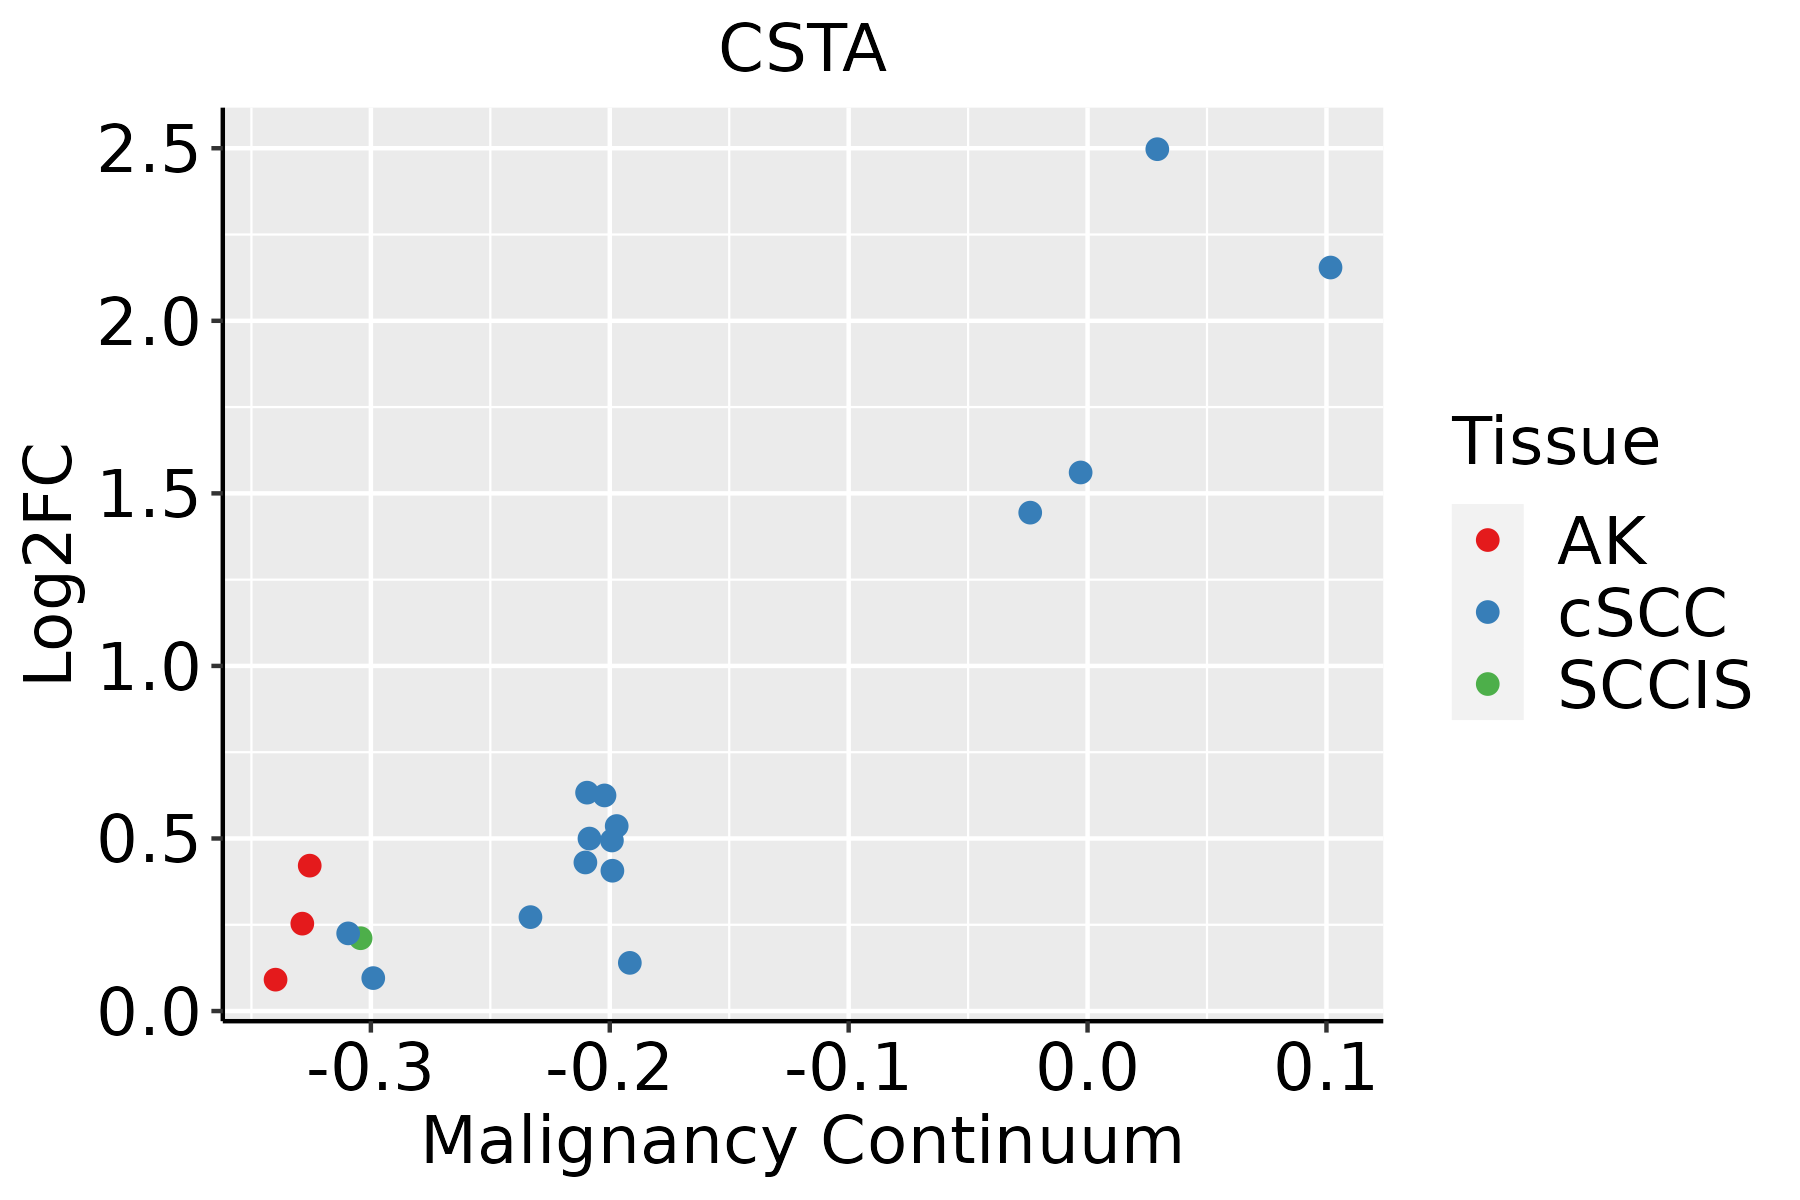 | AK: Actinic keratosis |
| cSCC: Cutaneous squamous cell carcinoma | ||
| SCCIS:squamous cell carcinoma in situ | ||
| Thyroid | 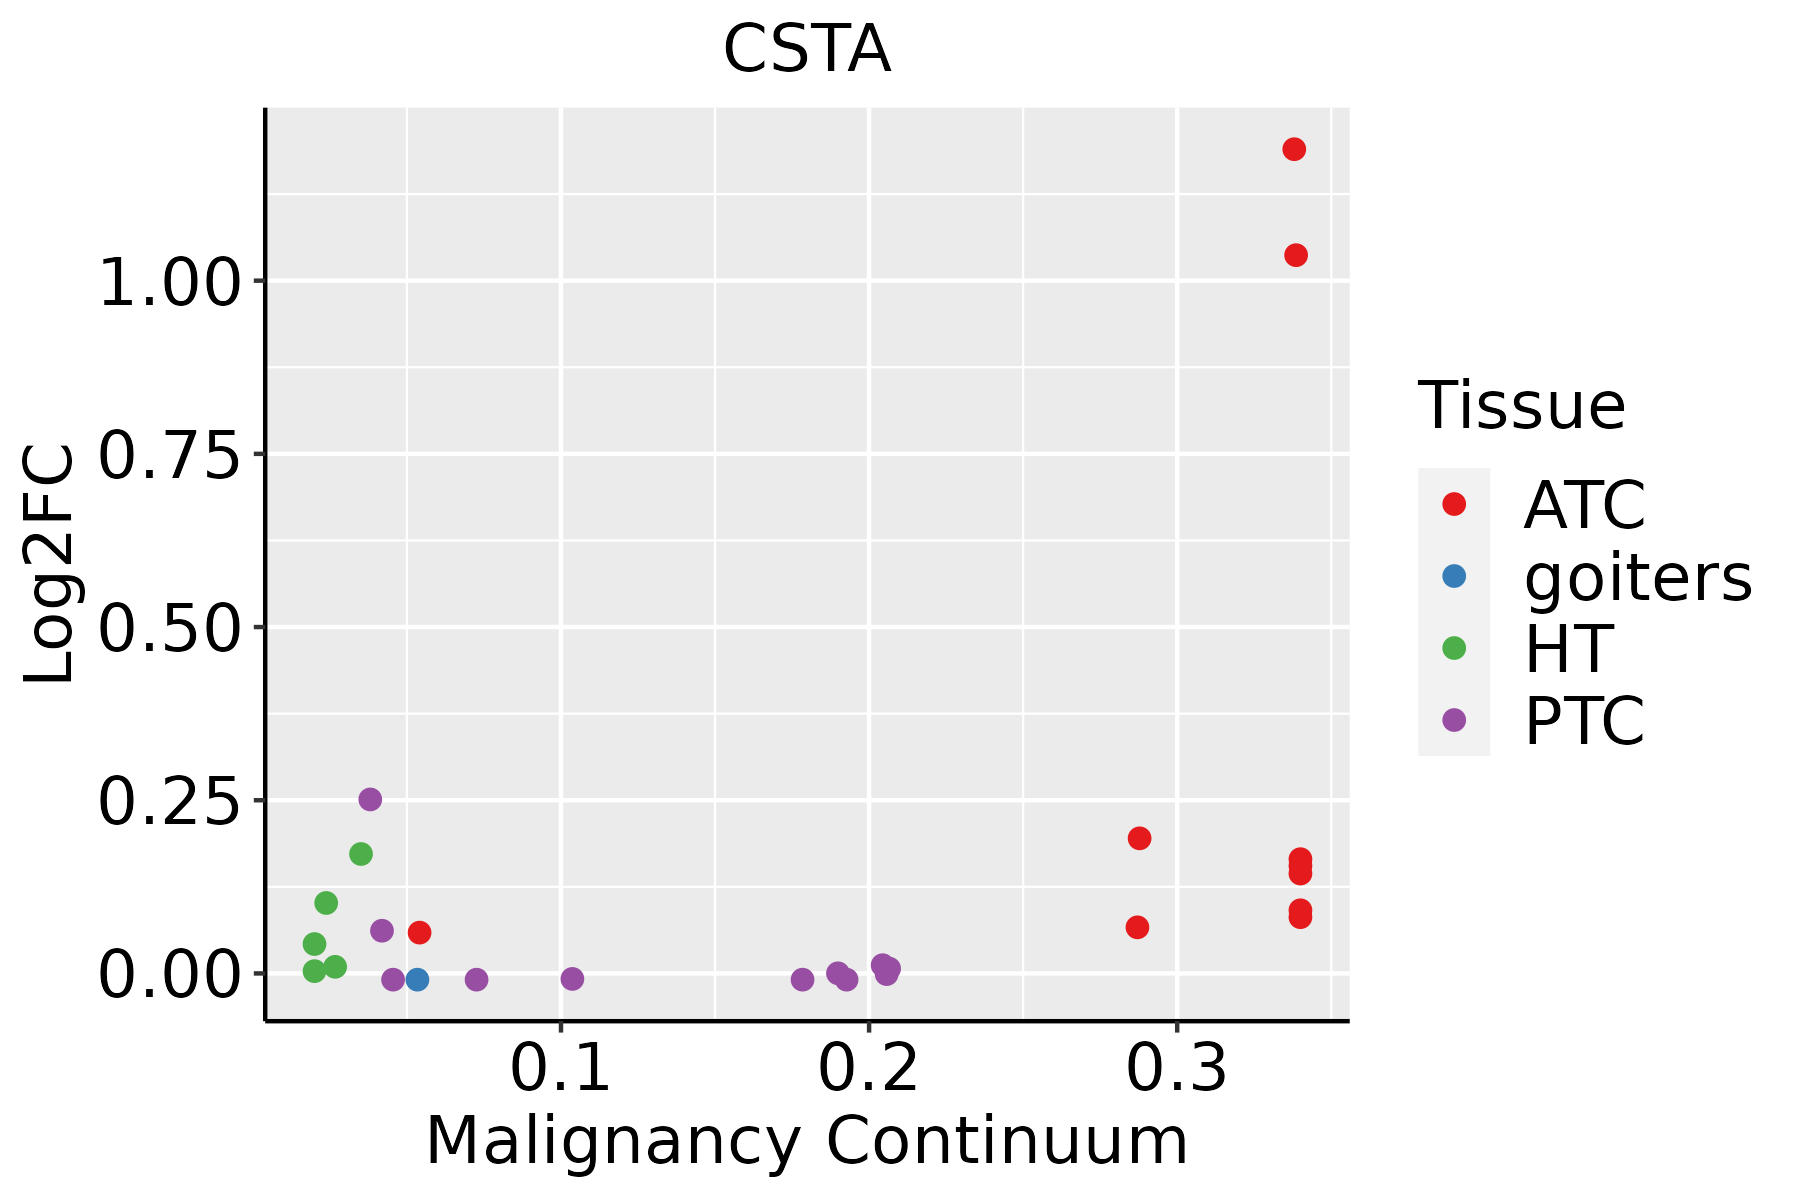 | ATC: Anaplastic thyroid cancer |
| HT: Hashimoto's thyroiditis | ||
| PTC: Papillary thyroid cancer |
| ∗log2FC in expression of this searched gene in stem-like cells from each diseased tissue sample relative to stem-like cells in normal samples in each tissue plotted against the malignancy continuum. Samples are colored based on if they are from different disease stage. |
Top |
Malignant transformation related pathway analysis |
| Find out the enriched GO biological processes and KEGG pathways involved in transition from healthy to precancer to cancer |
| Tissue | Disease Stage | Enriched GO biological Processes |
| Colorectum | AD |  |
| Colorectum | SER |  |
| Colorectum | MSS |  |
| Colorectum | MSI-H |  |
| Colorectum | FAP |  |
| ∗Top 15 enriched GO BP terms are showed in the bar plot of each disease state in each tissue. Each row represents a significant GO biological process which is colored according to the -log10(p.adjust). |
| Page: 1 2 3 4 5 6 7 8 9 |
| GO ID | Tissue | Disease Stage | Description | Gene Ratio | Bg Ratio | pvalue | p.adjust | Count |
| GO:005254714 | Breast | IDC | regulation of peptidase activity | 96/1434 | 461/18723 | 7.58e-20 | 6.15e-17 | 96 |
| GO:005254814 | Breast | IDC | regulation of endopeptidase activity | 88/1434 | 432/18723 | 1.20e-17 | 4.85e-15 | 88 |
| GO:004586114 | Breast | IDC | negative regulation of proteolysis | 70/1434 | 351/18723 | 8.21e-14 | 2.22e-11 | 70 |
| GO:005134613 | Breast | IDC | negative regulation of hydrolase activity | 71/1434 | 379/18723 | 1.33e-12 | 2.90e-10 | 71 |
| GO:001046613 | Breast | IDC | negative regulation of peptidase activity | 56/1434 | 262/18723 | 1.39e-12 | 2.92e-10 | 56 |
| GO:001095112 | Breast | IDC | negative regulation of endopeptidase activity | 52/1434 | 252/18723 | 3.53e-11 | 5.57e-09 | 52 |
| GO:000854412 | Breast | IDC | epidermis development | 41/1434 | 324/18723 | 1.03e-03 | 1.14e-02 | 41 |
| GO:000991312 | Breast | IDC | epidermal cell differentiation | 28/1434 | 202/18723 | 1.62e-03 | 1.60e-02 | 28 |
| GO:00302161 | Breast | IDC | keratinocyte differentiation | 21/1434 | 139/18723 | 2.06e-03 | 1.95e-02 | 21 |
| GO:00435883 | Breast | IDC | skin development | 33/1434 | 263/18723 | 3.46e-03 | 2.87e-02 | 33 |
| GO:0018149 | Breast | IDC | peptide cross-linking | 8/1434 | 35/18723 | 4.22e-03 | 3.31e-02 | 8 |
| GO:005254723 | Breast | DCIS | regulation of peptidase activity | 88/1390 | 461/18723 | 1.18e-16 | 4.78e-14 | 88 |
| GO:005254823 | Breast | DCIS | regulation of endopeptidase activity | 83/1390 | 432/18723 | 6.07e-16 | 2.15e-13 | 83 |
| GO:004586123 | Breast | DCIS | negative regulation of proteolysis | 63/1390 | 351/18723 | 4.39e-11 | 6.06e-09 | 63 |
| GO:005134623 | Breast | DCIS | negative regulation of hydrolase activity | 64/1390 | 379/18723 | 4.32e-10 | 4.80e-08 | 64 |
| GO:001046622 | Breast | DCIS | negative regulation of peptidase activity | 49/1390 | 262/18723 | 1.54e-09 | 1.43e-07 | 49 |
| GO:001095122 | Breast | DCIS | negative regulation of endopeptidase activity | 47/1390 | 252/18723 | 3.63e-09 | 3.11e-07 | 47 |
| GO:000854422 | Breast | DCIS | epidermis development | 40/1390 | 324/18723 | 1.05e-03 | 1.16e-02 | 40 |
| GO:000991322 | Breast | DCIS | epidermal cell differentiation | 27/1390 | 202/18723 | 2.11e-03 | 1.97e-02 | 27 |
| GO:00302162 | Breast | DCIS | keratinocyte differentiation | 20/1390 | 139/18723 | 3.24e-03 | 2.74e-02 | 20 |
| Page: 1 2 3 4 5 6 7 8 9 |
| Pathway ID | Tissue | Disease Stage | Description | Gene Ratio | Bg Ratio | pvalue | p.adjust | qvalue | Count |
| Page: 1 |
Top |
Cell-cell communication analysis |
| Identification of potential cell-cell interactions between two cell types and their ligand-receptor pairs for different disease states |
| Ligand | Receptor | LRpair | Pathway | Tissue | Disease Stage |
| Page: 1 |
Top |
Single-cell gene regulatory network inference analysis |
| Find out the significant the regulons (TFs) and the target genes of each regulon across cell types for different disease states |
| TF | Cell Type | Tissue | Disease Stage | Target Gene | RSS | Regulon Activity |
| ∗The dot plots of a searched regulon are shown for all cell subpopulations in each disease state of each tissue based on the regulon specific score inferred using pySCENIC and by calculating the average expression. |
| Page: 1 |
Top |
Somatic mutation of malignant transformation related genes |
| Annotation of somatic variants for genes involved in malignant transformation |
| Hugo Symbol | Variant Class | Variant Classification | dbSNP RS | HGVSc | HGVSp | HGVSp Short | SWISSPROT | BIOTYPE | SIFT | PolyPhen | Tumor Sample Barcode | Tissue | Histology | Sex | Age | Stage | Therapy Types | Drugs | Outcome |
| CSTA | insertion | Frame_Shift_Ins | novel | c.290_291insGCACAATCTCGGCTCTCTGCGACCTCCACCT | p.Phe98HisfsTer27 | p.F98Hfs*27 | P01040 | protein_coding | TCGA-A8-A07U-01 | Breast | breast invasive carcinoma | Female | >=65 | III/IV | Chemotherapy | 5-fluorouracil | SD | ||
| CSTA | SNV | Missense_Mutation | novel | c.210N>A | p.Phe70Leu | p.F70L | P01040 | protein_coding | deleterious(0.03) | benign(0.015) | TCGA-F5-6814-01 | Colorectum | rectum adenocarcinoma | Male | <65 | I/II | Unknown | Unknown | SD |
| CSTA | SNV | Missense_Mutation | rs200946159 | c.125N>G | p.Gln42Arg | p.Q42R | P01040 | protein_coding | tolerated(0.07) | benign(0) | TCGA-AP-A1DR-01 | Endometrium | uterine corpus endometrioid carcinoma | Female | <65 | III/IV | Chemotherapy | cisplatin | SD |
| CSTA | SNV | Missense_Mutation | novel | c.107N>T | p.Gly36Val | p.G36V | P01040 | protein_coding | tolerated(0.1) | benign(0.015) | TCGA-AP-A1DV-01 | Endometrium | uterine corpus endometrioid carcinoma | Female | <65 | I/II | Unknown | Unknown | SD |
| CSTA | SNV | Missense_Mutation | c.209N>G | p.Phe70Cys | p.F70C | P01040 | protein_coding | deleterious(0) | possibly_damaging(0.905) | TCGA-DF-A2KU-01 | Endometrium | uterine corpus endometrioid carcinoma | Female | Unknown | I/II | Unknown | Unknown | SD | |
| CSTA | SNV | Missense_Mutation | novel | c.7C>A | p.Pro3Thr | p.P3T | P01040 | protein_coding | tolerated(0.62) | benign(0.044) | TCGA-E6-A1LX-01 | Endometrium | uterine corpus endometrioid carcinoma | Female | <65 | I/II | Unknown | Unknown | SD |
| CSTA | insertion | Frame_Shift_Ins | novel | c.85_86insA | p.Thr31AsnfsTer3 | p.T31Nfs*3 | P01040 | protein_coding | TCGA-AX-A0J0-01 | Endometrium | uterine corpus endometrioid carcinoma | Female | <65 | I/II | Unknown | Unknown | SD | ||
| CSTA | SNV | Missense_Mutation | c.205G>A | p.Val69Ile | p.V69I | P01040 | protein_coding | tolerated(0.13) | benign(0.013) | TCGA-86-8073-01 | Lung | lung adenocarcinoma | Male | <65 | I/II | Unknown | Unknown | SD |
| Page: 1 |
Top |
Related drugs of malignant transformation related genes |
| Identification of chemicals and drugs interact with genes involved in malignant transfromation |
| (DGIdb 4.0) |
| Entrez ID | Symbol | Category | Interaction Types | Drug Claim Name | Drug Name | PMIDs |
| Page: 1 |

Copyright 2023-Present -The University of Texas Health Science Center at Houston |