
|
|||||
|
 | |
| |
| |
| |
| |
| |
|
Gene: CST7 |
Gene summary for CST7 |
| Gene information | Species | Human | Gene symbol | CST7 | Gene ID | 8530 |
| Gene name | cystatin F | |
| Gene Alias | CMAP | |
| Cytomap | 20p11.21 | |
| Gene Type | protein-coding | GO ID | GO:0001774 | UniProtAcc | O76096 |
Top |
Malignant transformation analysis |
| Identification of the aberrant gene expression in precancerous and cancerous lesions by comparing the gene expression of stem-like cells in diseased tissues with normal stem cells |
| Entrez ID | Symbol | Replicates | Species | Organ | Tissue | Adj P-value | Log2FC | Malignancy |
| 8530 | CST7 | LZE4T | Human | Esophagus | ESCC | 1.58e-03 | 4.32e-01 | 0.0811 |
| 8530 | CST7 | LZE7T | Human | Esophagus | ESCC | 6.02e-07 | 9.22e-01 | 0.0667 |
| 8530 | CST7 | LZE6T | Human | Esophagus | ESCC | 4.79e-15 | 8.90e-01 | 0.0845 |
| 8530 | CST7 | P5T-E | Human | Esophagus | ESCC | 6.99e-05 | 2.76e-02 | 0.1327 |
| 8530 | CST7 | C21 | Human | Oral cavity | OSCC | 2.08e-16 | 7.78e-01 | 0.2678 |
| 8530 | CST7 | C30 | Human | Oral cavity | OSCC | 7.32e-07 | 4.75e-01 | 0.3055 |
| 8530 | CST7 | C38 | Human | Oral cavity | OSCC | 9.42e-05 | 7.17e-01 | 0.172 |
| 8530 | CST7 | C51 | Human | Oral cavity | OSCC | 8.20e-04 | 1.70e-01 | 0.2674 |
| 8530 | CST7 | C06 | Human | Oral cavity | OSCC | 7.91e-03 | 8.64e-01 | 0.2699 |
| 8530 | CST7 | C07 | Human | Oral cavity | OSCC | 1.84e-05 | 8.96e-01 | 0.2491 |
| 8530 | CST7 | C08 | Human | Oral cavity | OSCC | 1.43e-03 | 1.56e-01 | 0.1919 |
| 8530 | CST7 | C09 | Human | Oral cavity | OSCC | 1.11e-07 | 1.77e-01 | 0.1431 |
| 8530 | CST7 | LN46 | Human | Oral cavity | OSCC | 8.04e-04 | 1.85e-01 | 0.1666 |
| 8530 | CST7 | LP15 | Human | Oral cavity | LP | 1.04e-02 | 2.93e-01 | 0.2174 |
| Page: 1 |
| Tissue | Expression Dynamics | Abbreviation |
| Esophagus | 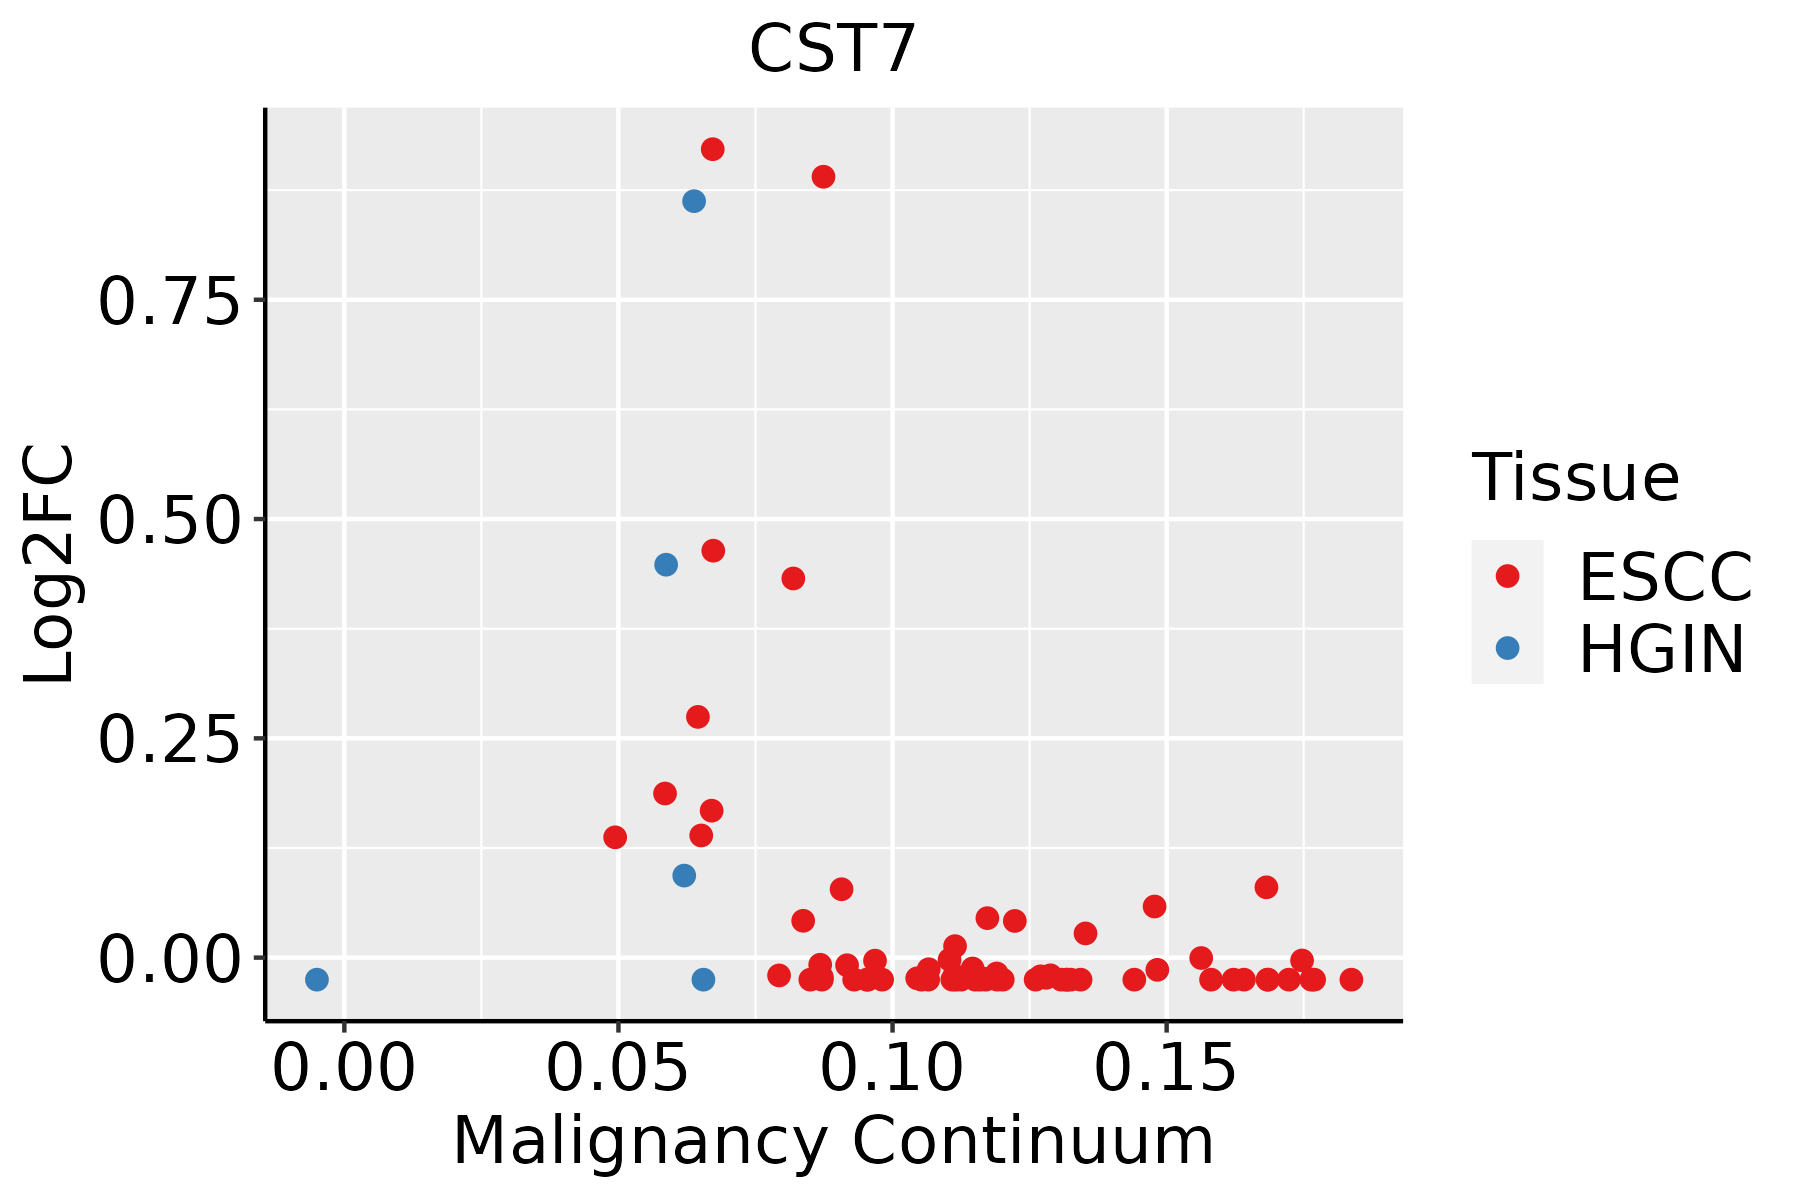 | ESCC: Esophageal squamous cell carcinoma |
| HGIN: High-grade intraepithelial neoplasias | ||
| LGIN: Low-grade intraepithelial neoplasias | ||
| Oral Cavity |  | EOLP: Erosive Oral lichen planus |
| LP: leukoplakia | ||
| NEOLP: Non-erosive oral lichen planus | ||
| OSCC: Oral squamous cell carcinoma |
| ∗log2FC in expression of this searched gene in stem-like cells from each diseased tissue sample relative to stem-like cells in normal samples in each tissue plotted against the malignancy continuum. Samples are colored based on if they are from different disease stage. |
Top |
Malignant transformation related pathway analysis |
| Find out the enriched GO biological processes and KEGG pathways involved in transition from healthy to precancer to cancer |
| Tissue | Disease Stage | Enriched GO biological Processes |
| Colorectum | AD |  |
| Colorectum | SER |  |
| Colorectum | MSS |  |
| Colorectum | MSI-H |  |
| Colorectum | FAP |  |
| ∗Top 15 enriched GO BP terms are showed in the bar plot of each disease state in each tissue. Each row represents a significant GO biological process which is colored according to the -log10(p.adjust). |
| Page: 1 2 3 4 5 6 7 8 9 |
| GO ID | Tissue | Disease Stage | Description | Gene Ratio | Bg Ratio | pvalue | p.adjust | Count |
| GO:2000116111 | Esophagus | ESCC | regulation of cysteine-type endopeptidase activity | 158/8552 | 235/18723 | 1.67e-11 | 5.90e-10 | 158 |
| GO:005160418 | Esophagus | ESCC | protein maturation | 189/8552 | 294/18723 | 7.64e-11 | 2.39e-09 | 189 |
| GO:0052547111 | Esophagus | ESCC | regulation of peptidase activity | 275/8552 | 461/18723 | 7.54e-10 | 1.88e-08 | 275 |
| GO:0052548111 | Esophagus | ESCC | regulation of endopeptidase activity | 253/8552 | 432/18723 | 3.68e-08 | 6.78e-07 | 253 |
| GO:2000117110 | Esophagus | ESCC | negative regulation of cysteine-type endopeptidase activity | 63/8552 | 86/18723 | 1.84e-07 | 2.88e-06 | 63 |
| GO:001648514 | Esophagus | ESCC | protein processing | 134/8552 | 225/18723 | 1.81e-05 | 1.60e-04 | 134 |
| GO:00425524 | Esophagus | ESCC | myelination | 85/8552 | 134/18723 | 2.51e-05 | 2.13e-04 | 85 |
| GO:00072724 | Esophagus | ESCC | ensheathment of neurons | 86/8552 | 136/18723 | 2.68e-05 | 2.24e-04 | 86 |
| GO:00083664 | Esophagus | ESCC | axon ensheathment | 86/8552 | 136/18723 | 2.68e-05 | 2.24e-04 | 86 |
| GO:0045861111 | Esophagus | ESCC | negative regulation of proteolysis | 195/8552 | 351/18723 | 1.13e-04 | 7.85e-04 | 195 |
| GO:0051346110 | Esophagus | ESCC | negative regulation of hydrolase activity | 208/8552 | 379/18723 | 1.76e-04 | 1.14e-03 | 208 |
| GO:00519606 | Esophagus | ESCC | regulation of nervous system development | 237/8552 | 443/18723 | 5.02e-04 | 2.78e-03 | 237 |
| GO:000268316 | Esophagus | ESCC | negative regulation of immune system process | 231/8552 | 434/18723 | 8.48e-04 | 4.36e-03 | 231 |
| GO:0031641 | Esophagus | ESCC | regulation of myelination | 31/8552 | 47/18723 | 4.01e-03 | 1.62e-02 | 31 |
| GO:001046620 | Esophagus | ESCC | negative regulation of peptidase activity | 140/8552 | 262/18723 | 6.73e-03 | 2.46e-02 | 140 |
| GO:001095119 | Esophagus | ESCC | negative regulation of endopeptidase activity | 135/8552 | 252/18723 | 6.86e-03 | 2.51e-02 | 135 |
| GO:001095511 | Esophagus | ESCC | negative regulation of protein processing | 20/8552 | 29/18723 | 9.66e-03 | 3.34e-02 | 20 |
| GO:190331811 | Esophagus | ESCC | negative regulation of protein maturation | 20/8552 | 29/18723 | 9.66e-03 | 3.34e-02 | 20 |
| GO:200011620 | Oral cavity | OSCC | regulation of cysteine-type endopeptidase activity | 152/7305 | 235/18723 | 1.14e-15 | 8.13e-14 | 152 |
| GO:005254720 | Oral cavity | OSCC | regulation of peptidase activity | 255/7305 | 461/18723 | 5.78e-13 | 2.75e-11 | 255 |
| Page: 1 2 3 |
| Pathway ID | Tissue | Disease Stage | Description | Gene Ratio | Bg Ratio | pvalue | p.adjust | qvalue | Count |
| Page: 1 |
Top |
Cell-cell communication analysis |
| Identification of potential cell-cell interactions between two cell types and their ligand-receptor pairs for different disease states |
| Ligand | Receptor | LRpair | Pathway | Tissue | Disease Stage |
| Page: 1 |
Top |
Single-cell gene regulatory network inference analysis |
| Find out the significant the regulons (TFs) and the target genes of each regulon across cell types for different disease states |
| TF | Cell Type | Tissue | Disease Stage | Target Gene | RSS | Regulon Activity |
| ∗The dot plots of a searched regulon are shown for all cell subpopulations in each disease state of each tissue based on the regulon specific score inferred using pySCENIC and by calculating the average expression. |
| Page: 1 |
Top |
Somatic mutation of malignant transformation related genes |
| Annotation of somatic variants for genes involved in malignant transformation |
| Hugo Symbol | Variant Class | Variant Classification | dbSNP RS | HGVSc | HGVSp | HGVSp Short | SWISSPROT | BIOTYPE | SIFT | PolyPhen | Tumor Sample Barcode | Tissue | Histology | Sex | Age | Stage | Therapy Types | Drugs | Outcome |
| CST7 | SNV | Missense_Mutation | c.100G>C | p.Val34Leu | p.V34L | O76096 | protein_coding | tolerated(0.11) | benign(0) | TCGA-E2-A1LH-01 | Breast | breast invasive carcinoma | Female | <65 | I/II | Chemotherapy | adriamycin | SD | |
| CST7 | SNV | Missense_Mutation | rs371415469 | c.316C>T | p.Arg106Cys | p.R106C | O76096 | protein_coding | tolerated(0.05) | possibly_damaging(0.808) | TCGA-AA-3984-01 | Colorectum | colon adenocarcinoma | Female | <65 | I/II | Unknown | Unknown | SD |
| CST7 | SNV | Missense_Mutation | rs771107712 | c.247N>A | p.Val83Met | p.V83M | O76096 | protein_coding | deleterious(0) | probably_damaging(0.998) | TCGA-DM-A28H-01 | Colorectum | colon adenocarcinoma | Male | <65 | III/IV | Unknown | Unknown | PD |
| CST7 | SNV | Missense_Mutation | novel | c.121A>G | p.Thr41Ala | p.T41A | O76096 | protein_coding | tolerated(0.67) | benign(0.03) | TCGA-EI-6917-01 | Colorectum | rectum adenocarcinoma | Male | <65 | III/IV | Chemotherapy | 5fluorouracil+oxaciplatina+l-folinian | SD |
| CST7 | insertion | Frame_Shift_Ins | novel | c.68dupC | p.Asp24ArgfsTer8 | p.D24Rfs*8 | O76096 | protein_coding | TCGA-AA-A01P-01 | Colorectum | colon adenocarcinoma | Female | >=65 | III/IV | Unknown | Unknown | PD | ||
| CST7 | SNV | Missense_Mutation | c.40G>A | p.Val14Ile | p.V14I | O76096 | protein_coding | tolerated(0.24) | benign(0) | TCGA-AP-A059-01 | Endometrium | uterine corpus endometrioid carcinoma | Female | >=65 | I/II | Unknown | Unknown | SD | |
| CST7 | SNV | Missense_Mutation | novel | c.127N>G | p.Lys43Glu | p.K43E | O76096 | protein_coding | tolerated(0.14) | benign(0.006) | TCGA-D1-A175-01 | Endometrium | uterine corpus endometrioid carcinoma | Female | <65 | I/II | Chemotherapy | paclitaxel | SD |
| CST7 | SNV | Missense_Mutation | novel | c.427C>T | p.Arg143Cys | p.R143C | O76096 | protein_coding | tolerated(0.18) | benign(0.399) | TCGA-QS-A744-01 | Endometrium | uterine corpus endometrioid carcinoma | Female | >=65 | III/IV | Chemotherapy | carboplatin | SD |
| CST7 | SNV | Missense_Mutation | c.236N>C | p.Leu79Pro | p.L79P | O76096 | protein_coding | deleterious(0.01) | probably_damaging(0.933) | TCGA-18-3419-01 | Lung | lung squamous cell carcinoma | Male | >=65 | I/II | Unknown | Unknown | SD | |
| CST7 | SNV | Missense_Mutation | novel | c.126A>G | p.Ile42Met | p.I42M | O76096 | protein_coding | tolerated(0.2) | possibly_damaging(0.854) | TCGA-CN-5363-01 | Oral cavity | head & neck squamous cell carcinoma | Male | <65 | I/II | Unknown | Unknown | PD |
| Page: 1 2 |
Top |
Related drugs of malignant transformation related genes |
| Identification of chemicals and drugs interact with genes involved in malignant transfromation |
| (DGIdb 4.0) |
| Entrez ID | Symbol | Category | Interaction Types | Drug Claim Name | Drug Name | PMIDs |
| Page: 1 |

Copyright 2023-Present -The University of Texas Health Science Center at Houston |