
|
|||||
|
 | |
| |
| |
| |
| |
| |
|
Gene: CST6 |
Gene summary for CST6 |
| Gene information | Species | Human | Gene symbol | CST6 | Gene ID | 1474 |
| Gene name | cystatin E/M | |
| Gene Alias | ECTD15 | |
| Cytomap | 11q13.1 | |
| Gene Type | protein-coding | GO ID | GO:0006508 | UniProtAcc | Q15828 |
Top |
Malignant transformation analysis |
| Identification of the aberrant gene expression in precancerous and cancerous lesions by comparing the gene expression of stem-like cells in diseased tissues with normal stem cells |
| Entrez ID | Symbol | Replicates | Species | Organ | Tissue | Adj P-value | Log2FC | Malignancy |
| 1474 | CST6 | GSM4909297 | Human | Breast | IDC | 2.84e-16 | 5.63e-01 | 0.1517 |
| 1474 | CST6 | GSM4909302 | Human | Breast | IDC | 3.68e-02 | 1.84e-01 | 0.1545 |
| 1474 | CST6 | GSM4909306 | Human | Breast | IDC | 7.84e-21 | 4.93e-01 | 0.1564 |
| 1474 | CST6 | GSM4909309 | Human | Breast | IDC | 3.85e-05 | 3.20e-01 | 0.0483 |
| 1474 | CST6 | GSM4909317 | Human | Breast | IDC | 3.52e-31 | 7.36e-01 | 0.1355 |
| 1474 | CST6 | GSM4909321 | Human | Breast | IDC | 3.88e-04 | 2.66e-01 | 0.1559 |
| 1474 | CST6 | brca1 | Human | Breast | Precancer | 7.00e-15 | 4.76e-01 | -0.0338 |
| 1474 | CST6 | brca2 | Human | Breast | Precancer | 3.90e-03 | 1.25e-01 | -0.024 |
| 1474 | CST6 | DCIS2 | Human | Breast | DCIS | 9.49e-19 | 1.88e-01 | 0.0085 |
| 1474 | CST6 | sample1 | Human | Cervix | CC | 6.02e-16 | 5.93e-01 | 0.0959 |
| 1474 | CST6 | H2 | Human | Cervix | HSIL_HPV | 1.95e-04 | 3.15e-01 | 0.0632 |
| 1474 | CST6 | T1 | Human | Cervix | CC | 1.40e-21 | 5.71e-01 | 0.0918 |
| 1474 | CST6 | P26T-E | Human | Esophagus | ESCC | 1.66e-02 | 8.54e-02 | 0.1276 |
| 1474 | CST6 | P38T-E | Human | Esophagus | ESCC | 9.61e-08 | 5.30e-01 | 0.127 |
| 1474 | CST6 | P39T-E | Human | Esophagus | ESCC | 3.75e-03 | 1.66e-01 | 0.0894 |
| 1474 | CST6 | P47T-E | Human | Esophagus | ESCC | 3.97e-04 | 3.49e-01 | 0.1067 |
| 1474 | CST6 | P74T-E | Human | Esophagus | ESCC | 2.04e-39 | 1.37e+00 | 0.1479 |
| 1474 | CST6 | P75T-E | Human | Esophagus | ESCC | 3.02e-26 | 8.20e-01 | 0.1125 |
| 1474 | CST6 | P76T-E | Human | Esophagus | ESCC | 4.24e-18 | 4.20e-01 | 0.1207 |
| 1474 | CST6 | P82T-E | Human | Esophagus | ESCC | 4.19e-15 | 1.97e+00 | 0.1072 |
| Page: 1 2 3 |
| Tissue | Expression Dynamics | Abbreviation |
| Breast | 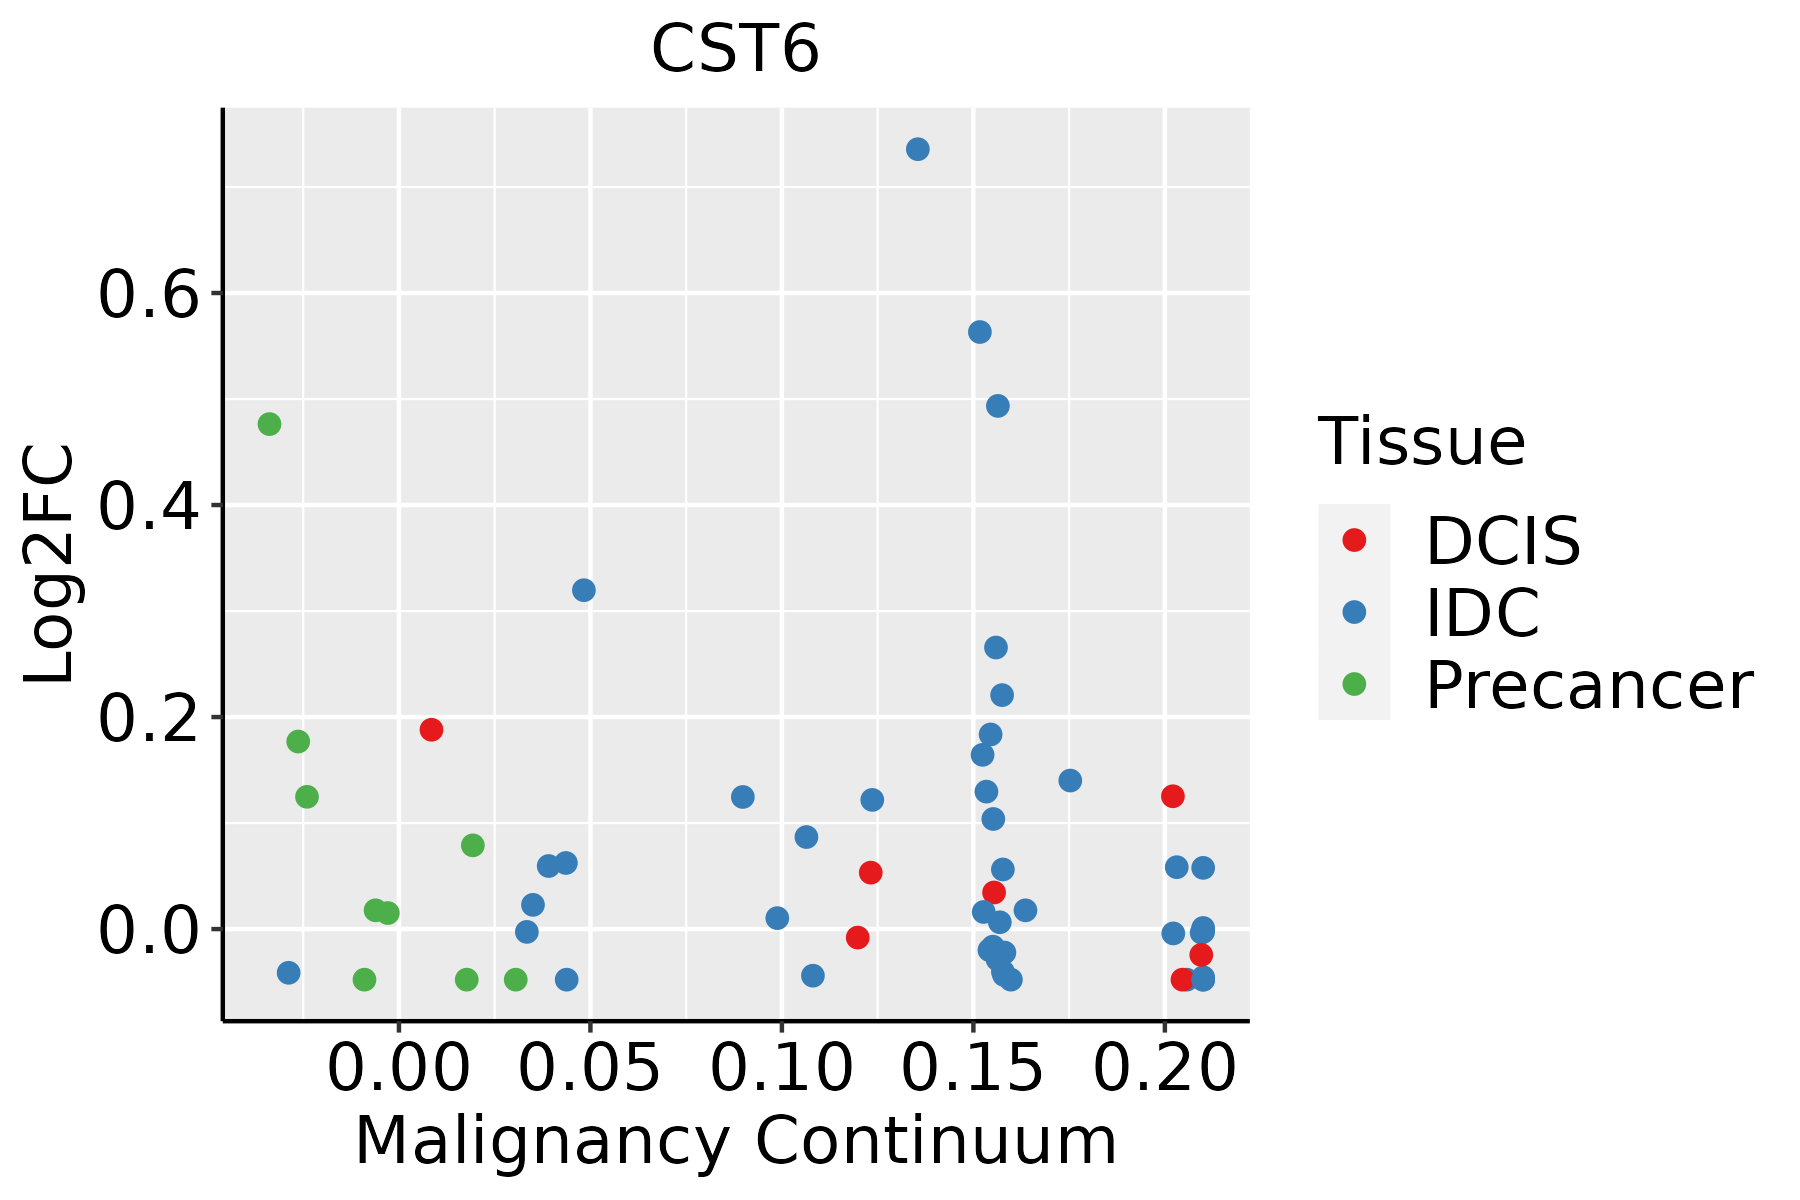 | IDC: Invasive ductal carcinoma |
| DCIS: Ductal carcinoma in situ | ||
| Precancer(BRCA1-mut): Precancerous lesion from BRCA1 mutation carriers | ||
| Cervix |  | CC: Cervix cancer |
| HSIL_HPV: HPV-infected high-grade squamous intraepithelial lesions | ||
| N_HPV: HPV-infected normal cervix | ||
| Esophagus | 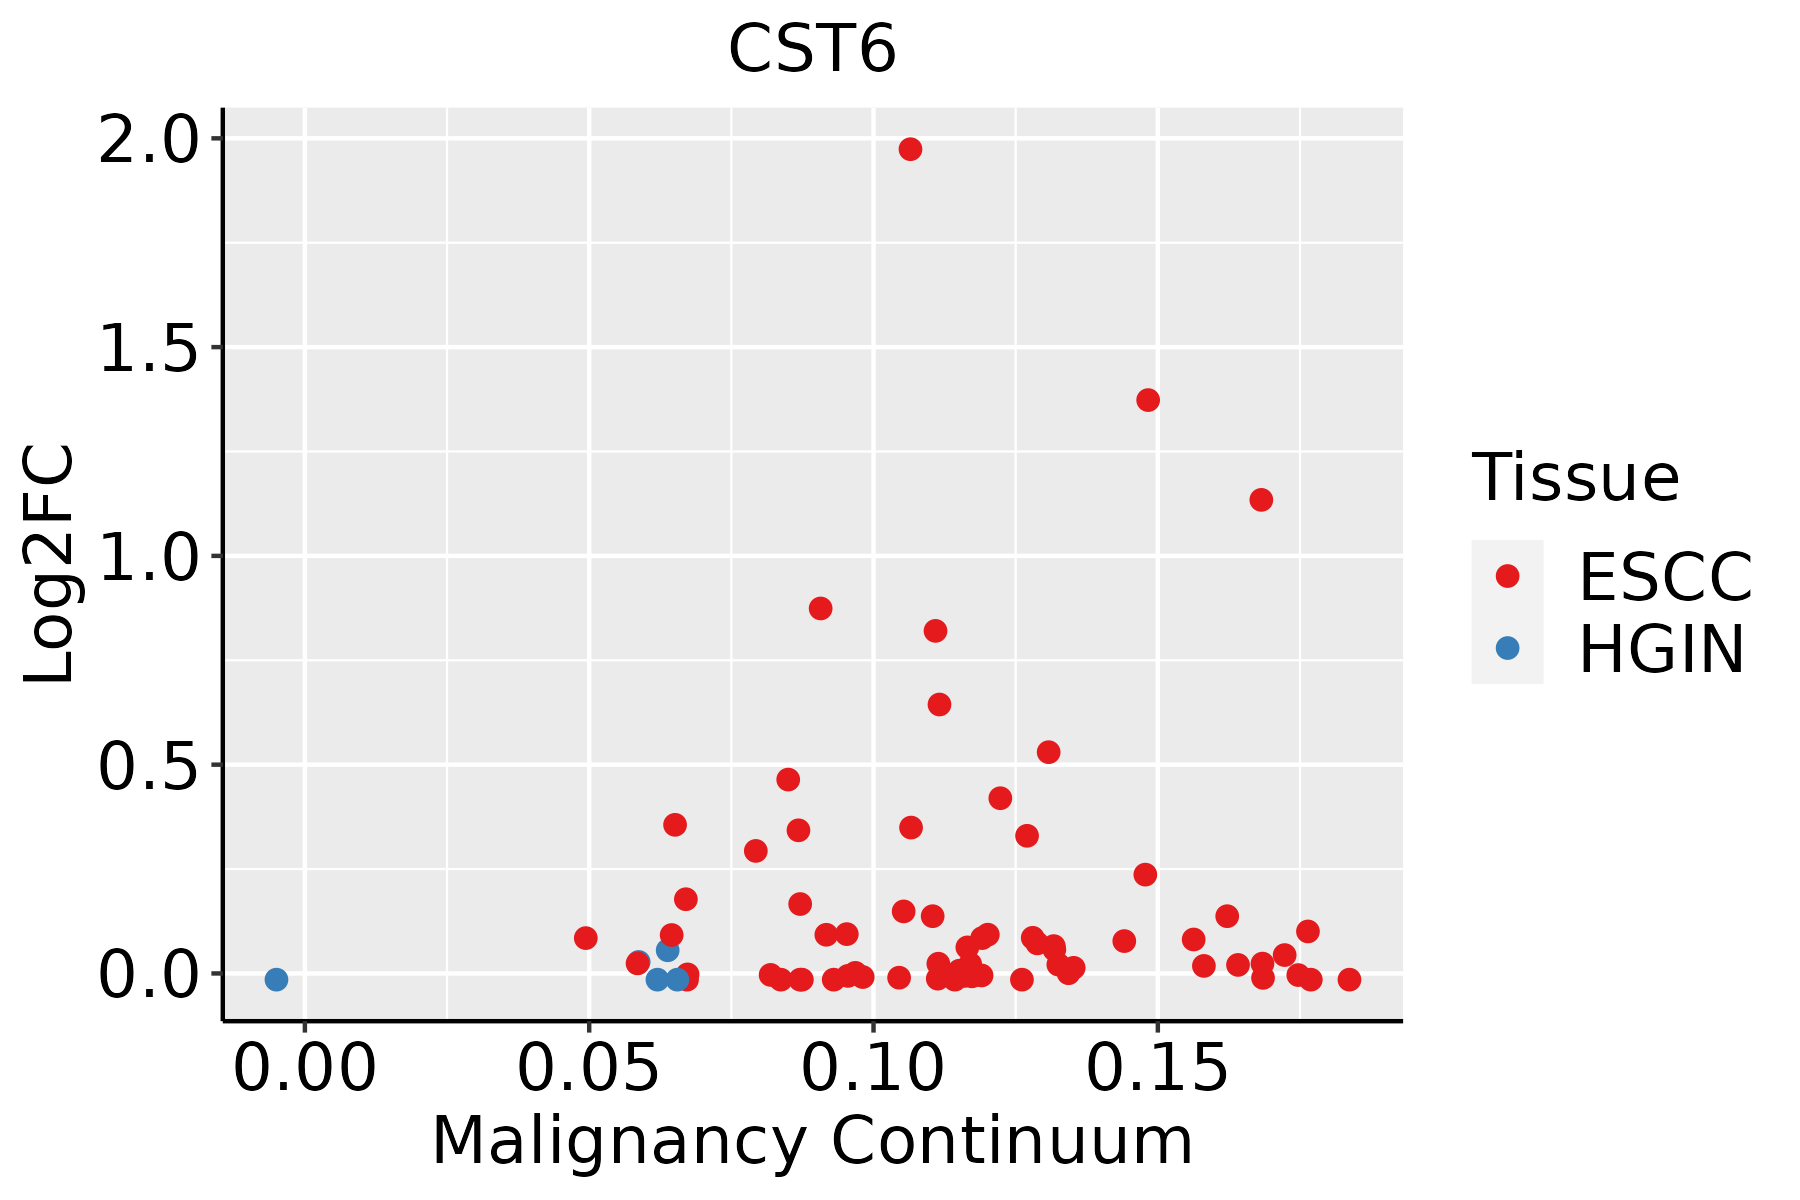 | ESCC: Esophageal squamous cell carcinoma |
| HGIN: High-grade intraepithelial neoplasias | ||
| LGIN: Low-grade intraepithelial neoplasias | ||
| Oral Cavity | 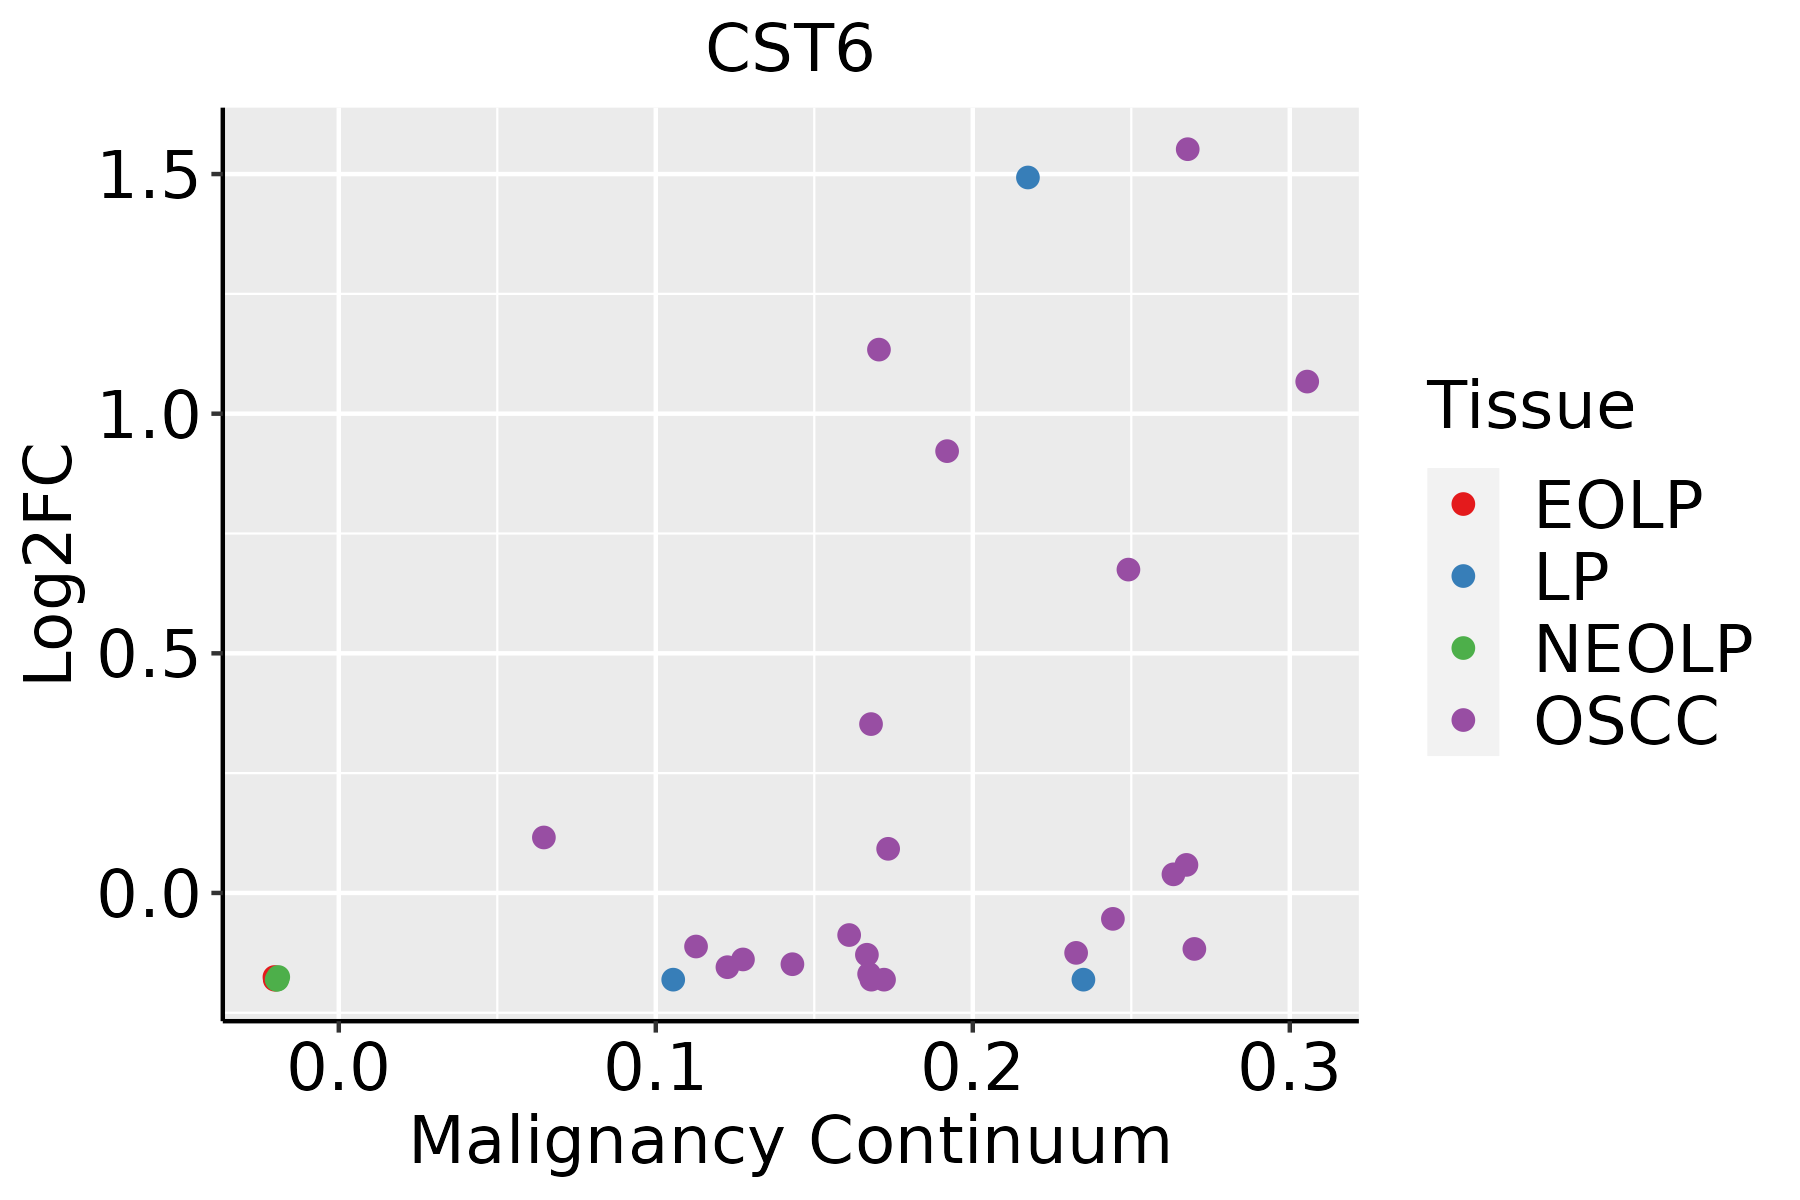 | EOLP: Erosive Oral lichen planus |
| LP: leukoplakia | ||
| NEOLP: Non-erosive oral lichen planus | ||
| OSCC: Oral squamous cell carcinoma | ||
| Thyroid | 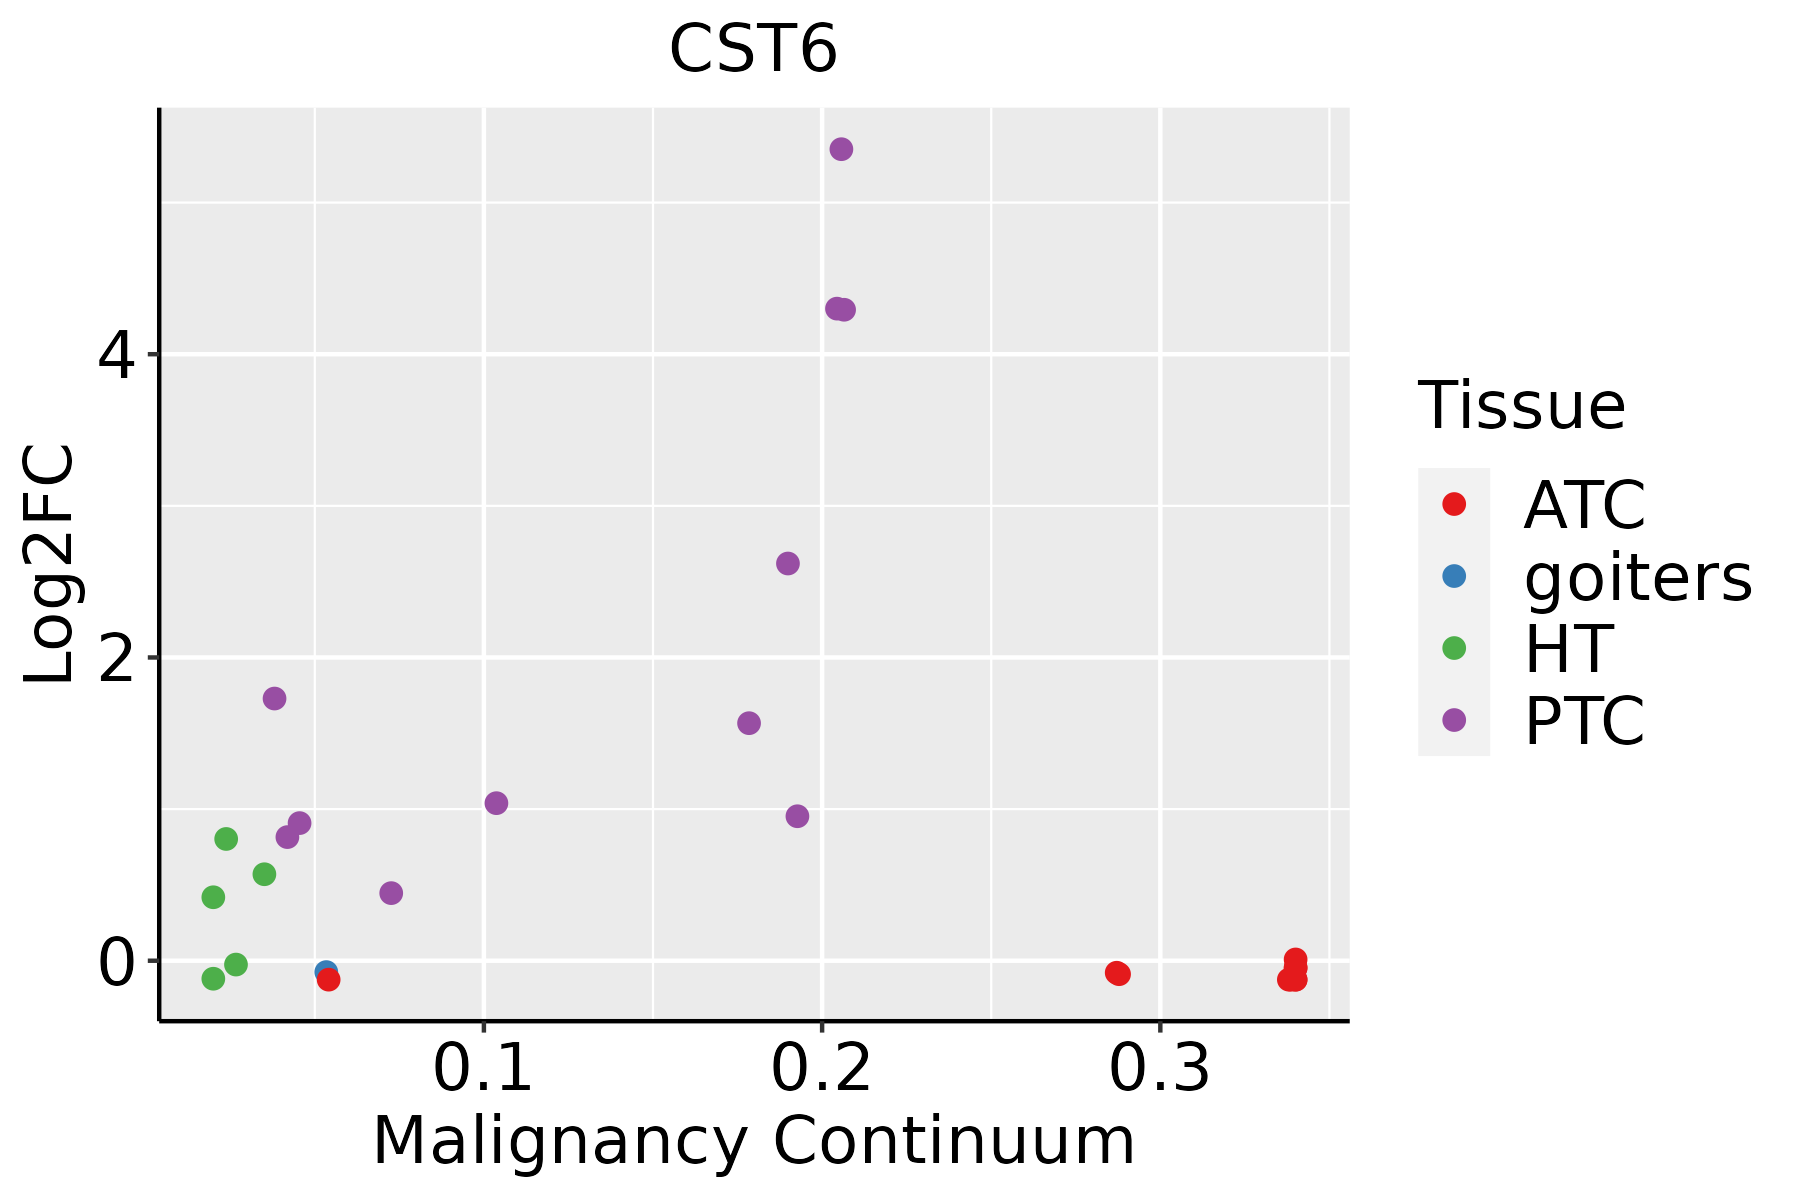 | ATC: Anaplastic thyroid cancer |
| HT: Hashimoto's thyroiditis | ||
| PTC: Papillary thyroid cancer |
| ∗log2FC in expression of this searched gene in stem-like cells from each diseased tissue sample relative to stem-like cells in normal samples in each tissue plotted against the malignancy continuum. Samples are colored based on if they are from different disease stage. |
Top |
Malignant transformation related pathway analysis |
| Find out the enriched GO biological processes and KEGG pathways involved in transition from healthy to precancer to cancer |
| Tissue | Disease Stage | Enriched GO biological Processes |
| Colorectum | AD |  |
| Colorectum | SER |  |
| Colorectum | MSS |  |
| Colorectum | MSI-H |  |
| Colorectum | FAP |  |
| ∗Top 15 enriched GO BP terms are showed in the bar plot of each disease state in each tissue. Each row represents a significant GO biological process which is colored according to the -log10(p.adjust). |
| Page: 1 2 3 4 5 6 7 8 9 |
| GO ID | Tissue | Disease Stage | Description | Gene Ratio | Bg Ratio | pvalue | p.adjust | Count |
| GO:00525479 | Breast | Precancer | regulation of peptidase activity | 71/1080 | 461/18723 | 2.72e-14 | 6.94e-12 | 71 |
| GO:00525489 | Breast | Precancer | regulation of endopeptidase activity | 67/1080 | 432/18723 | 1.06e-13 | 2.36e-11 | 67 |
| GO:00458619 | Breast | Precancer | negative regulation of proteolysis | 50/1080 | 351/18723 | 2.99e-09 | 2.39e-07 | 50 |
| GO:00513468 | Breast | Precancer | negative regulation of hydrolase activity | 50/1080 | 379/18723 | 3.85e-08 | 2.34e-06 | 50 |
| GO:00104668 | Breast | Precancer | negative regulation of peptidase activity | 38/1080 | 262/18723 | 1.46e-07 | 7.82e-06 | 38 |
| GO:00109519 | Breast | Precancer | negative regulation of endopeptidase activity | 37/1080 | 252/18723 | 1.55e-07 | 8.05e-06 | 37 |
| GO:00085445 | Breast | Precancer | epidermis development | 35/1080 | 324/18723 | 2.71e-04 | 3.96e-03 | 35 |
| GO:005254714 | Breast | IDC | regulation of peptidase activity | 96/1434 | 461/18723 | 7.58e-20 | 6.15e-17 | 96 |
| GO:005254814 | Breast | IDC | regulation of endopeptidase activity | 88/1434 | 432/18723 | 1.20e-17 | 4.85e-15 | 88 |
| GO:004586114 | Breast | IDC | negative regulation of proteolysis | 70/1434 | 351/18723 | 8.21e-14 | 2.22e-11 | 70 |
| GO:005134613 | Breast | IDC | negative regulation of hydrolase activity | 71/1434 | 379/18723 | 1.33e-12 | 2.90e-10 | 71 |
| GO:001046613 | Breast | IDC | negative regulation of peptidase activity | 56/1434 | 262/18723 | 1.39e-12 | 2.92e-10 | 56 |
| GO:001095112 | Breast | IDC | negative regulation of endopeptidase activity | 52/1434 | 252/18723 | 3.53e-11 | 5.57e-09 | 52 |
| GO:000854412 | Breast | IDC | epidermis development | 41/1434 | 324/18723 | 1.03e-03 | 1.14e-02 | 41 |
| GO:005254723 | Breast | DCIS | regulation of peptidase activity | 88/1390 | 461/18723 | 1.18e-16 | 4.78e-14 | 88 |
| GO:005254823 | Breast | DCIS | regulation of endopeptidase activity | 83/1390 | 432/18723 | 6.07e-16 | 2.15e-13 | 83 |
| GO:004586123 | Breast | DCIS | negative regulation of proteolysis | 63/1390 | 351/18723 | 4.39e-11 | 6.06e-09 | 63 |
| GO:005134623 | Breast | DCIS | negative regulation of hydrolase activity | 64/1390 | 379/18723 | 4.32e-10 | 4.80e-08 | 64 |
| GO:001046622 | Breast | DCIS | negative regulation of peptidase activity | 49/1390 | 262/18723 | 1.54e-09 | 1.43e-07 | 49 |
| GO:001095122 | Breast | DCIS | negative regulation of endopeptidase activity | 47/1390 | 252/18723 | 3.63e-09 | 3.11e-07 | 47 |
| Page: 1 2 3 4 5 |
| Pathway ID | Tissue | Disease Stage | Description | Gene Ratio | Bg Ratio | pvalue | p.adjust | qvalue | Count |
| Page: 1 |
Top |
Cell-cell communication analysis |
| Identification of potential cell-cell interactions between two cell types and their ligand-receptor pairs for different disease states |
| Ligand | Receptor | LRpair | Pathway | Tissue | Disease Stage |
| Page: 1 |
Top |
Single-cell gene regulatory network inference analysis |
| Find out the significant the regulons (TFs) and the target genes of each regulon across cell types for different disease states |
| TF | Cell Type | Tissue | Disease Stage | Target Gene | RSS | Regulon Activity |
| ∗The dot plots of a searched regulon are shown for all cell subpopulations in each disease state of each tissue based on the regulon specific score inferred using pySCENIC and by calculating the average expression. |
| Page: 1 |
Top |
Somatic mutation of malignant transformation related genes |
| Annotation of somatic variants for genes involved in malignant transformation |
| Hugo Symbol | Variant Class | Variant Classification | dbSNP RS | HGVSc | HGVSp | HGVSp Short | SWISSPROT | BIOTYPE | SIFT | PolyPhen | Tumor Sample Barcode | Tissue | Histology | Sex | Age | Stage | Therapy Types | Drugs | Outcome |
| CST6 | SNV | Missense_Mutation | novel | c.300N>T | p.Lys100Asn | p.K100N | Q15828 | protein_coding | deleterious(0) | possibly_damaging(0.518) | TCGA-CA-6717-01 | Colorectum | colon adenocarcinoma | Male | <65 | I/II | Chemotherapy | oxaliplatin | CR |
| CST6 | SNV | Missense_Mutation | c.269C>T | p.Thr90Met | p.T90M | Q15828 | protein_coding | deleterious(0.04) | probably_damaging(0.917) | TCGA-DY-A1DF-01 | Colorectum | rectum adenocarcinoma | Female | >=65 | III/IV | Unknown | Unknown | SD | |
| CST6 | SNV | Missense_Mutation | rs372528928 | c.325G>A | p.Asp109Asn | p.D109N | Q15828 | protein_coding | tolerated(0.11) | benign(0.326) | TCGA-EI-6917-01 | Colorectum | rectum adenocarcinoma | Male | <65 | III/IV | Chemotherapy | 5fluorouracil+oxaciplatina+l-folinian | SD |
| CST6 | SNV | Missense_Mutation | novel | c.392N>G | p.Leu131Arg | p.L131R | Q15828 | protein_coding | deleterious(0.01) | probably_damaging(0.999) | TCGA-AX-A2HJ-01 | Endometrium | uterine corpus endometrioid carcinoma | Female | <65 | I/II | Unknown | Unknown | SD |
| CST6 | SNV | Missense_Mutation | c.429N>T | p.Lys143Asn | p.K143N | Q15828 | protein_coding | tolerated(0.06) | benign(0.046) | TCGA-BS-A0UF-01 | Endometrium | uterine corpus endometrioid carcinoma | Female | >=65 | I/II | Unknown | Unknown | SD | |
| CST6 | SNV | Missense_Mutation | rs372528928 | c.325N>A | p.Asp109Asn | p.D109N | Q15828 | protein_coding | tolerated(0.11) | benign(0.326) | TCGA-EO-A22R-01 | Endometrium | uterine corpus endometrioid carcinoma | Female | <65 | I/II | Unknown | Unknown | SD |
| CST6 | SNV | Missense_Mutation | c.11N>G | p.Ser4Trp | p.S4W | Q15828 | protein_coding | tolerated(0.05) | benign(0.192) | TCGA-66-2773-01 | Lung | lung squamous cell carcinoma | Male | >=65 | I/II | Unknown | Unknown | SD | |
| CST6 | SNV | Missense_Mutation | c.152C>T | p.Ala51Val | p.A51V | Q15828 | protein_coding | tolerated(0.21) | benign(0.023) | TCGA-BR-A4QL-01 | Stomach | stomach adenocarcinoma | Female | >=65 | III/IV | Chemotherapy | xeloda | CR | |
| CST6 | SNV | Missense_Mutation | c.446N>A | p.Met149Lys | p.M149K | Q15828 | protein_coding | deleterious_low_confidence(0) | benign(0.011) | TCGA-CD-5800-01 | Stomach | stomach adenocarcinoma | Female | <65 | I/II | Unknown | Unknown | SD | |
| CST6 | SNV | Missense_Mutation | novel | c.247G>A | p.Ala83Thr | p.A83T | Q15828 | protein_coding | tolerated(0.09) | benign(0.047) | TCGA-VQ-A8P2-01 | Stomach | stomach adenocarcinoma | Male | >=65 | III/IV | Unspecific | Complete Response |
| Page: 1 |
Top |
Related drugs of malignant transformation related genes |
| Identification of chemicals and drugs interact with genes involved in malignant transfromation |
| (DGIdb 4.0) |
| Entrez ID | Symbol | Category | Interaction Types | Drug Claim Name | Drug Name | PMIDs |
| Page: 1 |

Copyright 2023-Present -The University of Texas Health Science Center at Houston |