
|
|||||
|
 | |
| |
| |
| |
| |
| |
|
Gene: CSRP2 |
Gene summary for CSRP2 |
| Gene information | Species | Human | Gene symbol | CSRP2 | Gene ID | 1466 |
| Gene name | cysteine and glycine rich protein 2 | |
| Gene Alias | CRP2 | |
| Cytomap | 12q21.2 | |
| Gene Type | protein-coding | GO ID | GO:0006996 | UniProtAcc | A0A024RBB5 |
Top |
Malignant transformation analysis |
| Identification of the aberrant gene expression in precancerous and cancerous lesions by comparing the gene expression of stem-like cells in diseased tissues with normal stem cells |
| Entrez ID | Symbol | Replicates | Species | Organ | Tissue | Adj P-value | Log2FC | Malignancy |
| 1466 | CSRP2 | LZE4T | Human | Esophagus | ESCC | 7.70e-05 | 5.66e-01 | 0.0811 |
| 1466 | CSRP2 | LZE7T | Human | Esophagus | ESCC | 1.24e-09 | 1.58e+00 | 0.0667 |
| 1466 | CSRP2 | LZE8T | Human | Esophagus | ESCC | 4.26e-05 | 3.38e-01 | 0.067 |
| 1466 | CSRP2 | LZE20T | Human | Esophagus | ESCC | 5.03e-03 | 2.88e-01 | 0.0662 |
| 1466 | CSRP2 | LZE24T | Human | Esophagus | ESCC | 5.65e-06 | 4.71e-02 | 0.0596 |
| 1466 | CSRP2 | P1T-E | Human | Esophagus | ESCC | 1.48e-03 | 2.25e-01 | 0.0875 |
| 1466 | CSRP2 | P2T-E | Human | Esophagus | ESCC | 2.01e-74 | 1.83e+00 | 0.1177 |
| 1466 | CSRP2 | P4T-E | Human | Esophagus | ESCC | 1.87e-32 | 1.36e+00 | 0.1323 |
| 1466 | CSRP2 | P5T-E | Human | Esophagus | ESCC | 1.43e-60 | 1.51e+00 | 0.1327 |
| 1466 | CSRP2 | P9T-E | Human | Esophagus | ESCC | 3.80e-02 | 4.03e-01 | 0.1131 |
| 1466 | CSRP2 | P10T-E | Human | Esophagus | ESCC | 8.39e-19 | 6.10e-01 | 0.116 |
| 1466 | CSRP2 | P11T-E | Human | Esophagus | ESCC | 1.62e-10 | 1.37e+00 | 0.1426 |
| 1466 | CSRP2 | P12T-E | Human | Esophagus | ESCC | 2.66e-05 | 3.36e-01 | 0.1122 |
| 1466 | CSRP2 | P15T-E | Human | Esophagus | ESCC | 6.56e-25 | 9.51e-01 | 0.1149 |
| 1466 | CSRP2 | P16T-E | Human | Esophagus | ESCC | 1.01e-86 | 2.31e+00 | 0.1153 |
| 1466 | CSRP2 | P17T-E | Human | Esophagus | ESCC | 3.90e-07 | 9.76e-01 | 0.1278 |
| 1466 | CSRP2 | P19T-E | Human | Esophagus | ESCC | 1.16e-07 | 1.94e+00 | 0.1662 |
| 1466 | CSRP2 | P20T-E | Human | Esophagus | ESCC | 2.33e-24 | 9.70e-01 | 0.1124 |
| 1466 | CSRP2 | P21T-E | Human | Esophagus | ESCC | 8.12e-37 | 1.12e+00 | 0.1617 |
| 1466 | CSRP2 | P22T-E | Human | Esophagus | ESCC | 4.40e-15 | 4.35e-01 | 0.1236 |
| Page: 1 2 3 4 5 6 |
| Tissue | Expression Dynamics | Abbreviation |
| Esophagus | 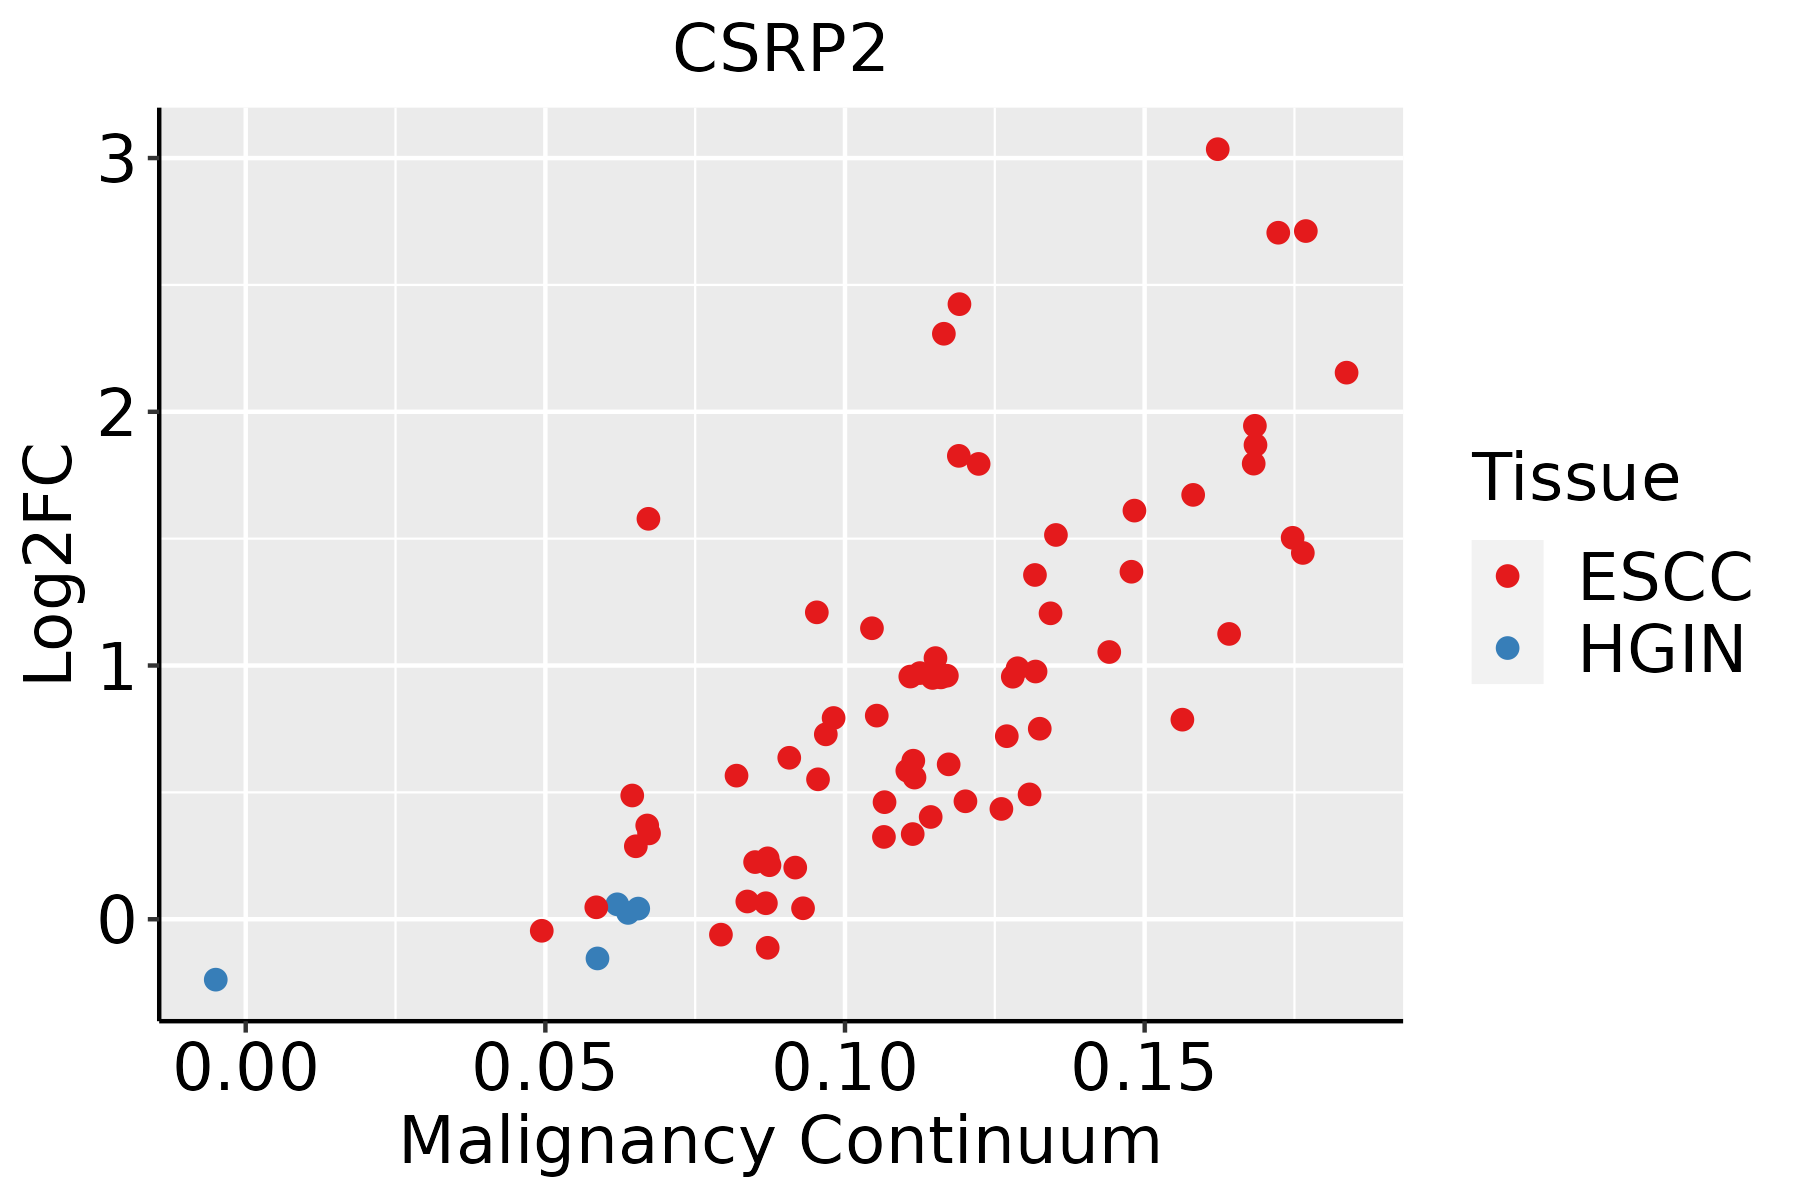 | ESCC: Esophageal squamous cell carcinoma |
| HGIN: High-grade intraepithelial neoplasias | ||
| LGIN: Low-grade intraepithelial neoplasias | ||
| Liver | 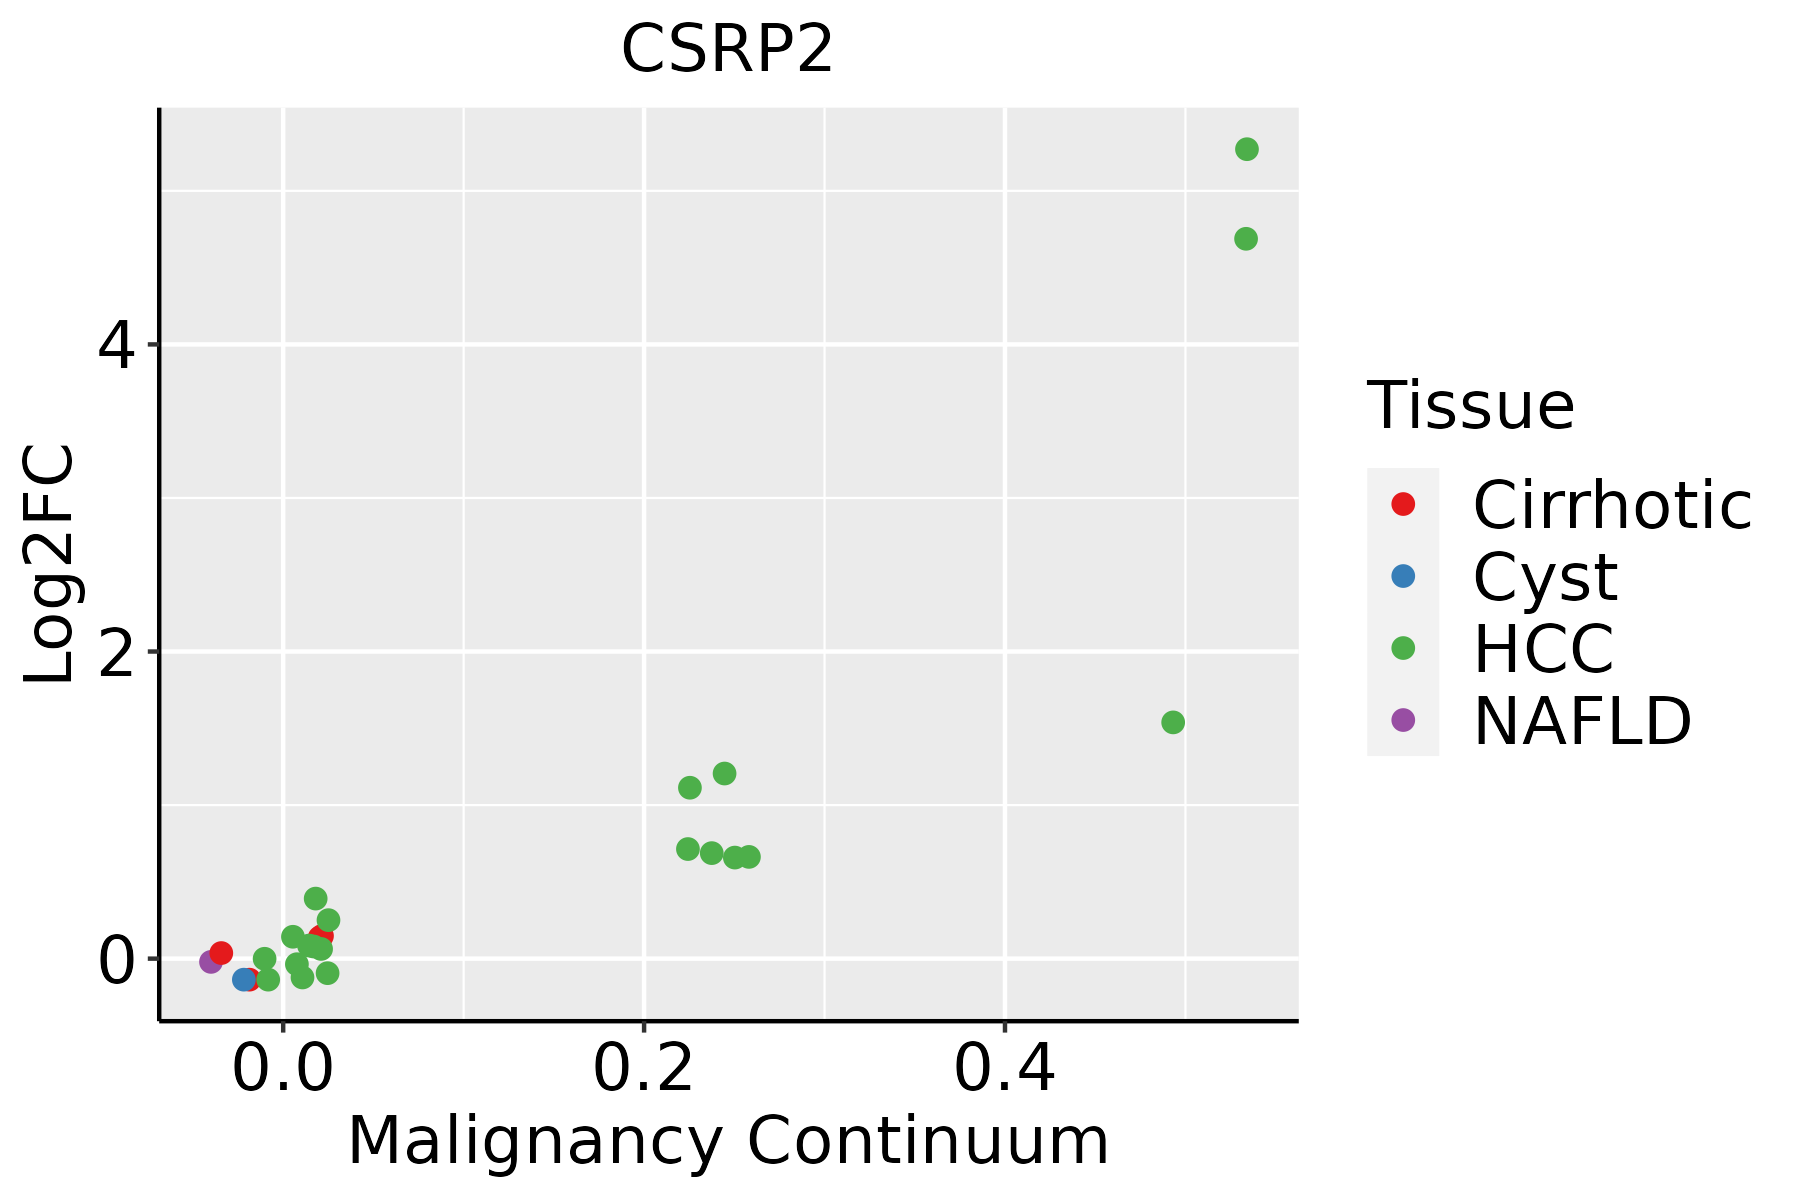 | HCC: Hepatocellular carcinoma |
| NAFLD: Non-alcoholic fatty liver disease | ||
| Oral Cavity | 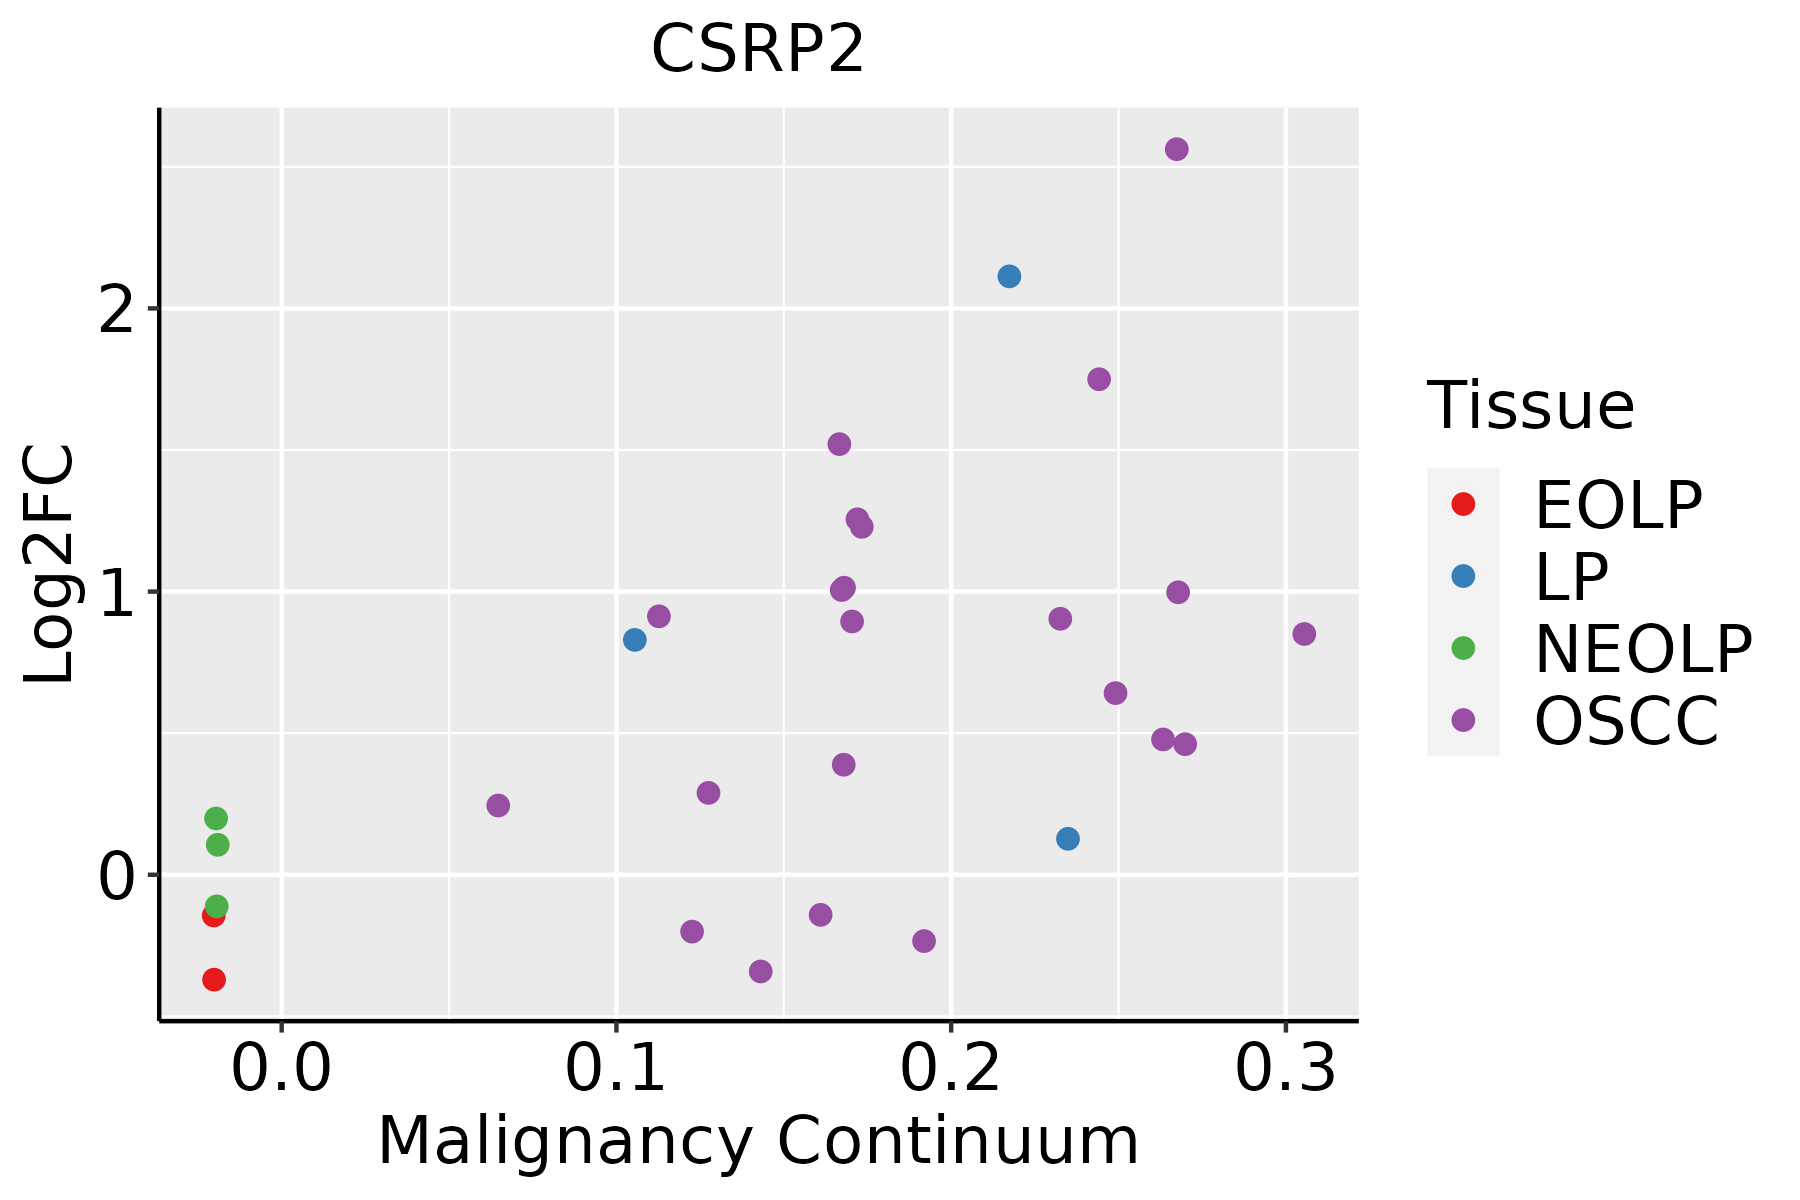 | EOLP: Erosive Oral lichen planus |
| LP: leukoplakia | ||
| NEOLP: Non-erosive oral lichen planus | ||
| OSCC: Oral squamous cell carcinoma | ||
| Prostate |  | BPH: Benign Prostatic Hyperplasia |
| Skin |  | AK: Actinic keratosis |
| cSCC: Cutaneous squamous cell carcinoma | ||
| SCCIS:squamous cell carcinoma in situ | ||
| Thyroid | 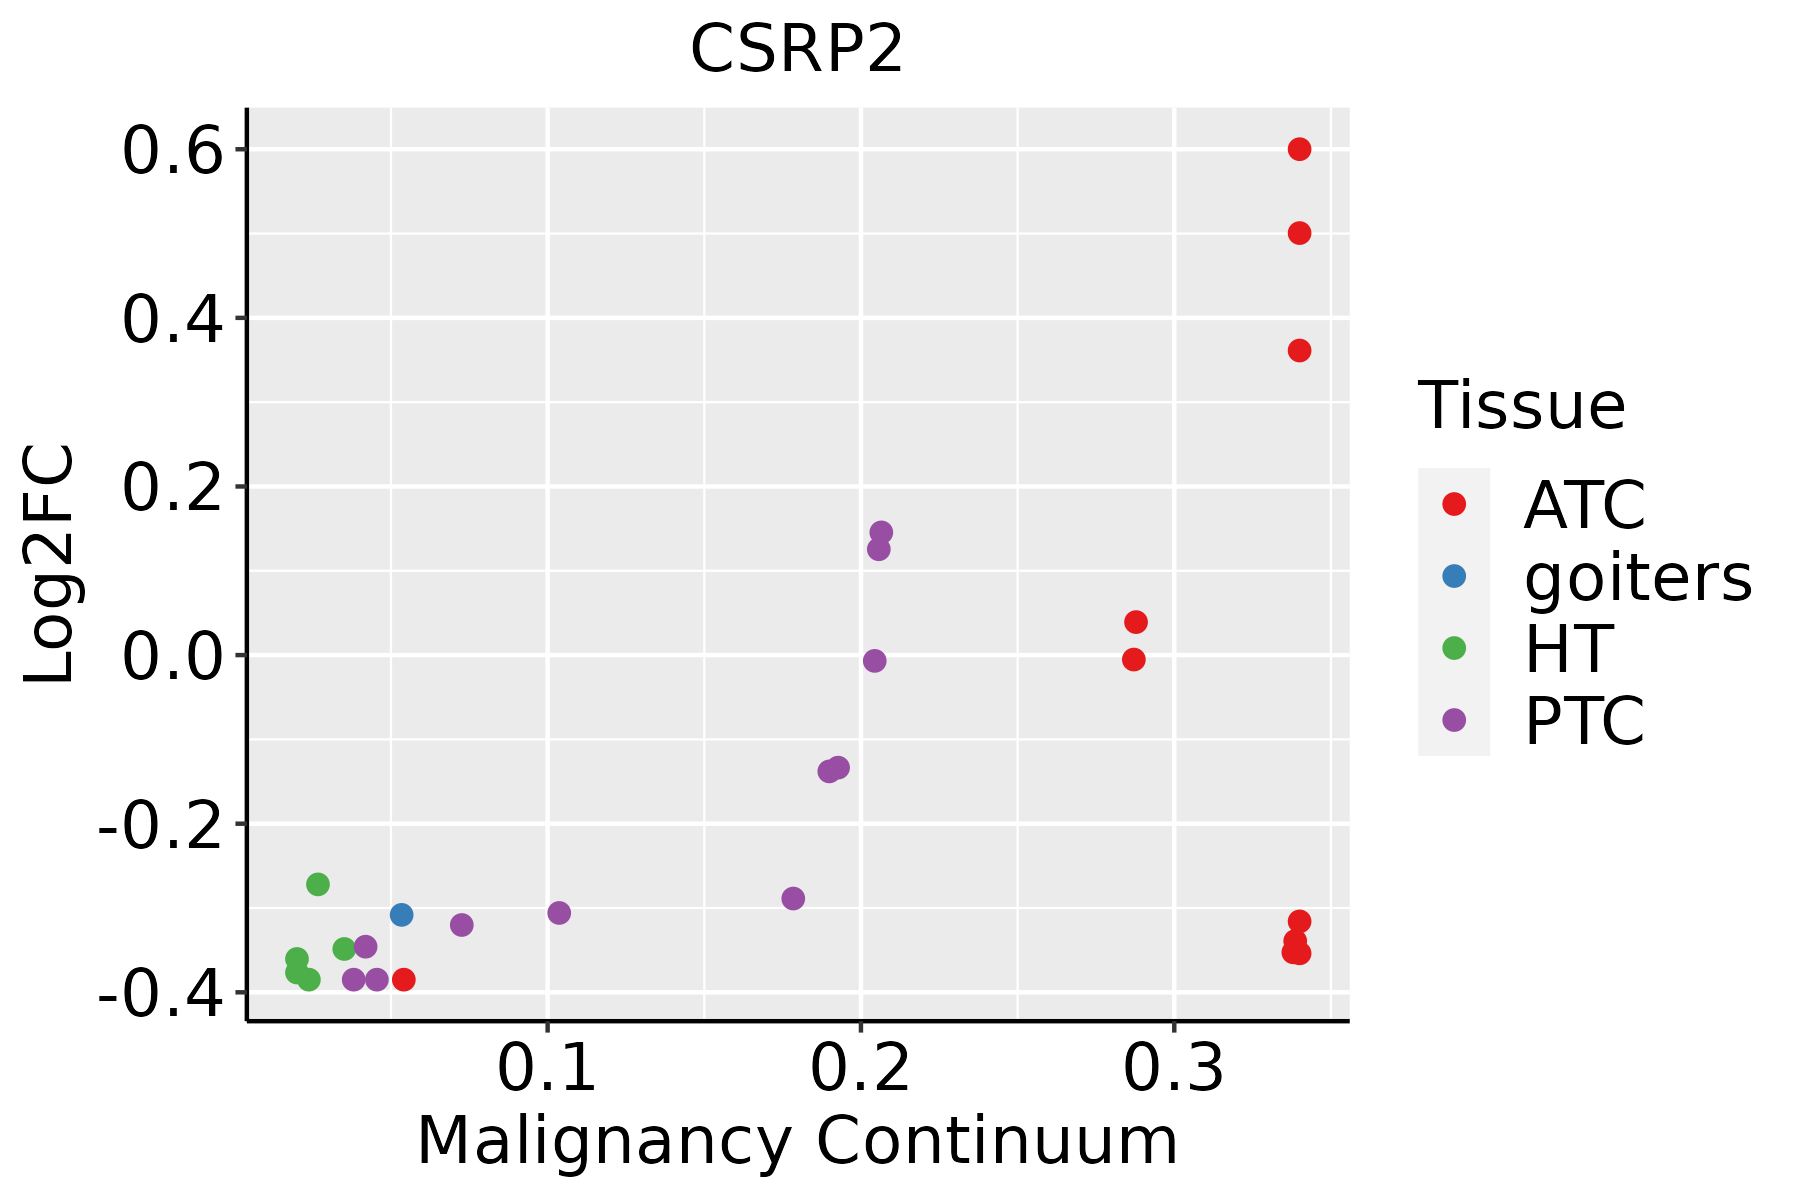 | ATC: Anaplastic thyroid cancer |
| HT: Hashimoto's thyroiditis | ||
| PTC: Papillary thyroid cancer |
| ∗log2FC in expression of this searched gene in stem-like cells from each diseased tissue sample relative to stem-like cells in normal samples in each tissue plotted against the malignancy continuum. Samples are colored based on if they are from different disease stage. |
Top |
Malignant transformation related pathway analysis |
| Find out the enriched GO biological processes and KEGG pathways involved in transition from healthy to precancer to cancer |
| Tissue | Disease Stage | Enriched GO biological Processes |
| Colorectum | AD |  |
| Colorectum | SER |  |
| Colorectum | MSS |  |
| Colorectum | MSI-H |  |
| Colorectum | FAP |  |
| ∗Top 15 enriched GO BP terms are showed in the bar plot of each disease state in each tissue. Each row represents a significant GO biological process which is colored according to the -log10(p.adjust). |
| Page: 1 2 3 4 5 6 7 8 9 |
| GO ID | Tissue | Disease Stage | Description | Gene Ratio | Bg Ratio | pvalue | p.adjust | Count |
| GO:006053716 | Esophagus | ESCC | muscle tissue development | 211/8552 | 403/18723 | 3.84e-03 | 1.56e-02 | 211 |
| GO:003103219 | Esophagus | ESCC | actomyosin structure organization | 108/8552 | 196/18723 | 4.86e-03 | 1.88e-02 | 108 |
| GO:003103212 | Liver | Cirrhotic | actomyosin structure organization | 74/4634 | 196/18723 | 3.39e-05 | 4.17e-04 | 74 |
| GO:003103222 | Liver | HCC | actomyosin structure organization | 109/7958 | 196/18723 | 1.39e-04 | 1.13e-03 | 109 |
| GO:00605378 | Oral cavity | OSCC | muscle tissue development | 185/7305 | 403/18723 | 2.60e-03 | 1.14e-02 | 185 |
| GO:00426927 | Oral cavity | OSCC | muscle cell differentiation | 175/7305 | 384/18723 | 4.79e-03 | 1.92e-02 | 175 |
| GO:003103217 | Oral cavity | OSCC | actomyosin structure organization | 93/7305 | 196/18723 | 9.63e-03 | 3.41e-02 | 93 |
| GO:004269214 | Oral cavity | EOLP | muscle cell differentiation | 77/2218 | 384/18723 | 2.18e-06 | 4.91e-05 | 77 |
| GO:006053715 | Oral cavity | EOLP | muscle tissue development | 77/2218 | 403/18723 | 1.37e-05 | 2.31e-04 | 77 |
| GO:00511467 | Oral cavity | EOLP | striated muscle cell differentiation | 57/2218 | 283/18723 | 3.82e-05 | 5.25e-04 | 57 |
| GO:003103218 | Oral cavity | EOLP | actomyosin structure organization | 39/2218 | 196/18723 | 7.64e-04 | 6.12e-03 | 39 |
| GO:00550013 | Oral cavity | EOLP | muscle cell development | 34/2218 | 184/18723 | 5.53e-03 | 2.86e-02 | 34 |
| GO:003103215 | Prostate | BPH | actomyosin structure organization | 63/3107 | 196/18723 | 5.78e-08 | 1.57e-06 | 63 |
| GO:00605377 | Prostate | BPH | muscle tissue development | 100/3107 | 403/18723 | 1.35e-05 | 1.76e-04 | 100 |
| GO:00426926 | Prostate | BPH | muscle cell differentiation | 88/3107 | 384/18723 | 7.59e-04 | 5.01e-03 | 88 |
| GO:00550012 | Prostate | BPH | muscle cell development | 43/3107 | 184/18723 | 1.08e-02 | 4.49e-02 | 43 |
| GO:00511466 | Prostate | BPH | striated muscle cell differentiation | 62/3107 | 283/18723 | 1.15e-02 | 4.68e-02 | 62 |
| GO:003103216 | Prostate | Tumor | actomyosin structure organization | 63/3246 | 196/18723 | 2.94e-07 | 6.72e-06 | 63 |
| GO:006053714 | Prostate | Tumor | muscle tissue development | 107/3246 | 403/18723 | 1.93e-06 | 3.34e-05 | 107 |
| GO:004269213 | Prostate | Tumor | muscle cell differentiation | 93/3246 | 384/18723 | 3.45e-04 | 2.73e-03 | 93 |
| Page: 1 2 |
| Pathway ID | Tissue | Disease Stage | Description | Gene Ratio | Bg Ratio | pvalue | p.adjust | qvalue | Count |
| Page: 1 |
Top |
Cell-cell communication analysis |
| Identification of potential cell-cell interactions between two cell types and their ligand-receptor pairs for different disease states |
| Ligand | Receptor | LRpair | Pathway | Tissue | Disease Stage |
| Page: 1 |
Top |
Single-cell gene regulatory network inference analysis |
| Find out the significant the regulons (TFs) and the target genes of each regulon across cell types for different disease states |
| TF | Cell Type | Tissue | Disease Stage | Target Gene | RSS | Regulon Activity |
| ∗The dot plots of a searched regulon are shown for all cell subpopulations in each disease state of each tissue based on the regulon specific score inferred using pySCENIC and by calculating the average expression. |
| Page: 1 |
Top |
Somatic mutation of malignant transformation related genes |
| Annotation of somatic variants for genes involved in malignant transformation |
| Hugo Symbol | Variant Class | Variant Classification | dbSNP RS | HGVSc | HGVSp | HGVSp Short | SWISSPROT | BIOTYPE | SIFT | PolyPhen | Tumor Sample Barcode | Tissue | Histology | Sex | Age | Stage | Therapy Types | Drugs | Outcome |
| CSRP2 | SNV | Missense_Mutation | c.453N>C | p.Lys151Asn | p.K151N | Q16527 | protein_coding | deleterious(0) | probably_damaging(0.966) | TCGA-DG-A2KL-01 | Cervix | cervical & endocervical cancer | Female | <65 | I/II | Chemotherapy | cisplatin | SD | |
| CSRP2 | SNV | Missense_Mutation | rs548686771 | c.229N>A | p.Ala77Thr | p.A77T | Q16527 | protein_coding | deleterious(0) | possibly_damaging(0.541) | TCGA-AA-A010-01 | Colorectum | colon adenocarcinoma | Female | <65 | I/II | Chemotherapy | folinic | CR |
| CSRP2 | SNV | Missense_Mutation | c.95N>A | p.Arg32His | p.R32H | Q16527 | protein_coding | deleterious(0) | possibly_damaging(0.505) | TCGA-AA-A010-01 | Colorectum | colon adenocarcinoma | Female | <65 | I/II | Chemotherapy | folinic | CR | |
| CSRP2 | SNV | Missense_Mutation | novel | c.355T>C | p.Cys119Arg | p.C119R | Q16527 | protein_coding | deleterious(0) | probably_damaging(1) | TCGA-AA-A01D-01 | Colorectum | colon adenocarcinoma | Female | <65 | III/IV | Chemotherapy | capecitabine | PD |
| CSRP2 | SNV | Missense_Mutation | novel | c.354G>T | p.Lys118Asn | p.K118N | Q16527 | protein_coding | tolerated(0.3) | benign(0.197) | TCGA-AA-A01D-01 | Colorectum | colon adenocarcinoma | Female | <65 | III/IV | Chemotherapy | capecitabine | PD |
| CSRP2 | SNV | Missense_Mutation | rs762670612 | c.250C>T | p.Arg84Cys | p.R84C | Q16527 | protein_coding | deleterious(0.05) | possibly_damaging(0.462) | TCGA-AG-A02G-01 | Colorectum | rectum adenocarcinoma | Male | >=65 | III/IV | Chemotherapy | folinic | PD |
| CSRP2 | SNV | Missense_Mutation | novel | c.470N>A | p.Thr157Asn | p.T157N | Q16527 | protein_coding | tolerated(0.32) | benign(0.072) | TCGA-A5-A0G1-01 | Endometrium | uterine corpus endometrioid carcinoma | Female | >=65 | I/II | Unknown | Unknown | SD |
| CSRP2 | SNV | Missense_Mutation | novel | c.371N>G | p.Asp124Gly | p.D124G | Q16527 | protein_coding | tolerated(0.12) | benign(0.001) | TCGA-AJ-A3EL-01 | Endometrium | uterine corpus endometrioid carcinoma | Female | <65 | I/II | Unknown | Unknown | SD |
| CSRP2 | SNV | Missense_Mutation | novel | c.304A>C | p.Thr102Pro | p.T102P | Q16527 | protein_coding | tolerated(0.08) | benign(0.022) | TCGA-AP-A1DV-01 | Endometrium | uterine corpus endometrioid carcinoma | Female | <65 | I/II | Unknown | Unknown | SD |
| CSRP2 | SNV | Missense_Mutation | novel | c.413N>T | p.Pro138Leu | p.P138L | Q16527 | protein_coding | tolerated(0.52) | benign(0.152) | TCGA-AP-A5FX-01 | Endometrium | uterine corpus endometrioid carcinoma | Female | >=65 | III/IV | Chemotherapy | carboplatin | PD |
| Page: 1 2 3 |
Top |
Related drugs of malignant transformation related genes |
| Identification of chemicals and drugs interact with genes involved in malignant transfromation |
| (DGIdb 4.0) |
| Entrez ID | Symbol | Category | Interaction Types | Drug Claim Name | Drug Name | PMIDs |
| Page: 1 |

Copyright 2023-Present -The University of Texas Health Science Center at Houston |