
|
|||||
|
 | |
| |
| |
| |
| |
| |
|
Gene: CSRP1 |
Gene summary for CSRP1 |
| Gene information | Species | Human | Gene symbol | CSRP1 | Gene ID | 1465 |
| Gene name | cysteine and glycine rich protein 1 | |
| Gene Alias | CRP | |
| Cytomap | 1q32.1 | |
| Gene Type | protein-coding | GO ID | GO:0001775 | UniProtAcc | B4DY28 |
Top |
Malignant transformation analysis |
| Identification of the aberrant gene expression in precancerous and cancerous lesions by comparing the gene expression of stem-like cells in diseased tissues with normal stem cells |
| Entrez ID | Symbol | Replicates | Species | Organ | Tissue | Adj P-value | Log2FC | Malignancy |
| 1465 | CSRP1 | HTA11_347_2000001011 | Human | Colorectum | AD | 1.92e-06 | 2.94e-01 | -0.1954 |
| 1465 | CSRP1 | HTA11_696_2000001011 | Human | Colorectum | AD | 3.08e-03 | 2.35e-01 | -0.1464 |
| 1465 | CSRP1 | AEH-subject1 | Human | Endometrium | AEH | 6.27e-07 | -3.46e-01 | -0.3059 |
| 1465 | CSRP1 | AEH-subject2 | Human | Endometrium | AEH | 2.16e-11 | -4.44e-01 | -0.2525 |
| 1465 | CSRP1 | AEH-subject3 | Human | Endometrium | AEH | 2.11e-09 | -4.08e-01 | -0.2576 |
| 1465 | CSRP1 | AEH-subject4 | Human | Endometrium | AEH | 5.68e-05 | -3.76e-01 | -0.2657 |
| 1465 | CSRP1 | AEH-subject5 | Human | Endometrium | AEH | 5.53e-10 | -4.16e-01 | -0.2953 |
| 1465 | CSRP1 | EEC-subject1 | Human | Endometrium | EEC | 1.14e-12 | -4.78e-01 | -0.2682 |
| 1465 | CSRP1 | EEC-subject2 | Human | Endometrium | EEC | 2.84e-17 | -4.79e-01 | -0.2607 |
| 1465 | CSRP1 | EEC-subject3 | Human | Endometrium | EEC | 4.22e-22 | -4.21e-01 | -0.2525 |
| 1465 | CSRP1 | EEC-subject4 | Human | Endometrium | EEC | 7.97e-04 | -3.51e-01 | -0.2571 |
| 1465 | CSRP1 | EEC-subject5 | Human | Endometrium | EEC | 1.18e-04 | -3.18e-01 | -0.249 |
| 1465 | CSRP1 | GSM6177620_NYU_UCEC1_lib1_lib1 | Human | Endometrium | EEC | 3.46e-17 | -4.89e-01 | -0.1869 |
| 1465 | CSRP1 | GSM6177620_NYU_UCEC1_lib2_lib2 | Human | Endometrium | EEC | 9.99e-19 | -5.60e-01 | -0.1875 |
| 1465 | CSRP1 | GSM6177620_NYU_UCEC1_lib3_lib3 | Human | Endometrium | EEC | 2.32e-25 | -5.34e-01 | -0.1883 |
| 1465 | CSRP1 | GSM6177621_NYU_UCEC2_lib1_lib1 | Human | Endometrium | EEC | 2.79e-31 | -5.37e-01 | -0.1934 |
| 1465 | CSRP1 | GSM6177622_NYU_UCEC3_lib1_lib1 | Human | Endometrium | EEC | 3.07e-29 | -5.24e-01 | -0.1917 |
| 1465 | CSRP1 | GSM6177622_NYU_UCEC3_lib2_lib2 | Human | Endometrium | EEC | 9.60e-29 | -5.64e-01 | -0.1916 |
| 1465 | CSRP1 | LZE4T | Human | Esophagus | ESCC | 1.06e-05 | 2.37e-02 | 0.0811 |
| 1465 | CSRP1 | LZE7T | Human | Esophagus | ESCC | 2.95e-03 | 6.55e-01 | 0.0667 |
| Page: 1 2 3 4 5 6 7 8 |
| Tissue | Expression Dynamics | Abbreviation |
| Colorectum (GSE201348) |  | FAP: Familial adenomatous polyposis |
| CRC: Colorectal cancer | ||
| Colorectum (HTA11) |  | AD: Adenomas |
| SER: Sessile serrated lesions | ||
| MSI-H: Microsatellite-high colorectal cancer | ||
| MSS: Microsatellite stable colorectal cancer | ||
| Endometrium | 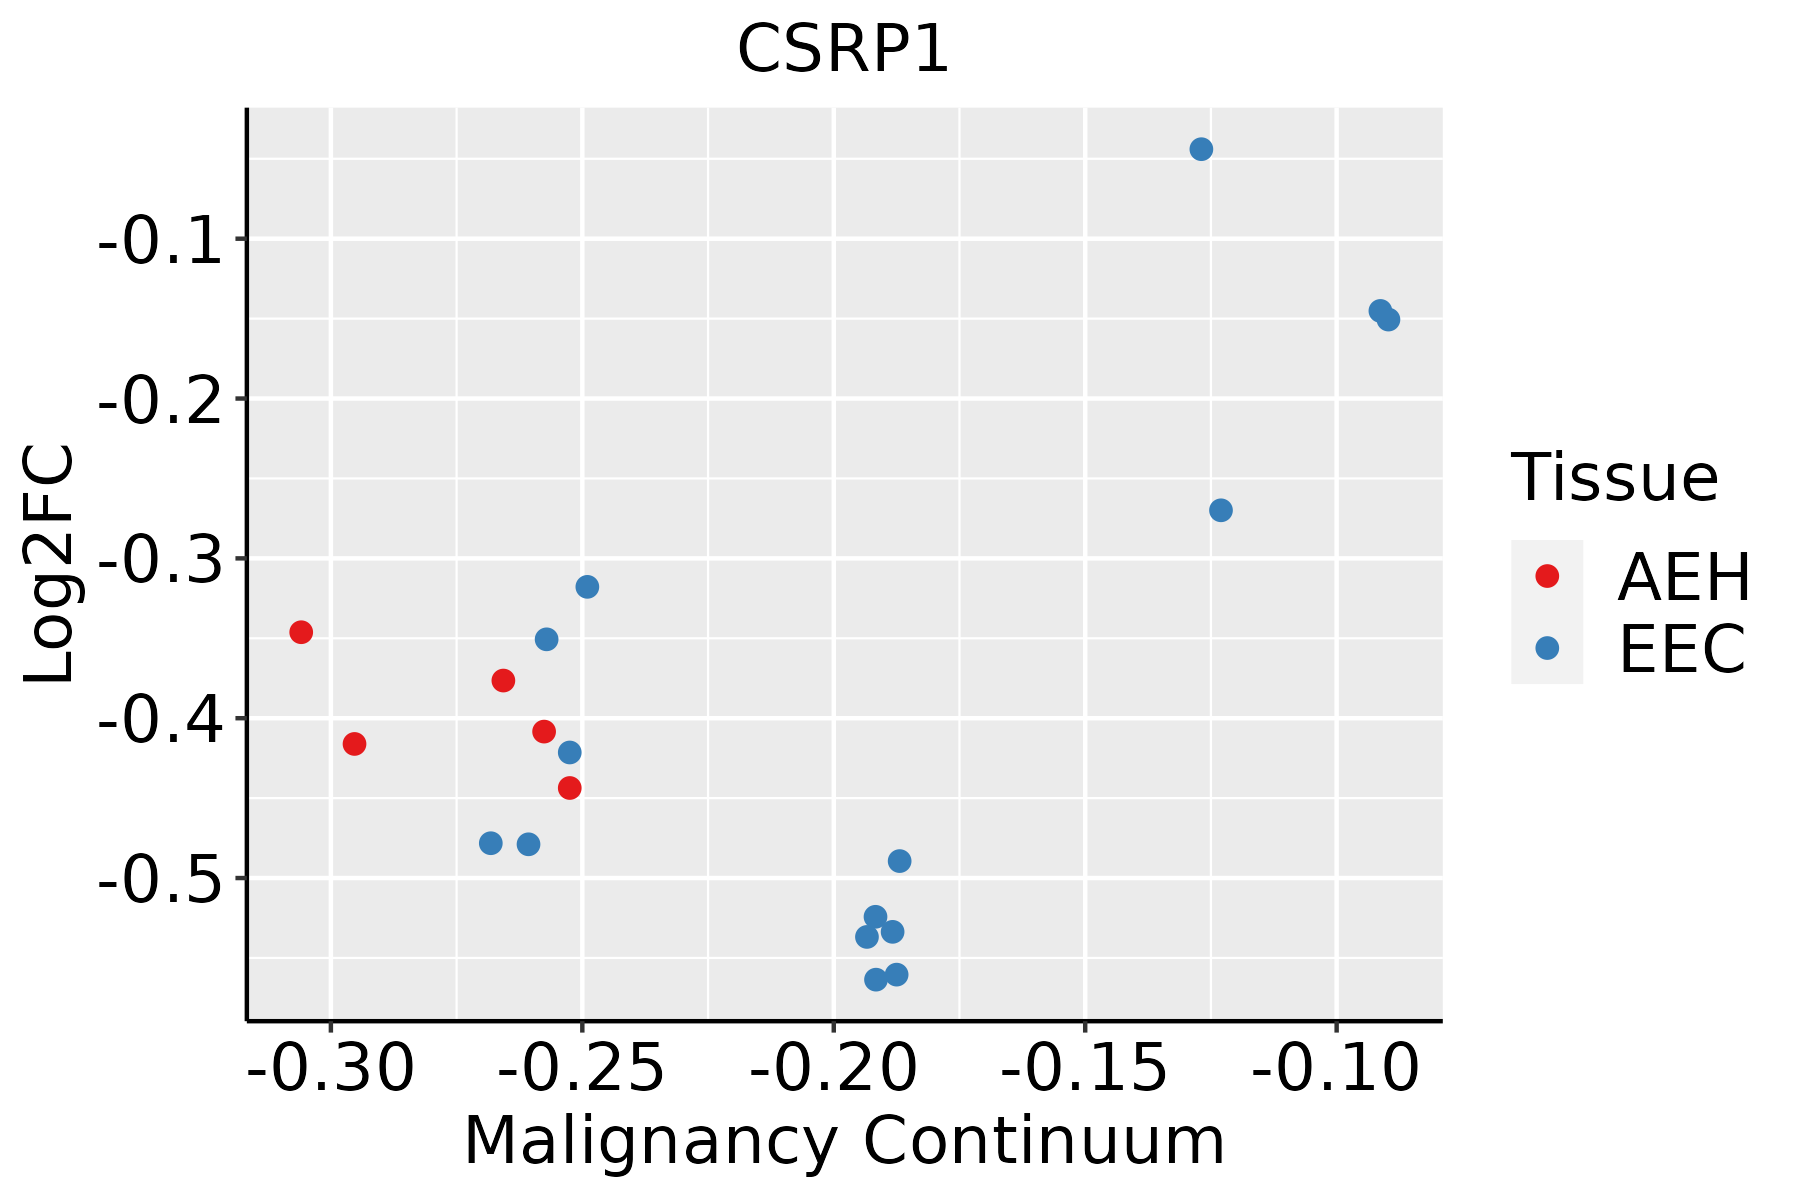 | AEH: Atypical endometrial hyperplasia |
| EEC: Endometrioid Cancer | ||
| Esophagus | 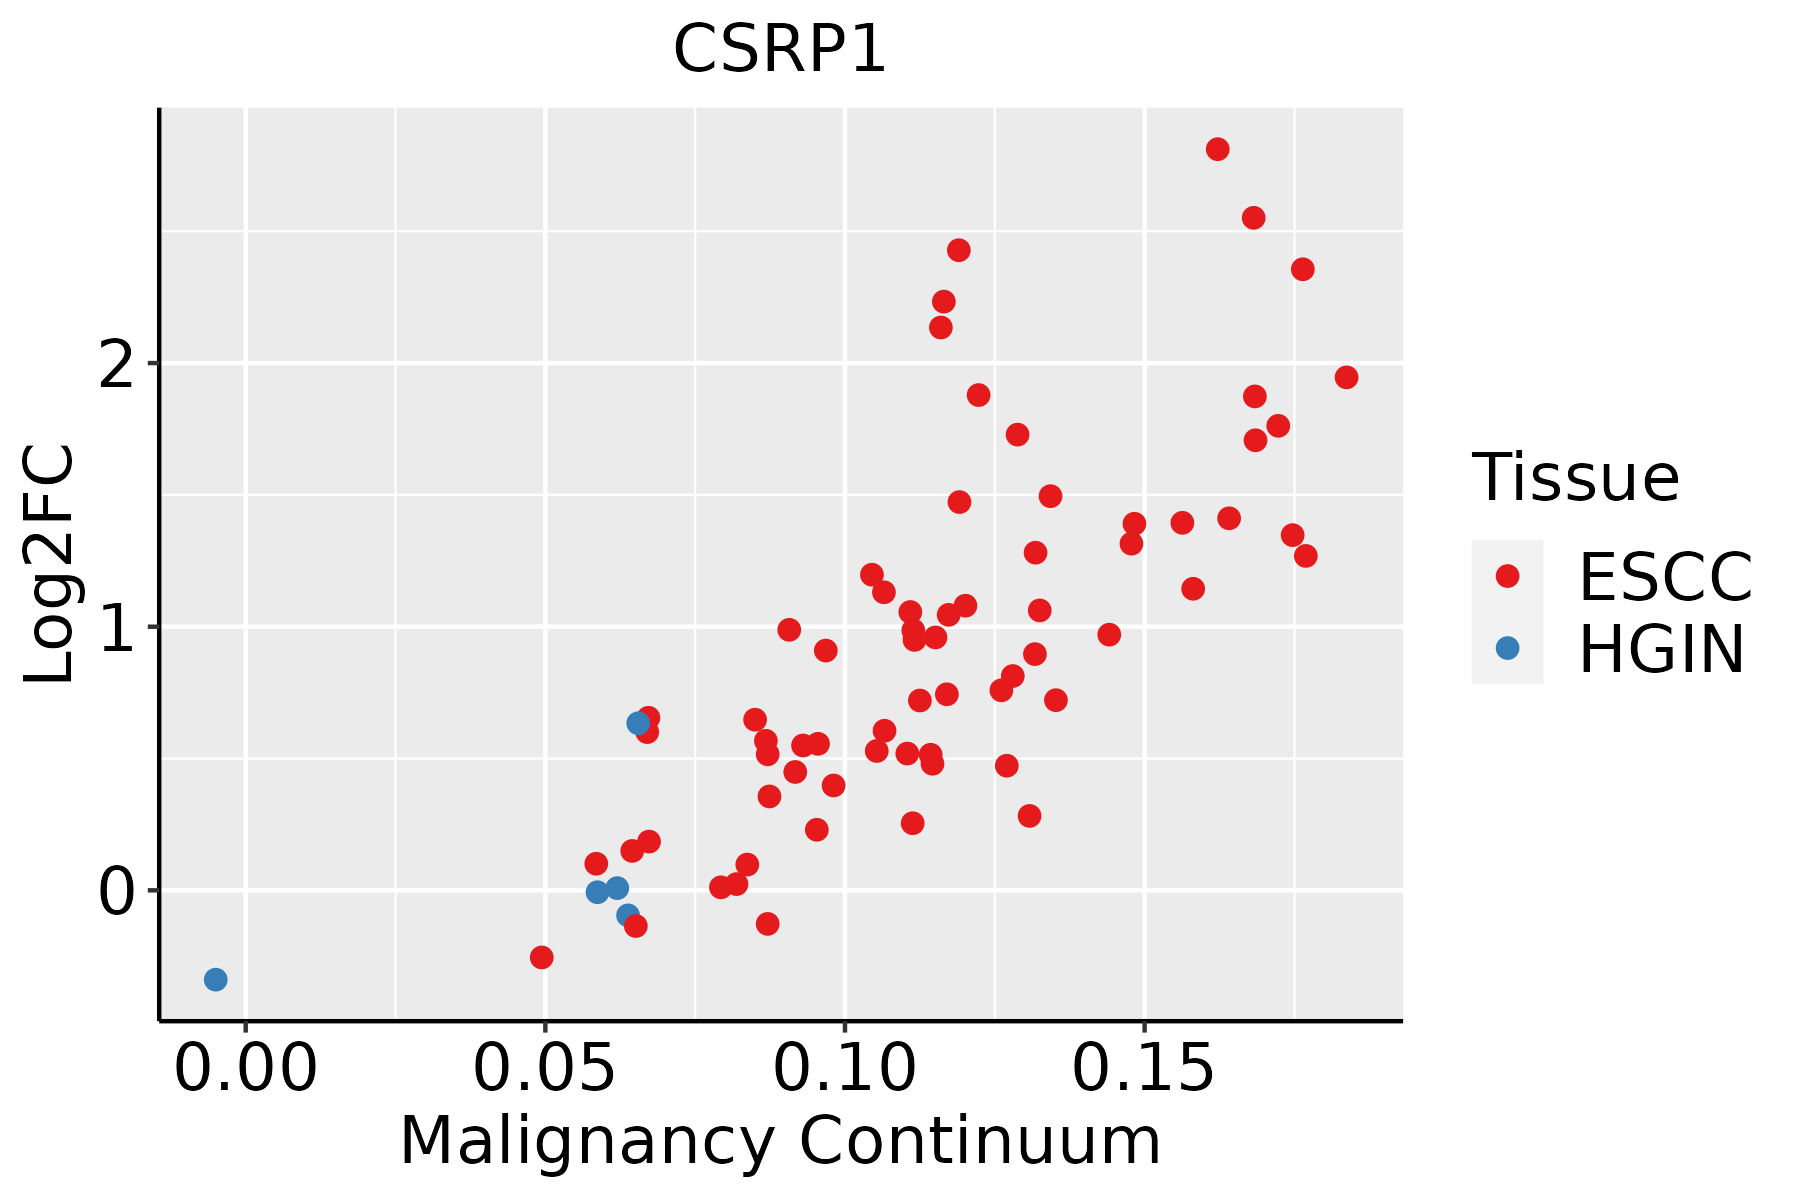 | ESCC: Esophageal squamous cell carcinoma |
| HGIN: High-grade intraepithelial neoplasias | ||
| LGIN: Low-grade intraepithelial neoplasias | ||
| Liver | 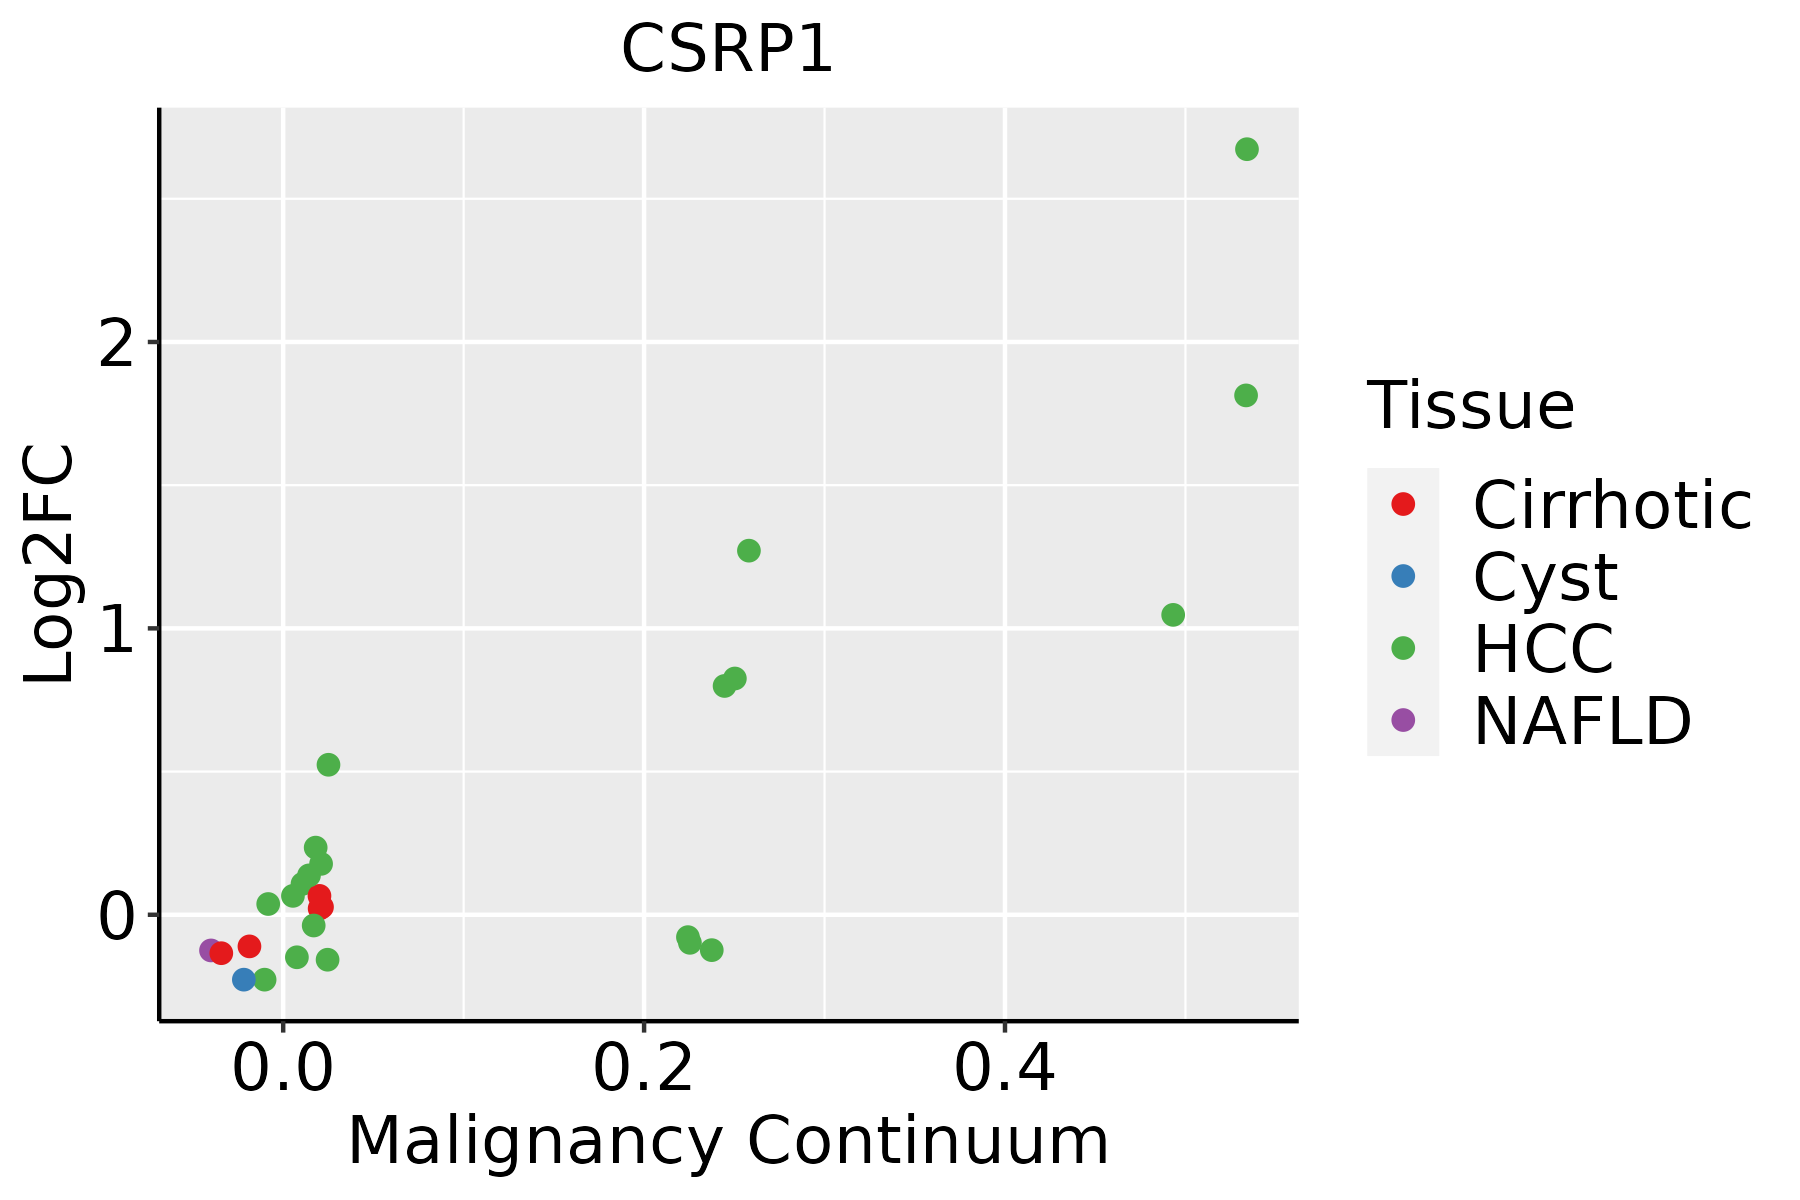 | HCC: Hepatocellular carcinoma |
| NAFLD: Non-alcoholic fatty liver disease | ||
| Oral Cavity | 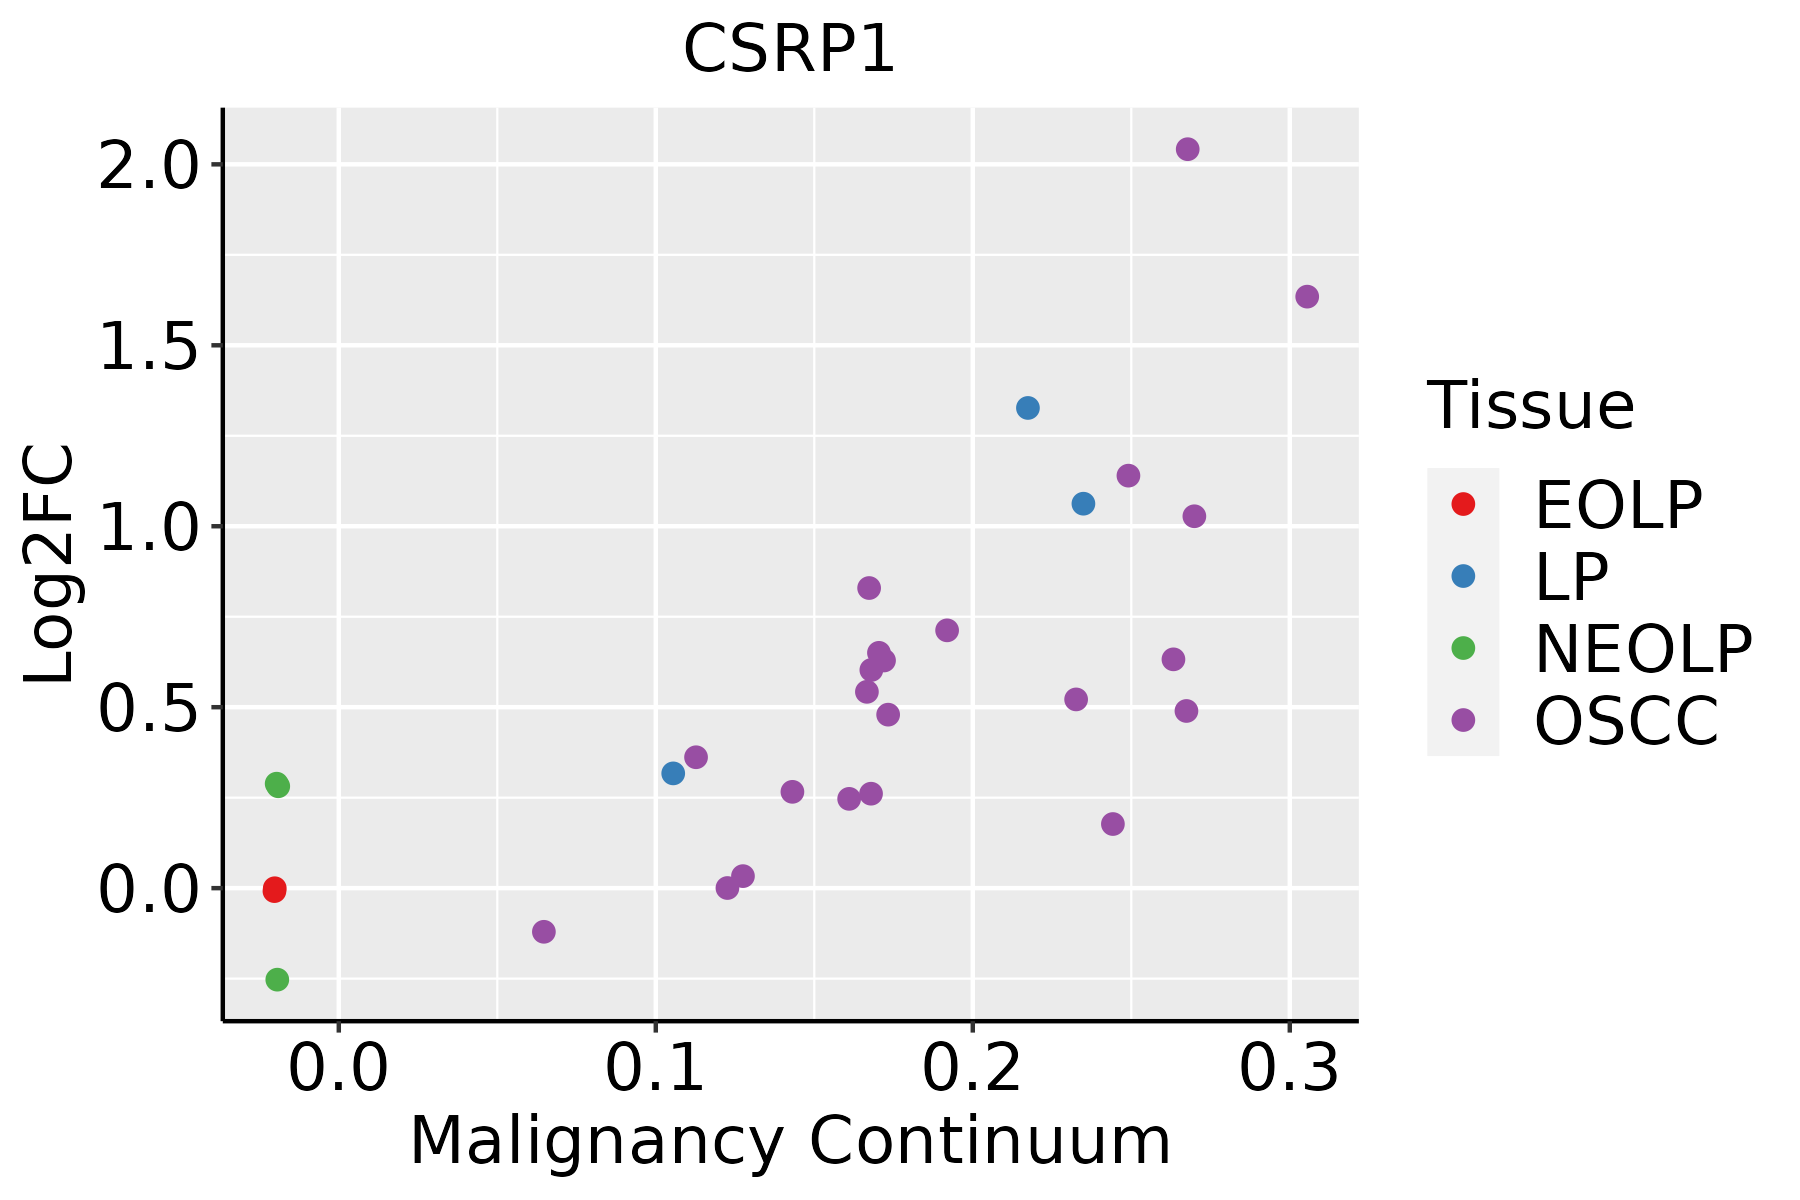 | EOLP: Erosive Oral lichen planus |
| LP: leukoplakia | ||
| NEOLP: Non-erosive oral lichen planus | ||
| OSCC: Oral squamous cell carcinoma | ||
| Prostate |  | BPH: Benign Prostatic Hyperplasia |
| Skin | 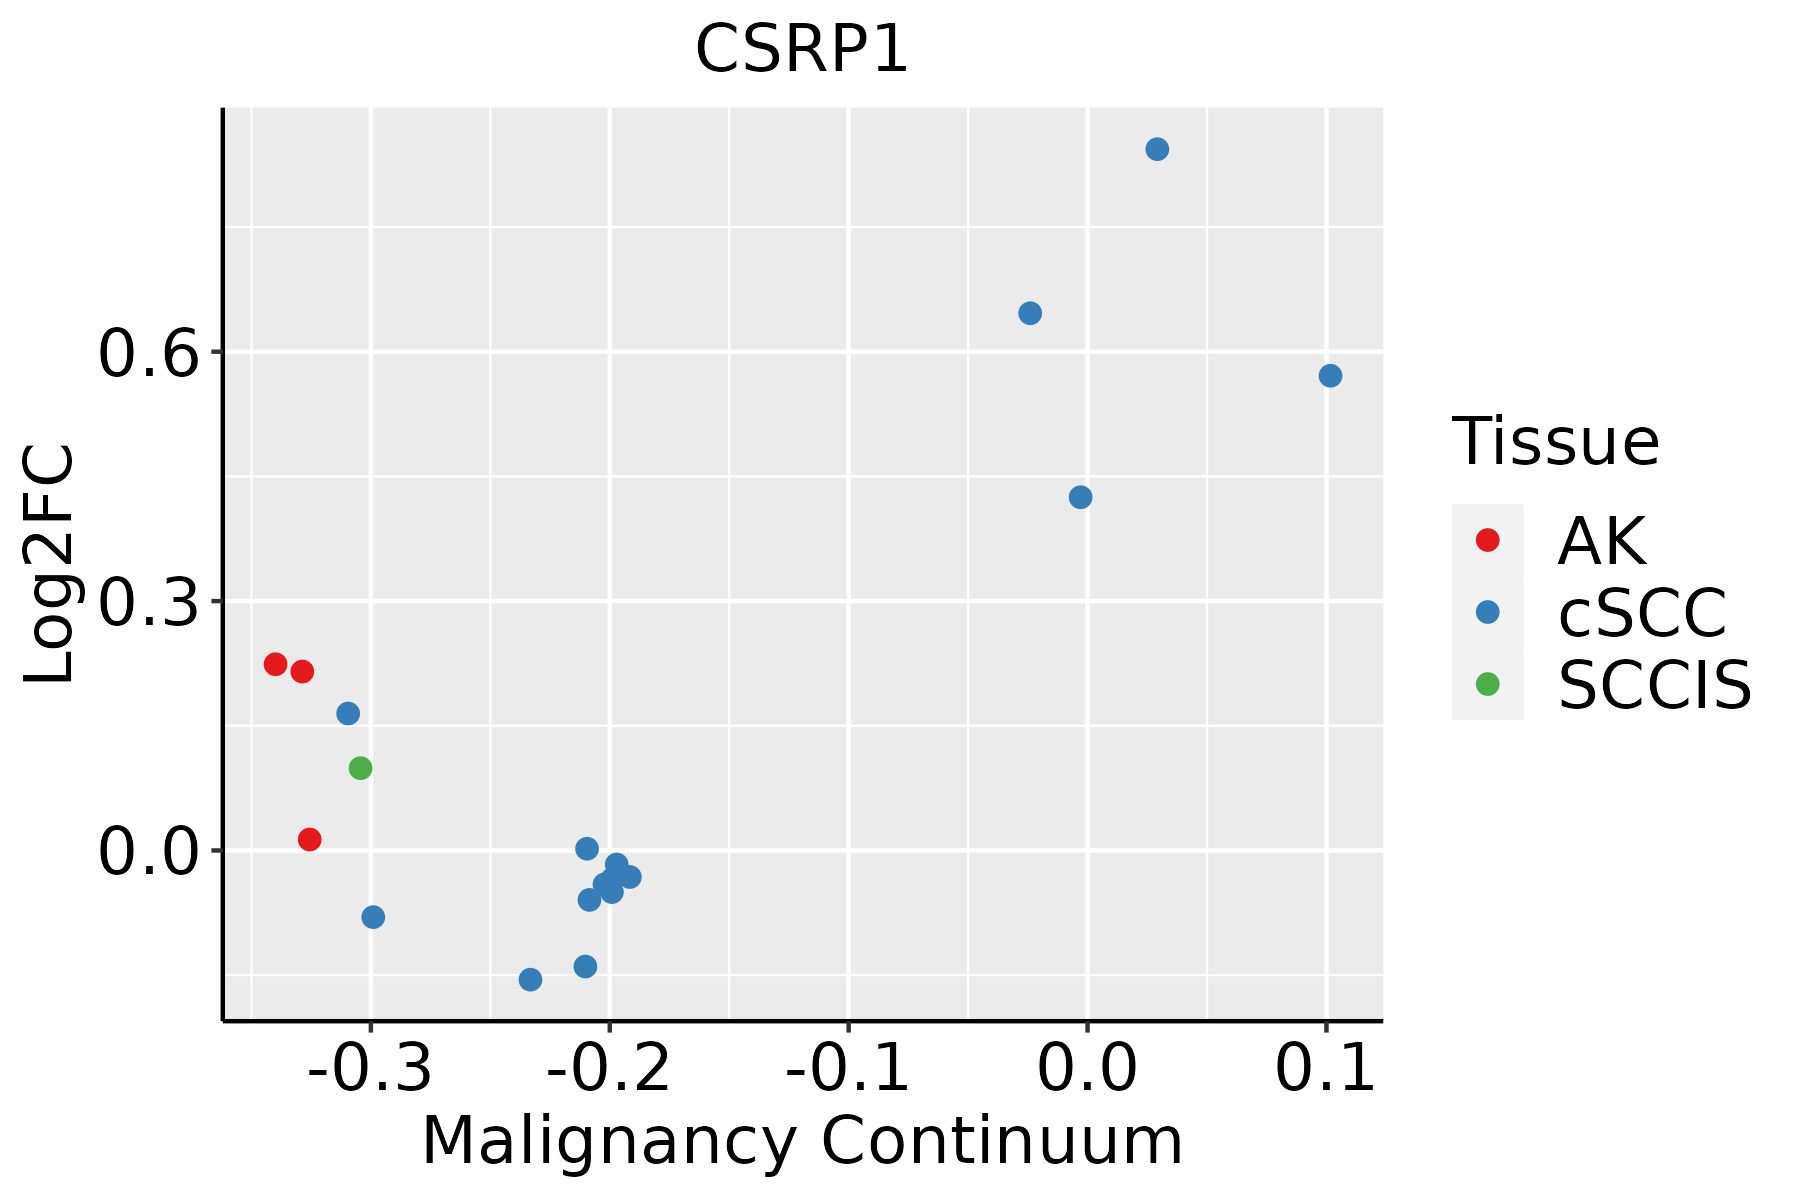 | AK: Actinic keratosis |
| cSCC: Cutaneous squamous cell carcinoma | ||
| SCCIS:squamous cell carcinoma in situ | ||
| Thyroid |  | ATC: Anaplastic thyroid cancer |
| HT: Hashimoto's thyroiditis | ||
| PTC: Papillary thyroid cancer |
| ∗log2FC in expression of this searched gene in stem-like cells from each diseased tissue sample relative to stem-like cells in normal samples in each tissue plotted against the malignancy continuum. Samples are colored based on if they are from different disease stage. |
Top |
Malignant transformation related pathway analysis |
| Find out the enriched GO biological processes and KEGG pathways involved in transition from healthy to precancer to cancer |
| Tissue | Disease Stage | Enriched GO biological Processes |
| Colorectum | AD |  |
| Colorectum | SER |  |
| Colorectum | MSS |  |
| Colorectum | MSI-H |  |
| Colorectum | FAP |  |
| ∗Top 15 enriched GO BP terms are showed in the bar plot of each disease state in each tissue. Each row represents a significant GO biological process which is colored according to the -log10(p.adjust). |
| Page: 1 2 3 4 5 6 7 8 9 |
| GO ID | Tissue | Disease Stage | Description | Gene Ratio | Bg Ratio | pvalue | p.adjust | Count |
| GO:0034109 | Colorectum | AD | homotypic cell-cell adhesion | 40/3918 | 90/18723 | 4.37e-07 | 1.67e-05 | 40 |
| GO:0042060 | Colorectum | AD | wound healing | 128/3918 | 422/18723 | 2.73e-06 | 7.89e-05 | 128 |
| GO:0031032 | Colorectum | AD | actomyosin structure organization | 65/3918 | 196/18723 | 4.17e-05 | 7.37e-04 | 65 |
| GO:0050878 | Colorectum | AD | regulation of body fluid levels | 108/3918 | 379/18723 | 2.54e-04 | 3.20e-03 | 108 |
| GO:0070527 | Colorectum | AD | platelet aggregation | 26/3918 | 67/18723 | 6.20e-04 | 6.48e-03 | 26 |
| GO:004206016 | Endometrium | AEH | wound healing | 91/2100 | 422/18723 | 4.85e-10 | 4.61e-08 | 91 |
| GO:00605376 | Endometrium | AEH | muscle tissue development | 83/2100 | 403/18723 | 2.57e-08 | 1.50e-06 | 83 |
| GO:003103210 | Endometrium | AEH | actomyosin structure organization | 46/2100 | 196/18723 | 8.00e-07 | 2.91e-05 | 46 |
| GO:003410915 | Endometrium | AEH | homotypic cell-cell adhesion | 26/2100 | 90/18723 | 3.75e-06 | 1.00e-04 | 26 |
| GO:00426925 | Endometrium | AEH | muscle cell differentiation | 68/2100 | 384/18723 | 8.88e-05 | 1.30e-03 | 68 |
| GO:00075967 | Endometrium | AEH | blood coagulation | 43/2100 | 217/18723 | 1.42e-04 | 1.89e-03 | 43 |
| GO:00075997 | Endometrium | AEH | hemostasis | 43/2100 | 222/18723 | 2.39e-04 | 2.86e-03 | 43 |
| GO:00508177 | Endometrium | AEH | coagulation | 43/2100 | 222/18723 | 2.39e-04 | 2.86e-03 | 43 |
| GO:007052710 | Endometrium | AEH | platelet aggregation | 18/2100 | 67/18723 | 3.09e-04 | 3.48e-03 | 18 |
| GO:00511465 | Endometrium | AEH | striated muscle cell differentiation | 51/2100 | 283/18723 | 4.20e-04 | 4.46e-03 | 51 |
| GO:005087815 | Endometrium | AEH | regulation of body fluid levels | 64/2100 | 379/18723 | 5.40e-04 | 5.44e-03 | 64 |
| GO:00301683 | Endometrium | AEH | platelet activation | 25/2100 | 123/18723 | 2.26e-03 | 1.74e-02 | 25 |
| GO:004206017 | Endometrium | EEC | wound healing | 92/2168 | 422/18723 | 1.12e-09 | 9.58e-08 | 92 |
| GO:006053713 | Endometrium | EEC | muscle tissue development | 82/2168 | 403/18723 | 2.14e-07 | 9.38e-06 | 82 |
| GO:003103214 | Endometrium | EEC | actomyosin structure organization | 46/2168 | 196/18723 | 1.94e-06 | 5.80e-05 | 46 |
| Page: 1 2 3 4 5 6 7 8 |
| Pathway ID | Tissue | Disease Stage | Description | Gene Ratio | Bg Ratio | pvalue | p.adjust | qvalue | Count |
| Page: 1 |
Top |
Cell-cell communication analysis |
| Identification of potential cell-cell interactions between two cell types and their ligand-receptor pairs for different disease states |
| Ligand | Receptor | LRpair | Pathway | Tissue | Disease Stage |
| Page: 1 |
Top |
Single-cell gene regulatory network inference analysis |
| Find out the significant the regulons (TFs) and the target genes of each regulon across cell types for different disease states |
| TF | Cell Type | Tissue | Disease Stage | Target Gene | RSS | Regulon Activity |
| ∗The dot plots of a searched regulon are shown for all cell subpopulations in each disease state of each tissue based on the regulon specific score inferred using pySCENIC and by calculating the average expression. |
| Page: 1 |
Top |
Somatic mutation of malignant transformation related genes |
| Annotation of somatic variants for genes involved in malignant transformation |
| Hugo Symbol | Variant Class | Variant Classification | dbSNP RS | HGVSc | HGVSp | HGVSp Short | SWISSPROT | BIOTYPE | SIFT | PolyPhen | Tumor Sample Barcode | Tissue | Histology | Sex | Age | Stage | Therapy Types | Drugs | Outcome |
| CSRP1 | SNV | Missense_Mutation | c.5C>G | p.Pro2Arg | p.P2R | P21291 | protein_coding | deleterious(0) | benign(0.275) | TCGA-A8-A09X-01 | Breast | breast invasive carcinoma | Female | <65 | III/IV | Unknown | Unknown | SD | |
| CSRP1 | SNV | Missense_Mutation | novel | c.383N>T | p.Ala128Val | p.A128V | P21291 | protein_coding | deleterious(0.04) | benign(0.201) | TCGA-MA-AA43-01 | Cervix | cervical & endocervical cancer | Female | <65 | III/IV | Unknown | Unknown | SD |
| CSRP1 | SNV | Missense_Mutation | c.260C>T | p.Ser87Leu | p.S87L | P21291 | protein_coding | tolerated(0.31) | benign(0.018) | TCGA-AA-3510-01 | Colorectum | colon adenocarcinoma | Male | >=65 | I/II | Unknown | Unknown | SD | |
| CSRP1 | SNV | Missense_Mutation | rs760988527 | c.386N>T | p.Ala129Val | p.A129V | P21291 | protein_coding | deleterious(0) | probably_damaging(0.975) | TCGA-AA-A010-01 | Colorectum | colon adenocarcinoma | Female | <65 | I/II | Chemotherapy | folinic | CR |
| CSRP1 | SNV | Missense_Mutation | novel | c.168T>G | p.Ile56Met | p.I56M | P21291 | protein_coding | deleterious(0.02) | benign(0.417) | TCGA-F5-6814-01 | Colorectum | rectum adenocarcinoma | Male | <65 | I/II | Unknown | Unknown | SD |
| CSRP1 | SNV | Missense_Mutation | novel | c.395N>C | p.Val132Ala | p.V132A | P21291 | protein_coding | tolerated(0.18) | possibly_damaging(0.709) | TCGA-B5-A3FA-01 | Endometrium | uterine corpus endometrioid carcinoma | Female | >=65 | I/II | Unknown | Unknown | SD |
| CSRP1 | SNV | Missense_Mutation | novel | c.482A>C | p.Lys161Thr | p.K161T | P21291 | protein_coding | deleterious(0.01) | possibly_damaging(0.855) | TCGA-B5-A3FC-01 | Endometrium | uterine corpus endometrioid carcinoma | Female | <65 | I/II | Unknown | Unknown | SD |
| CSRP1 | SNV | Missense_Mutation | rs754606251 | c.257A>T | p.Glu86Val | p.E86V | P21291 | protein_coding | deleterious(0.05) | benign(0.194) | TCGA-D1-A1O7-01 | Endometrium | uterine corpus endometrioid carcinoma | Female | <65 | I/II | Unknown | Unknown | SD |
| CSRP1 | SNV | Missense_Mutation | novel | c.475N>A | p.Ala159Thr | p.A159T | P21291 | protein_coding | tolerated(1) | benign(0.081) | TCGA-95-7567-01 | Lung | lung adenocarcinoma | Male | <65 | I/II | Chemotherapy | cisplatin | SD |
| CSRP1 | SNV | Missense_Mutation | c.282N>T | p.Glu94Asp | p.E94D | P21291 | protein_coding | tolerated(0.35) | benign(0) | TCGA-66-2754-01 | Lung | lung squamous cell carcinoma | Male | >=65 | III/IV | Unknown | Unknown | SD |
| Page: 1 2 |
Top |
Related drugs of malignant transformation related genes |
| Identification of chemicals and drugs interact with genes involved in malignant transfromation |
| (DGIdb 4.0) |
| Entrez ID | Symbol | Category | Interaction Types | Drug Claim Name | Drug Name | PMIDs |
| Page: 1 |

Copyright 2023-Present -The University of Texas Health Science Center at Houston |