
|
|||||
|
 | |
| |
| |
| |
| |
| |
|
Gene: CSRNP3 |
Gene summary for CSRNP3 |
| Gene information | Species | Human | Gene symbol | CSRNP3 | Gene ID | 80034 |
| Gene name | cysteine and serine rich nuclear protein 3 | |
| Gene Alias | FAM130A2 | |
| Cytomap | 2q24.3 | |
| Gene Type | protein-coding | GO ID | GO:0006139 | UniProtAcc | Q8WYN3 |
Top |
Malignant transformation analysis |
| Identification of the aberrant gene expression in precancerous and cancerous lesions by comparing the gene expression of stem-like cells in diseased tissues with normal stem cells |
| Entrez ID | Symbol | Replicates | Species | Organ | Tissue | Adj P-value | Log2FC | Malignancy |
| 80034 | CSRNP3 | HCC1_Meng | Human | Liver | HCC | 2.94e-13 | -5.33e-03 | 0.0246 |
| 80034 | CSRNP3 | HCC1 | Human | Liver | HCC | 3.92e-14 | 1.39e+00 | 0.5336 |
| 80034 | CSRNP3 | S014 | Human | Liver | HCC | 4.34e-06 | 3.99e-01 | 0.2254 |
| 80034 | CSRNP3 | S016 | Human | Liver | HCC | 3.43e-17 | 6.91e-01 | 0.2243 |
| 80034 | CSRNP3 | HTA12-23-1 | Human | Pancreas | PDAC | 1.06e-11 | 9.56e-01 | 0.3405 |
| 80034 | CSRNP3 | HTA12-25-1 | Human | Pancreas | PDAC | 8.60e-13 | 9.93e-01 | 0.313 |
| 80034 | CSRNP3 | HTA12-26-1 | Human | Pancreas | PDAC | 4.51e-30 | 1.24e+00 | 0.3728 |
| 80034 | CSRNP3 | HTA12-29-1 | Human | Pancreas | PDAC | 4.69e-52 | 1.08e+00 | 0.3722 |
| Page: 1 |
| Tissue | Expression Dynamics | Abbreviation |
| Liver | 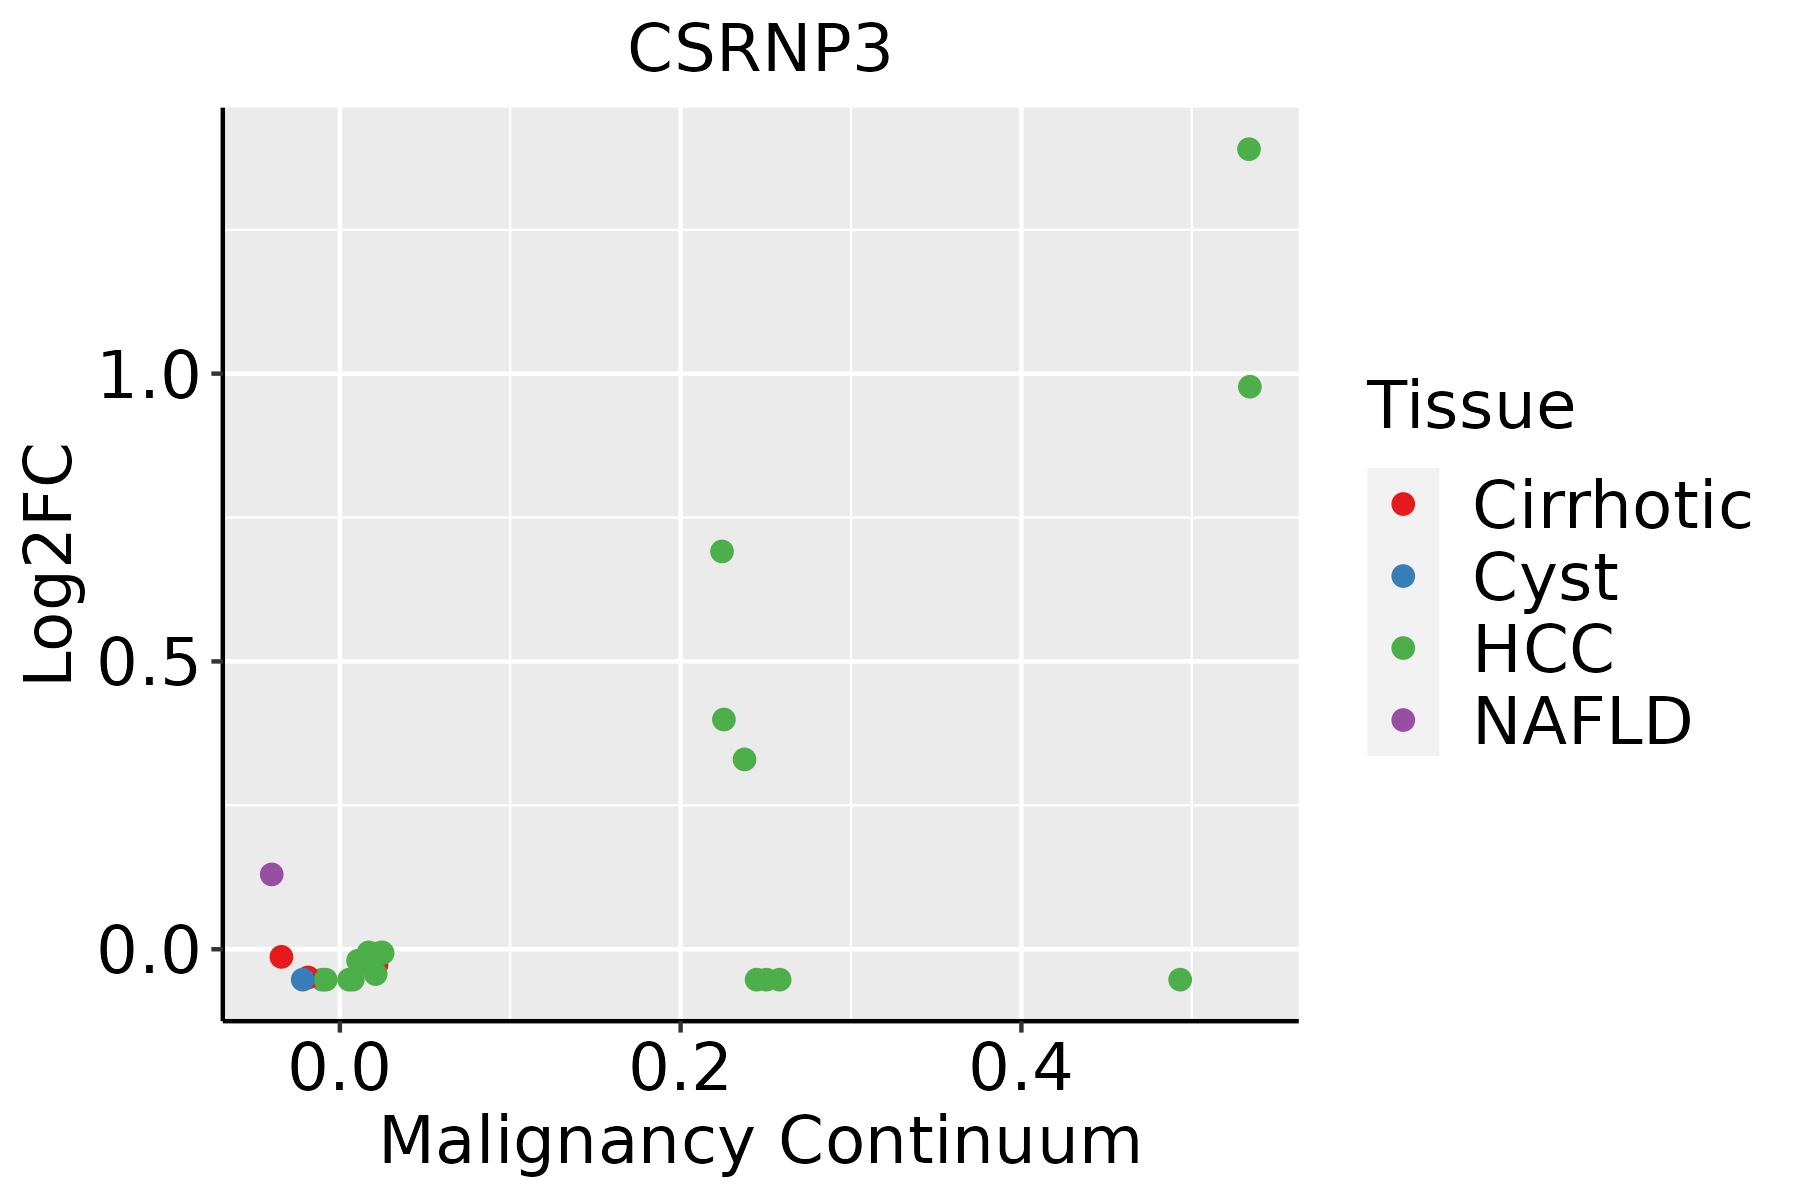 | HCC: Hepatocellular carcinoma |
| NAFLD: Non-alcoholic fatty liver disease |
| ∗log2FC in expression of this searched gene in stem-like cells from each diseased tissue sample relative to stem-like cells in normal samples in each tissue plotted against the malignancy continuum. Samples are colored based on if they are from different disease stage. |
Top |
Malignant transformation related pathway analysis |
| Find out the enriched GO biological processes and KEGG pathways involved in transition from healthy to precancer to cancer |
| Tissue | Disease Stage | Enriched GO biological Processes |
| Colorectum | AD |  |
| Colorectum | SER |  |
| Colorectum | MSS |  |
| Colorectum | MSI-H |  |
| Colorectum | FAP |  |
| ∗Top 15 enriched GO BP terms are showed in the bar plot of each disease state in each tissue. Each row represents a significant GO biological process which is colored according to the -log10(p.adjust). |
| Page: 1 2 3 4 5 6 7 8 9 |
| GO ID | Tissue | Disease Stage | Description | Gene Ratio | Bg Ratio | pvalue | p.adjust | Count |
| Page: 1 |
| Pathway ID | Tissue | Disease Stage | Description | Gene Ratio | Bg Ratio | pvalue | p.adjust | qvalue | Count |
| Page: 1 |
Top |
Cell-cell communication analysis |
| Identification of potential cell-cell interactions between two cell types and their ligand-receptor pairs for different disease states |
| Ligand | Receptor | LRpair | Pathway | Tissue | Disease Stage |
| Page: 1 |
Top |
Single-cell gene regulatory network inference analysis |
| Find out the significant the regulons (TFs) and the target genes of each regulon across cell types for different disease states |
| TF | Cell Type | Tissue | Disease Stage | Target Gene | RSS | Regulon Activity |
| ∗The dot plots of a searched regulon are shown for all cell subpopulations in each disease state of each tissue based on the regulon specific score inferred using pySCENIC and by calculating the average expression. |
| Page: 1 |
Top |
Somatic mutation of malignant transformation related genes |
| Annotation of somatic variants for genes involved in malignant transformation |
| Hugo Symbol | Variant Class | Variant Classification | dbSNP RS | HGVSc | HGVSp | HGVSp Short | SWISSPROT | BIOTYPE | SIFT | PolyPhen | Tumor Sample Barcode | Tissue | Histology | Sex | Age | Stage | Therapy Types | Drugs | Outcome |
| CSRNP3 | SNV | Missense_Mutation | c.1637C>T | p.Ala546Val | p.A546V | Q8WYN3 | protein_coding | tolerated_low_confidence(0.06) | benign(0.005) | TCGA-AR-A0TZ-01 | Breast | breast invasive carcinoma | Female | <65 | III/IV | Unspecific | Doxorubicin | PD | |
| CSRNP3 | SNV | Missense_Mutation | c.436N>C | p.Glu146Gln | p.E146Q | Q8WYN3 | protein_coding | deleterious(0.03) | probably_damaging(0.948) | TCGA-C8-A26Y-01 | Breast | breast invasive carcinoma | Female | >=65 | I/II | Unknown | Unknown | SD | |
| CSRNP3 | SNV | Missense_Mutation | c.73N>C | p.Asp25His | p.D25H | Q8WYN3 | protein_coding | deleterious(0) | probably_damaging(0.982) | TCGA-D8-A1JK-01 | Breast | breast invasive carcinoma | Female | >=65 | I/II | Unknown | Unknown | SD | |
| CSRNP3 | SNV | Missense_Mutation | c.1431N>A | p.Phe477Leu | p.F477L | Q8WYN3 | protein_coding | tolerated_low_confidence(0.06) | benign(0.015) | TCGA-E9-A1NG-01 | Breast | breast invasive carcinoma | Female | <65 | I/II | Hormone Therapy | letrozole | SD | |
| CSRNP3 | insertion | Frame_Shift_Ins | novel | c.1338_1339insATTACAAA | p.Pro447IlefsTer29 | p.P447Ifs*29 | Q8WYN3 | protein_coding | TCGA-AR-A0U0-01 | Breast | breast invasive carcinoma | Female | >=65 | I/II | Unknown | Unknown | SD | ||
| CSRNP3 | SNV | Missense_Mutation | rs569988957 | c.730G>A | p.Gly244Ser | p.G244S | Q8WYN3 | protein_coding | deleterious(0.01) | probably_damaging(0.999) | TCGA-2W-A8YY-01 | Cervix | cervical & endocervical cancer | Female | <65 | I/II | Chemotherapy | cisplatin | CR |
| CSRNP3 | SNV | Missense_Mutation | rs760156809 | c.916G>A | p.Ala306Thr | p.A306T | Q8WYN3 | protein_coding | tolerated(0.67) | benign(0.015) | TCGA-2W-A8YY-01 | Cervix | cervical & endocervical cancer | Female | <65 | I/II | Chemotherapy | cisplatin | CR |
| CSRNP3 | SNV | Missense_Mutation | novel | c.1036N>A | p.Glu346Lys | p.E346K | Q8WYN3 | protein_coding | deleterious(0.01) | possibly_damaging(0.702) | TCGA-C5-A8YQ-01 | Cervix | cervical & endocervical cancer | Female | >=65 | I/II | Chemotherapy | cisplatin | PD |
| CSRNP3 | SNV | Missense_Mutation | c.10N>G | p.Ile4Val | p.I4V | Q8WYN3 | protein_coding | tolerated(0.13) | benign(0.163) | TCGA-AA-3852-01 | Colorectum | colon adenocarcinoma | Male | >=65 | I/II | Unknown | Unknown | PD | |
| CSRNP3 | SNV | Missense_Mutation | rs774567924 | c.1522G>A | p.Glu508Lys | p.E508K | Q8WYN3 | protein_coding | deleterious_low_confidence(0.03) | benign(0.03) | TCGA-AA-3977-01 | Colorectum | colon adenocarcinoma | Male | >=65 | I/II | Unknown | Unknown | SD |
| Page: 1 2 3 4 5 6 7 8 9 10 11 |
Top |
Related drugs of malignant transformation related genes |
| Identification of chemicals and drugs interact with genes involved in malignant transfromation |
| (DGIdb 4.0) |
| Entrez ID | Symbol | Category | Interaction Types | Drug Claim Name | Drug Name | PMIDs |
| 80034 | CSRNP3 | NA | Bisphosphonates |
| Page: 1 |

Copyright 2023-Present -The University of Texas Health Science Center at Houston |