
|
|||||
|
 | |
| |
| |
| |
| |
| |
|
Gene: CSRNP2 |
Gene summary for CSRNP2 |
| Gene information | Species | Human | Gene symbol | CSRNP2 | Gene ID | 81566 |
| Gene name | cysteine and serine rich nuclear protein 2 | |
| Gene Alias | C12orf2 | |
| Cytomap | 12q13.12 | |
| Gene Type | protein-coding | GO ID | GO:0006139 | UniProtAcc | Q9H175 |
Top |
Malignant transformation analysis |
| Identification of the aberrant gene expression in precancerous and cancerous lesions by comparing the gene expression of stem-like cells in diseased tissues with normal stem cells |
| Entrez ID | Symbol | Replicates | Species | Organ | Tissue | Adj P-value | Log2FC | Malignancy |
| 81566 | CSRNP2 | LZE7T | Human | Esophagus | ESCC | 4.08e-02 | 1.41e-01 | 0.0667 |
| 81566 | CSRNP2 | LZE24T | Human | Esophagus | ESCC | 6.80e-08 | 1.85e-01 | 0.0596 |
| 81566 | CSRNP2 | P1T-E | Human | Esophagus | ESCC | 4.25e-10 | 5.59e-01 | 0.0875 |
| 81566 | CSRNP2 | P2T-E | Human | Esophagus | ESCC | 4.80e-21 | 2.16e-01 | 0.1177 |
| 81566 | CSRNP2 | P5T-E | Human | Esophagus | ESCC | 3.60e-03 | 5.57e-02 | 0.1327 |
| 81566 | CSRNP2 | P8T-E | Human | Esophagus | ESCC | 5.03e-11 | 1.12e-01 | 0.0889 |
| 81566 | CSRNP2 | P9T-E | Human | Esophagus | ESCC | 5.43e-04 | 6.04e-02 | 0.1131 |
| 81566 | CSRNP2 | P10T-E | Human | Esophagus | ESCC | 6.80e-09 | 8.73e-02 | 0.116 |
| 81566 | CSRNP2 | P11T-E | Human | Esophagus | ESCC | 7.49e-08 | 1.68e-01 | 0.1426 |
| 81566 | CSRNP2 | P12T-E | Human | Esophagus | ESCC | 2.52e-06 | 9.51e-02 | 0.1122 |
| 81566 | CSRNP2 | P15T-E | Human | Esophagus | ESCC | 2.92e-09 | 9.75e-02 | 0.1149 |
| 81566 | CSRNP2 | P16T-E | Human | Esophagus | ESCC | 2.52e-07 | 1.31e-01 | 0.1153 |
| 81566 | CSRNP2 | P20T-E | Human | Esophagus | ESCC | 4.14e-06 | 1.48e-01 | 0.1124 |
| 81566 | CSRNP2 | P22T-E | Human | Esophagus | ESCC | 2.13e-09 | 1.07e-01 | 0.1236 |
| 81566 | CSRNP2 | P23T-E | Human | Esophagus | ESCC | 2.31e-06 | 1.38e-01 | 0.108 |
| 81566 | CSRNP2 | P24T-E | Human | Esophagus | ESCC | 3.45e-13 | 1.18e-01 | 0.1287 |
| 81566 | CSRNP2 | P26T-E | Human | Esophagus | ESCC | 3.05e-05 | 9.89e-02 | 0.1276 |
| 81566 | CSRNP2 | P27T-E | Human | Esophagus | ESCC | 1.61e-15 | 1.61e-01 | 0.1055 |
| 81566 | CSRNP2 | P28T-E | Human | Esophagus | ESCC | 6.68e-09 | 1.16e-01 | 0.1149 |
| 81566 | CSRNP2 | P31T-E | Human | Esophagus | ESCC | 9.42e-10 | 1.07e-01 | 0.1251 |
| Page: 1 2 3 |
| Tissue | Expression Dynamics | Abbreviation |
| Esophagus | 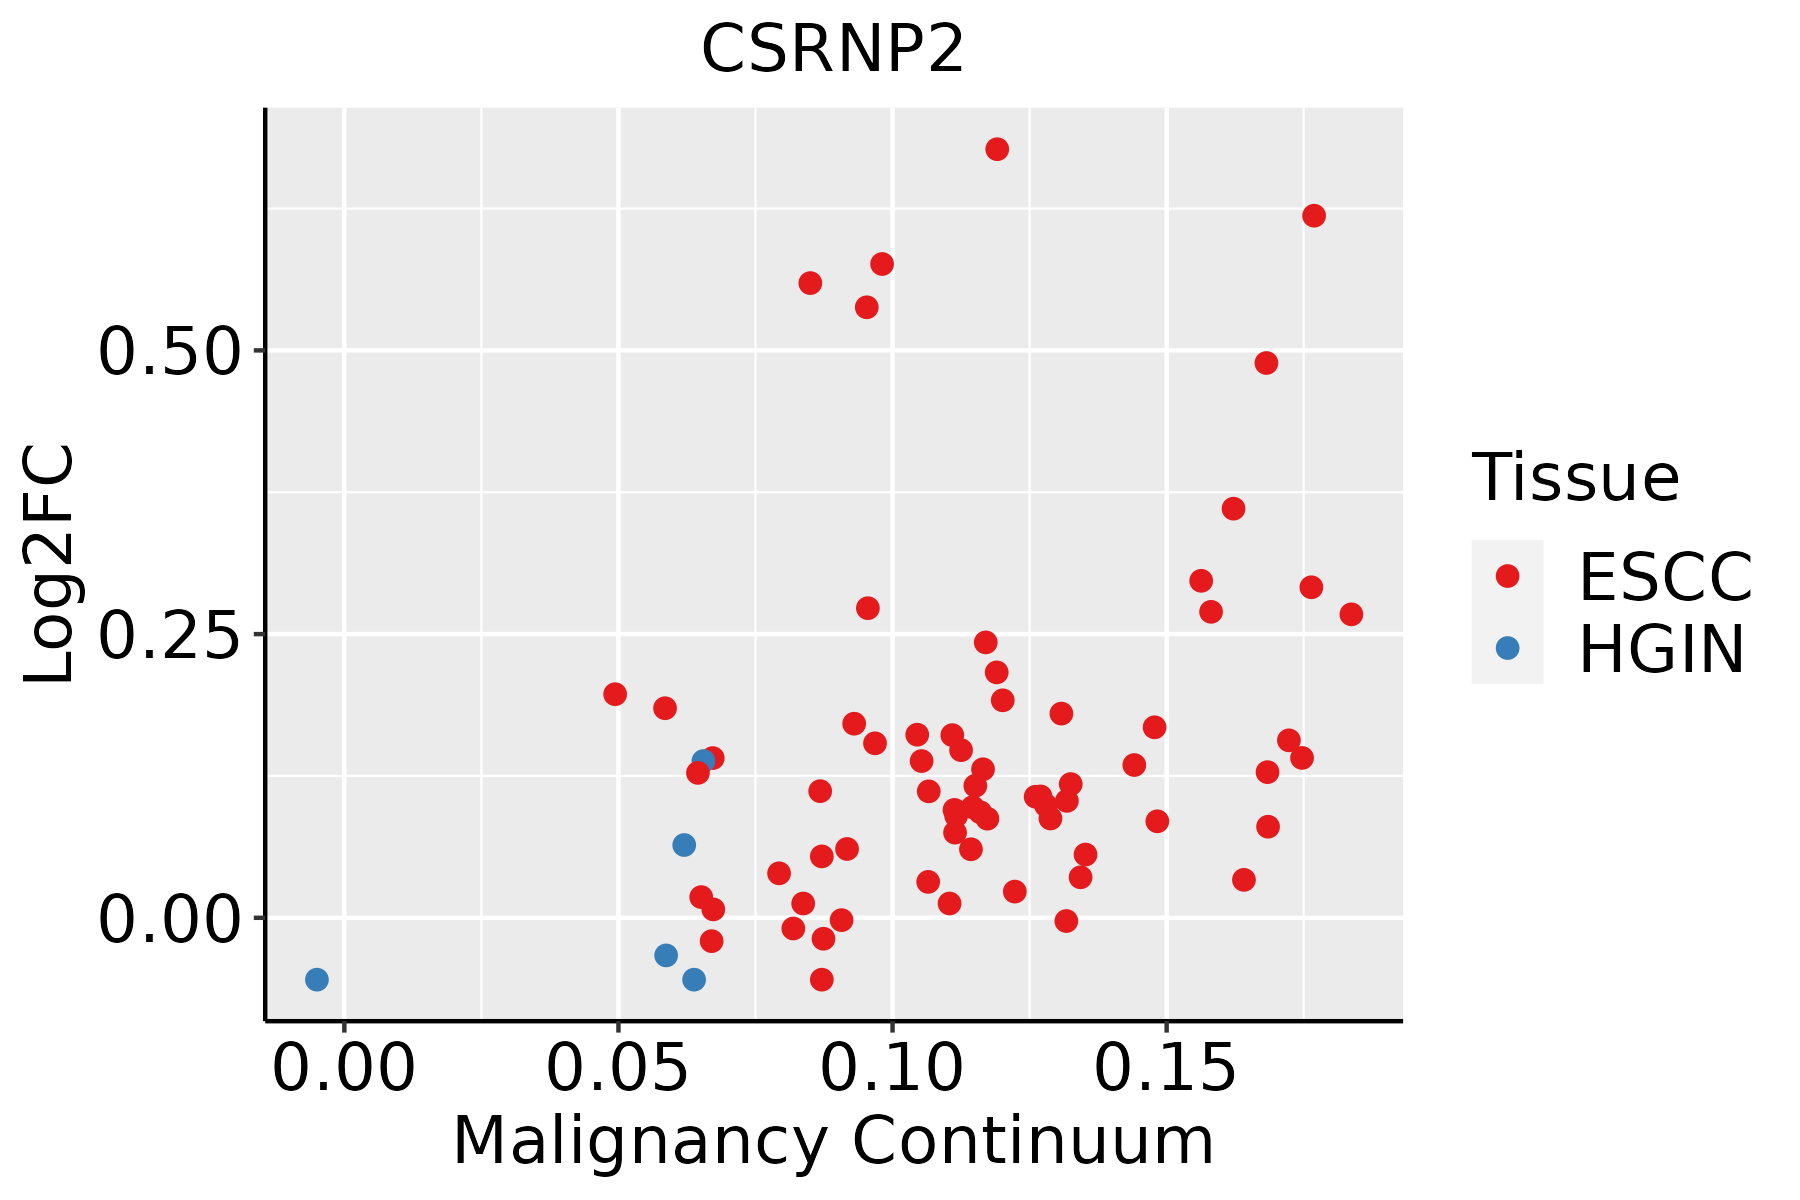 | ESCC: Esophageal squamous cell carcinoma |
| HGIN: High-grade intraepithelial neoplasias | ||
| LGIN: Low-grade intraepithelial neoplasias |
| ∗log2FC in expression of this searched gene in stem-like cells from each diseased tissue sample relative to stem-like cells in normal samples in each tissue plotted against the malignancy continuum. Samples are colored based on if they are from different disease stage. |
Top |
Malignant transformation related pathway analysis |
| Find out the enriched GO biological processes and KEGG pathways involved in transition from healthy to precancer to cancer |
| Tissue | Disease Stage | Enriched GO biological Processes |
| Colorectum | AD |  |
| Colorectum | SER |  |
| Colorectum | MSS |  |
| Colorectum | MSI-H |  |
| Colorectum | FAP |  |
| ∗Top 15 enriched GO BP terms are showed in the bar plot of each disease state in each tissue. Each row represents a significant GO biological process which is colored according to the -log10(p.adjust). |
| Page: 1 2 3 4 5 6 7 8 9 |
| GO ID | Tissue | Disease Stage | Description | Gene Ratio | Bg Ratio | pvalue | p.adjust | Count |
| Page: 1 |
| Pathway ID | Tissue | Disease Stage | Description | Gene Ratio | Bg Ratio | pvalue | p.adjust | qvalue | Count |
| Page: 1 |
Top |
Cell-cell communication analysis |
| Identification of potential cell-cell interactions between two cell types and their ligand-receptor pairs for different disease states |
| Ligand | Receptor | LRpair | Pathway | Tissue | Disease Stage |
| Page: 1 |
Top |
Single-cell gene regulatory network inference analysis |
| Find out the significant the regulons (TFs) and the target genes of each regulon across cell types for different disease states |
| TF | Cell Type | Tissue | Disease Stage | Target Gene | RSS | Regulon Activity |
| ∗The dot plots of a searched regulon are shown for all cell subpopulations in each disease state of each tissue based on the regulon specific score inferred using pySCENIC and by calculating the average expression. |
| Page: 1 |
Top |
Somatic mutation of malignant transformation related genes |
| Annotation of somatic variants for genes involved in malignant transformation |
| Hugo Symbol | Variant Class | Variant Classification | dbSNP RS | HGVSc | HGVSp | HGVSp Short | SWISSPROT | BIOTYPE | SIFT | PolyPhen | Tumor Sample Barcode | Tissue | Histology | Sex | Age | Stage | Therapy Types | Drugs | Outcome |
| CSRNP2 | SNV | Missense_Mutation | rs755033547 | c.1361N>C | p.Leu454Pro | p.L454P | Q9H175 | protein_coding | deleterious_low_confidence(0.01) | benign(0.311) | TCGA-A2-A0CW-01 | Breast | breast invasive carcinoma | Female | >=65 | I/II | Hormone Therapy | anastrozole | SD |
| CSRNP2 | SNV | Missense_Mutation | c.314N>G | p.Tyr105Cys | p.Y105C | Q9H175 | protein_coding | deleterious(0) | probably_damaging(0.999) | TCGA-BH-A18G-01 | Breast | breast invasive carcinoma | Female | >=65 | I/II | Unknown | Unknown | SD | |
| CSRNP2 | SNV | Missense_Mutation | c.1331C>G | p.Pro444Arg | p.P444R | Q9H175 | protein_coding | deleterious_low_confidence(0.01) | benign(0.112) | TCGA-BH-A18V-01 | Breast | breast invasive carcinoma | Female | <65 | I/II | Unknown | Unknown | SD | |
| CSRNP2 | SNV | Missense_Mutation | rs777028747 | c.356N>A | p.Arg119Gln | p.R119Q | Q9H175 | protein_coding | tolerated(0.05) | benign(0.219) | TCGA-E9-A22D-01 | Breast | breast invasive carcinoma | Female | <65 | I/II | Chemotherapy | 5-fluorouracil | SD |
| CSRNP2 | insertion | Frame_Shift_Ins | novel | c.872_873insATCTTTTTCAAAG | p.Asp291GlufsTer6 | p.D291Efs*6 | Q9H175 | protein_coding | TCGA-A2-A0CU-01 | Breast | breast invasive carcinoma | Female | >=65 | I/II | Hormone Therapy | tamoxiphen | SD | ||
| CSRNP2 | SNV | Missense_Mutation | rs377254873 | c.1105G>A | p.Glu369Lys | p.E369K | Q9H175 | protein_coding | tolerated(0.08) | benign(0.003) | TCGA-C5-A3HE-01 | Cervix | cervical & endocervical cancer | Female | <65 | I/II | Unknown | Unknown | PD |
| CSRNP2 | SNV | Missense_Mutation | novel | c.30N>C | p.Lys10Asn | p.K10N | Q9H175 | protein_coding | deleterious(0) | probably_damaging(0.996) | TCGA-VS-A958-01 | Cervix | cervical & endocervical cancer | Female | <65 | I/II | Chemotherapy | cisplatin | CR |
| CSRNP2 | SNV | Missense_Mutation | rs150988431 | c.1186N>A | p.Glu396Lys | p.E396K | Q9H175 | protein_coding | deleterious_low_confidence(0.01) | possibly_damaging(0.458) | TCGA-AA-3713-01 | Colorectum | colon adenocarcinoma | Male | >=65 | III/IV | Chemotherapy | 5-fluorouracil | PR |
| CSRNP2 | SNV | Missense_Mutation | c.1513N>T | p.Pro505Ser | p.P505S | Q9H175 | protein_coding | deleterious_low_confidence(0.01) | benign(0.001) | TCGA-AA-3821-01 | Colorectum | colon adenocarcinoma | Female | >=65 | I/II | Unknown | Unknown | SD | |
| CSRNP2 | SNV | Missense_Mutation | rs775963118 | c.1459N>A | p.Glu487Lys | p.E487K | Q9H175 | protein_coding | deleterious_low_confidence(0) | benign(0.054) | TCGA-AA-3984-01 | Colorectum | colon adenocarcinoma | Female | <65 | I/II | Unknown | Unknown | SD |
| Page: 1 2 3 4 5 |
Top |
Related drugs of malignant transformation related genes |
| Identification of chemicals and drugs interact with genes involved in malignant transfromation |
| (DGIdb 4.0) |
| Entrez ID | Symbol | Category | Interaction Types | Drug Claim Name | Drug Name | PMIDs |
| Page: 1 |

Copyright 2023-Present -The University of Texas Health Science Center at Houston |