
|
|||||
|
 | |
| |
| |
| |
| |
| |
|
Gene: CSRNP1 |
Gene summary for CSRNP1 |
| Gene information | Species | Human | Gene symbol | CSRNP1 | Gene ID | 64651 |
| Gene name | cysteine and serine rich nuclear protein 1 | |
| Gene Alias | AXUD1 | |
| Cytomap | 3p22.2 | |
| Gene Type | protein-coding | GO ID | GO:0001501 | UniProtAcc | A0A024R2N7 |
Top |
Malignant transformation analysis |
| Identification of the aberrant gene expression in precancerous and cancerous lesions by comparing the gene expression of stem-like cells in diseased tissues with normal stem cells |
| Entrez ID | Symbol | Replicates | Species | Organ | Tissue | Adj P-value | Log2FC | Malignancy |
| 64651 | CSRNP1 | LZE4T | Human | Esophagus | ESCC | 1.08e-06 | -1.55e-01 | 0.0811 |
| 64651 | CSRNP1 | LZE7T | Human | Esophagus | ESCC | 3.65e-05 | -2.20e-01 | 0.0667 |
| 64651 | CSRNP1 | LZE8T | Human | Esophagus | ESCC | 1.08e-06 | -2.50e-01 | 0.067 |
| 64651 | CSRNP1 | LZE20T | Human | Esophagus | ESCC | 3.33e-10 | -2.65e-01 | 0.0662 |
| 64651 | CSRNP1 | LZE24T | Human | Esophagus | ESCC | 3.91e-06 | 6.15e-01 | 0.0596 |
| 64651 | CSRNP1 | LZE6T | Human | Esophagus | ESCC | 6.03e-03 | -2.91e-01 | 0.0845 |
| 64651 | CSRNP1 | P2T-E | Human | Esophagus | ESCC | 2.00e-07 | 1.68e-01 | 0.1177 |
| 64651 | CSRNP1 | P4T-E | Human | Esophagus | ESCC | 1.52e-07 | 2.79e-01 | 0.1323 |
| 64651 | CSRNP1 | P5T-E | Human | Esophagus | ESCC | 2.35e-06 | -2.36e-01 | 0.1327 |
| 64651 | CSRNP1 | P8T-E | Human | Esophagus | ESCC | 8.48e-16 | 5.77e-01 | 0.0889 |
| 64651 | CSRNP1 | P9T-E | Human | Esophagus | ESCC | 4.19e-08 | 2.64e-01 | 0.1131 |
| 64651 | CSRNP1 | P10T-E | Human | Esophagus | ESCC | 2.53e-07 | -3.38e-01 | 0.116 |
| 64651 | CSRNP1 | P11T-E | Human | Esophagus | ESCC | 2.28e-12 | 1.10e+00 | 0.1426 |
| 64651 | CSRNP1 | P12T-E | Human | Esophagus | ESCC | 1.07e-18 | 9.97e-01 | 0.1122 |
| 64651 | CSRNP1 | P16T-E | Human | Esophagus | ESCC | 6.89e-11 | -1.18e-01 | 0.1153 |
| 64651 | CSRNP1 | P20T-E | Human | Esophagus | ESCC | 9.22e-13 | 6.57e-01 | 0.1124 |
| 64651 | CSRNP1 | P21T-E | Human | Esophagus | ESCC | 2.16e-06 | 2.64e-01 | 0.1617 |
| 64651 | CSRNP1 | P22T-E | Human | Esophagus | ESCC | 1.92e-06 | -2.12e-01 | 0.1236 |
| 64651 | CSRNP1 | P23T-E | Human | Esophagus | ESCC | 1.61e-11 | 6.06e-01 | 0.108 |
| 64651 | CSRNP1 | P24T-E | Human | Esophagus | ESCC | 1.30e-03 | 1.22e-01 | 0.1287 |
| Page: 1 2 3 4 5 6 |
| Tissue | Expression Dynamics | Abbreviation |
| Esophagus |  | ESCC: Esophageal squamous cell carcinoma |
| HGIN: High-grade intraepithelial neoplasias | ||
| LGIN: Low-grade intraepithelial neoplasias | ||
| Liver | 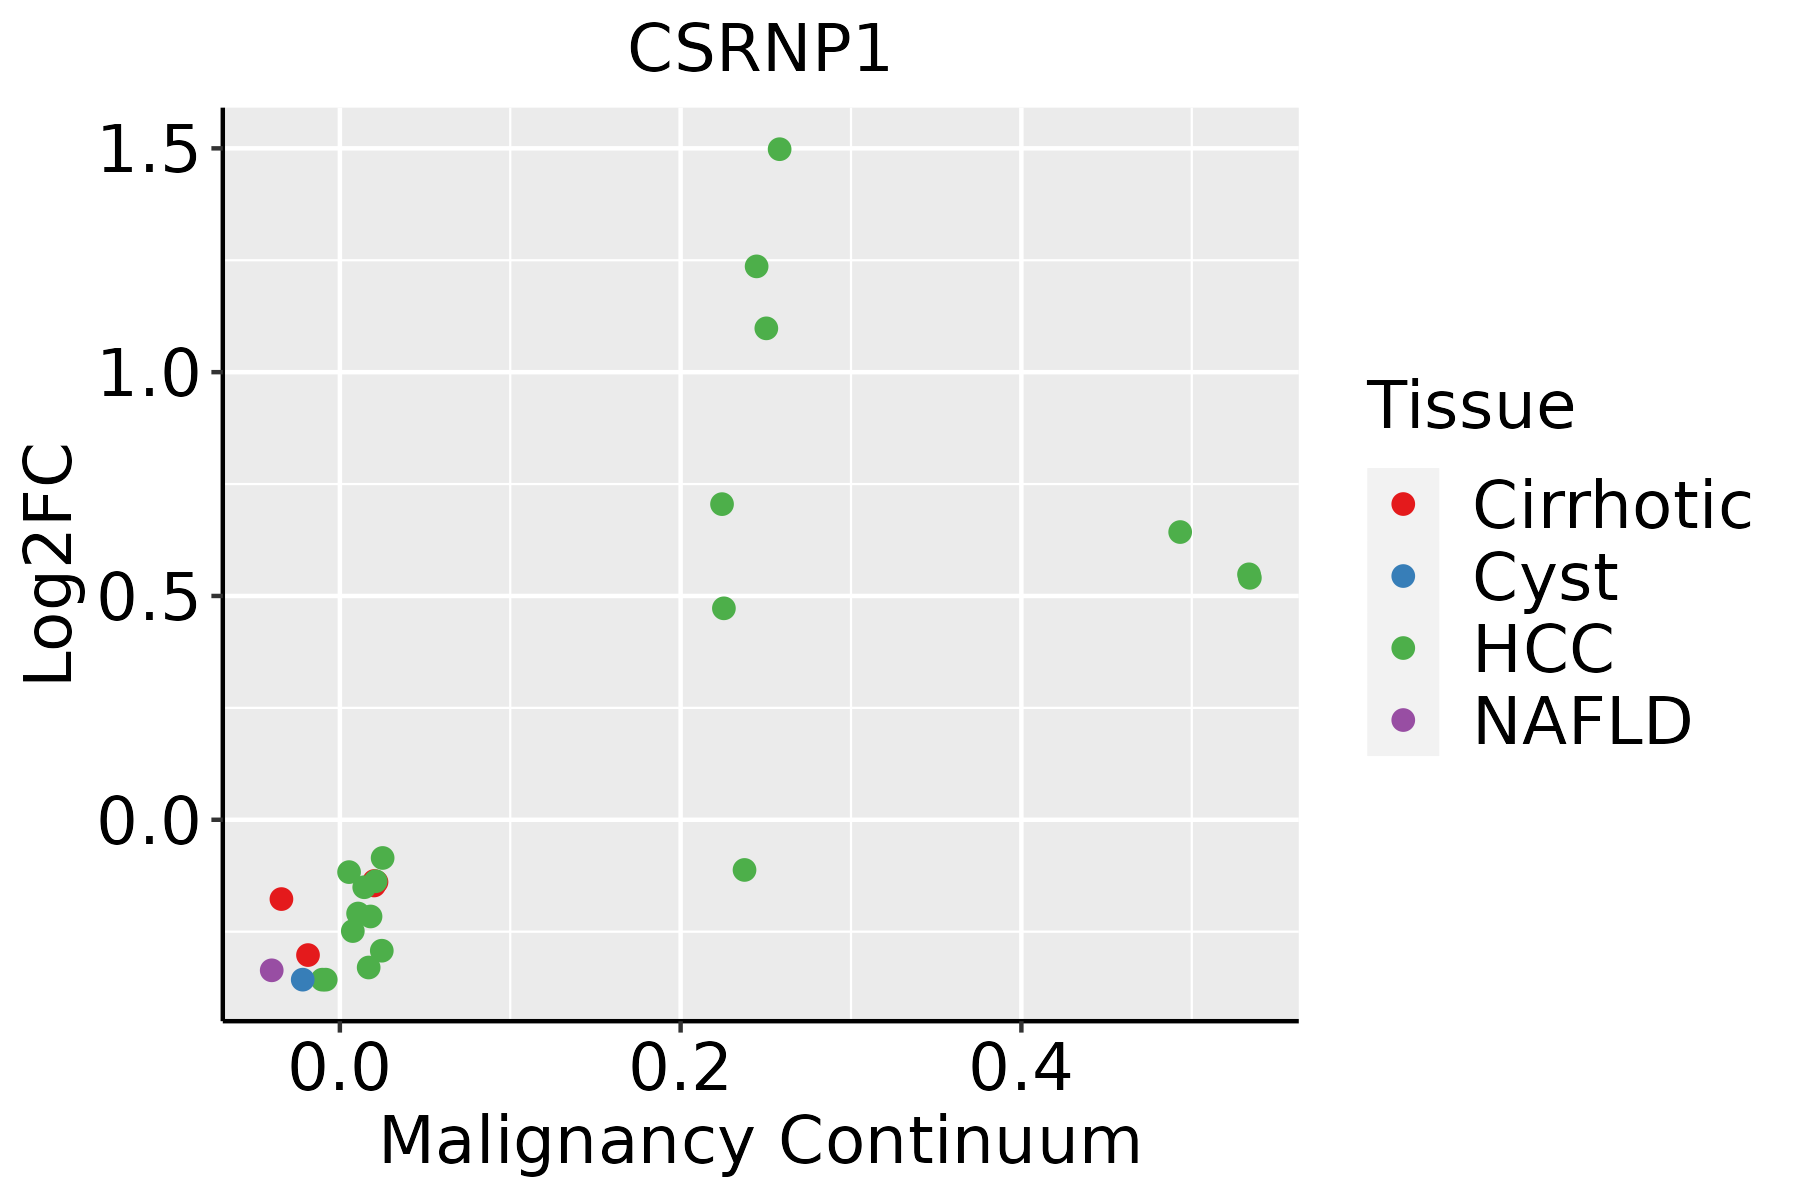 | HCC: Hepatocellular carcinoma |
| NAFLD: Non-alcoholic fatty liver disease | ||
| Oral Cavity | 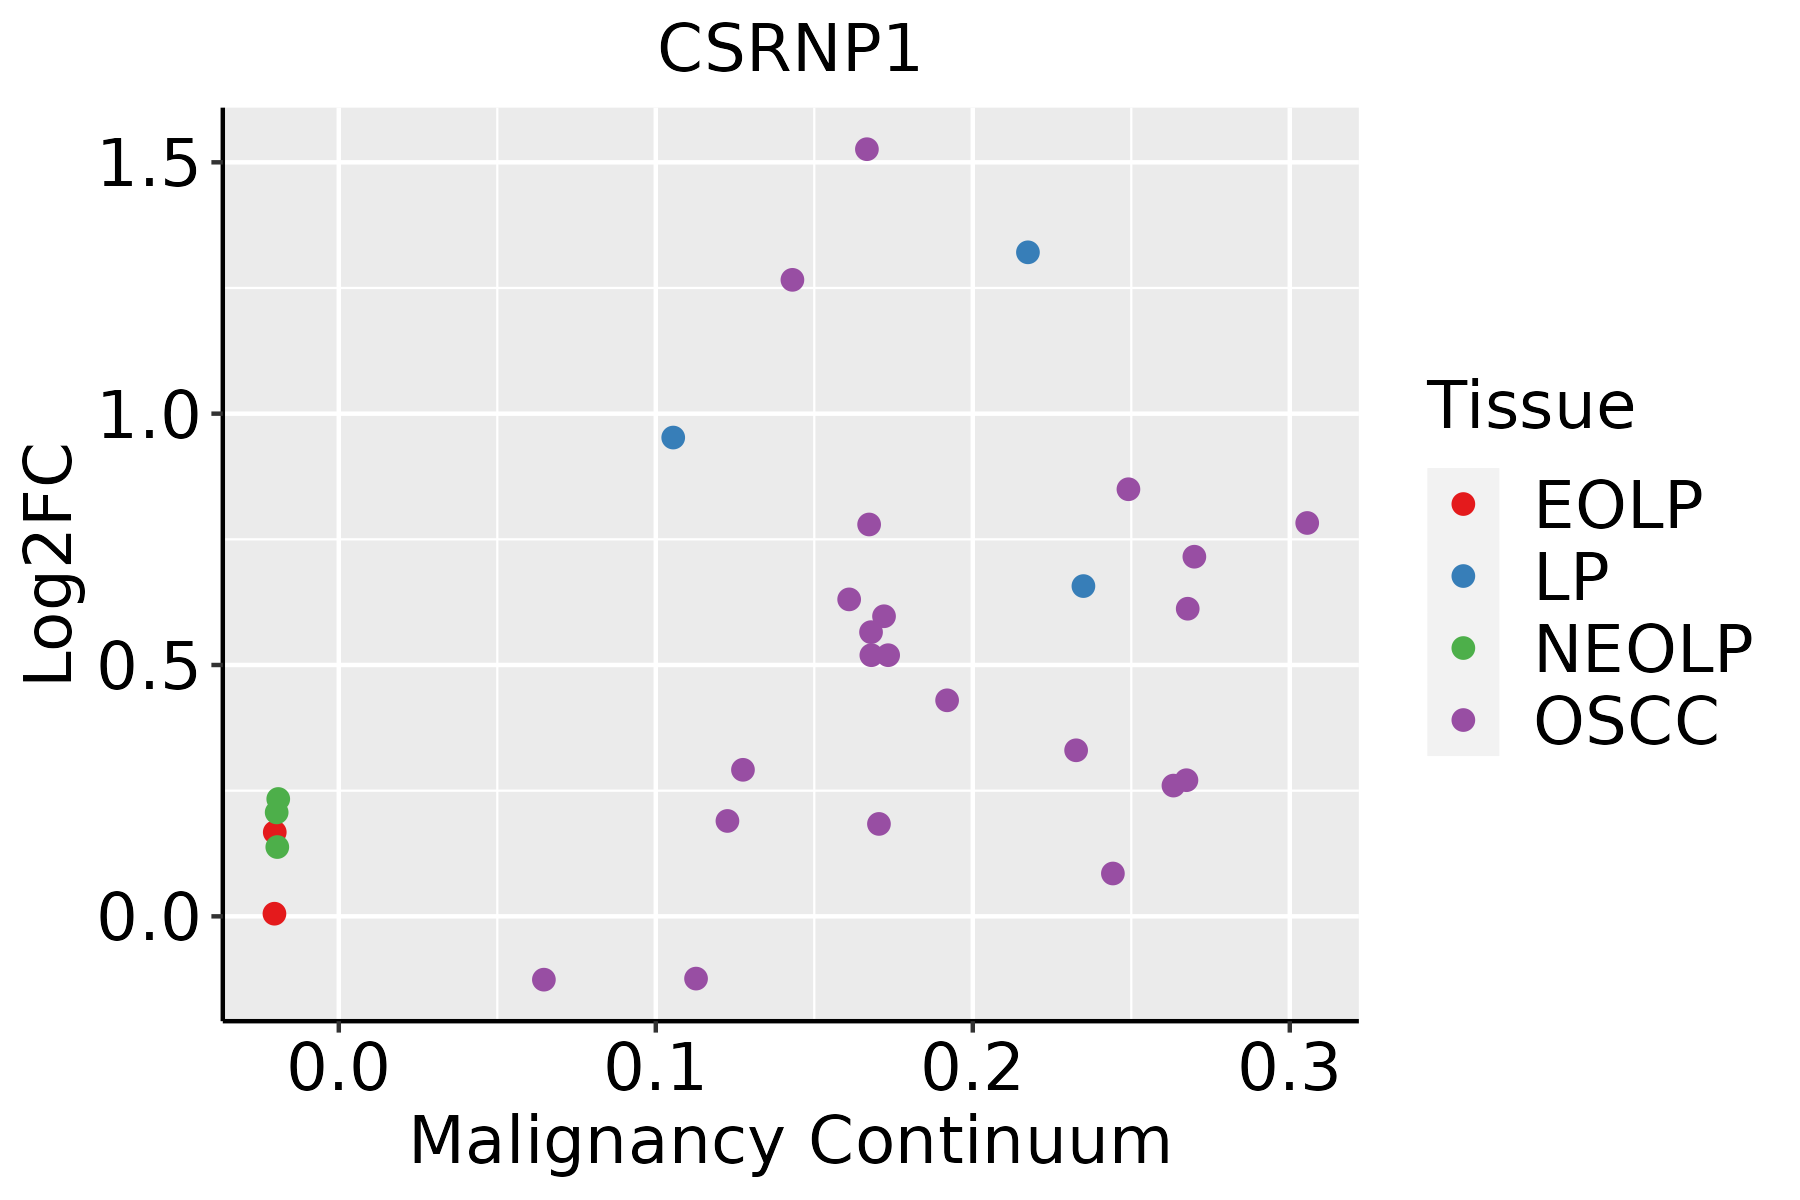 | EOLP: Erosive Oral lichen planus |
| LP: leukoplakia | ||
| NEOLP: Non-erosive oral lichen planus | ||
| OSCC: Oral squamous cell carcinoma | ||
| Prostate | 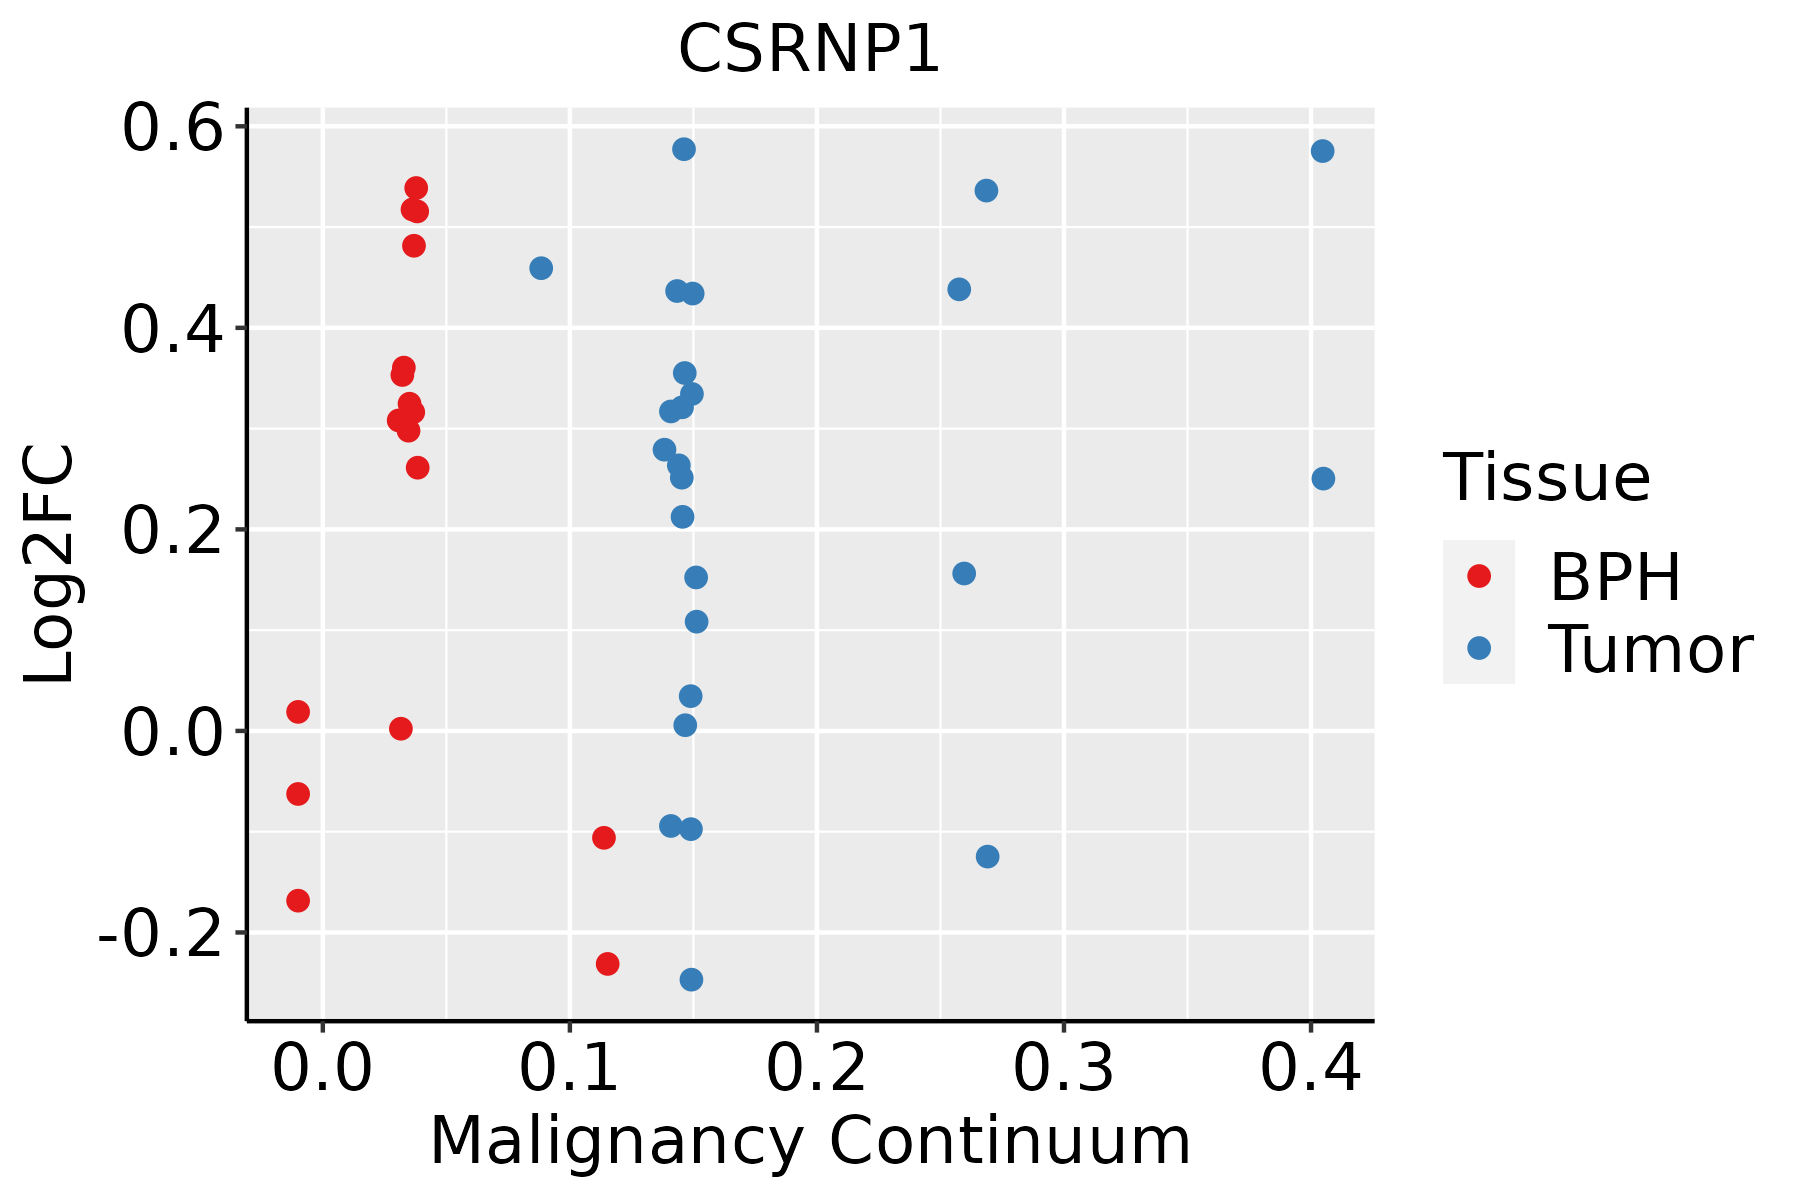 | BPH: Benign Prostatic Hyperplasia |
| Skin | 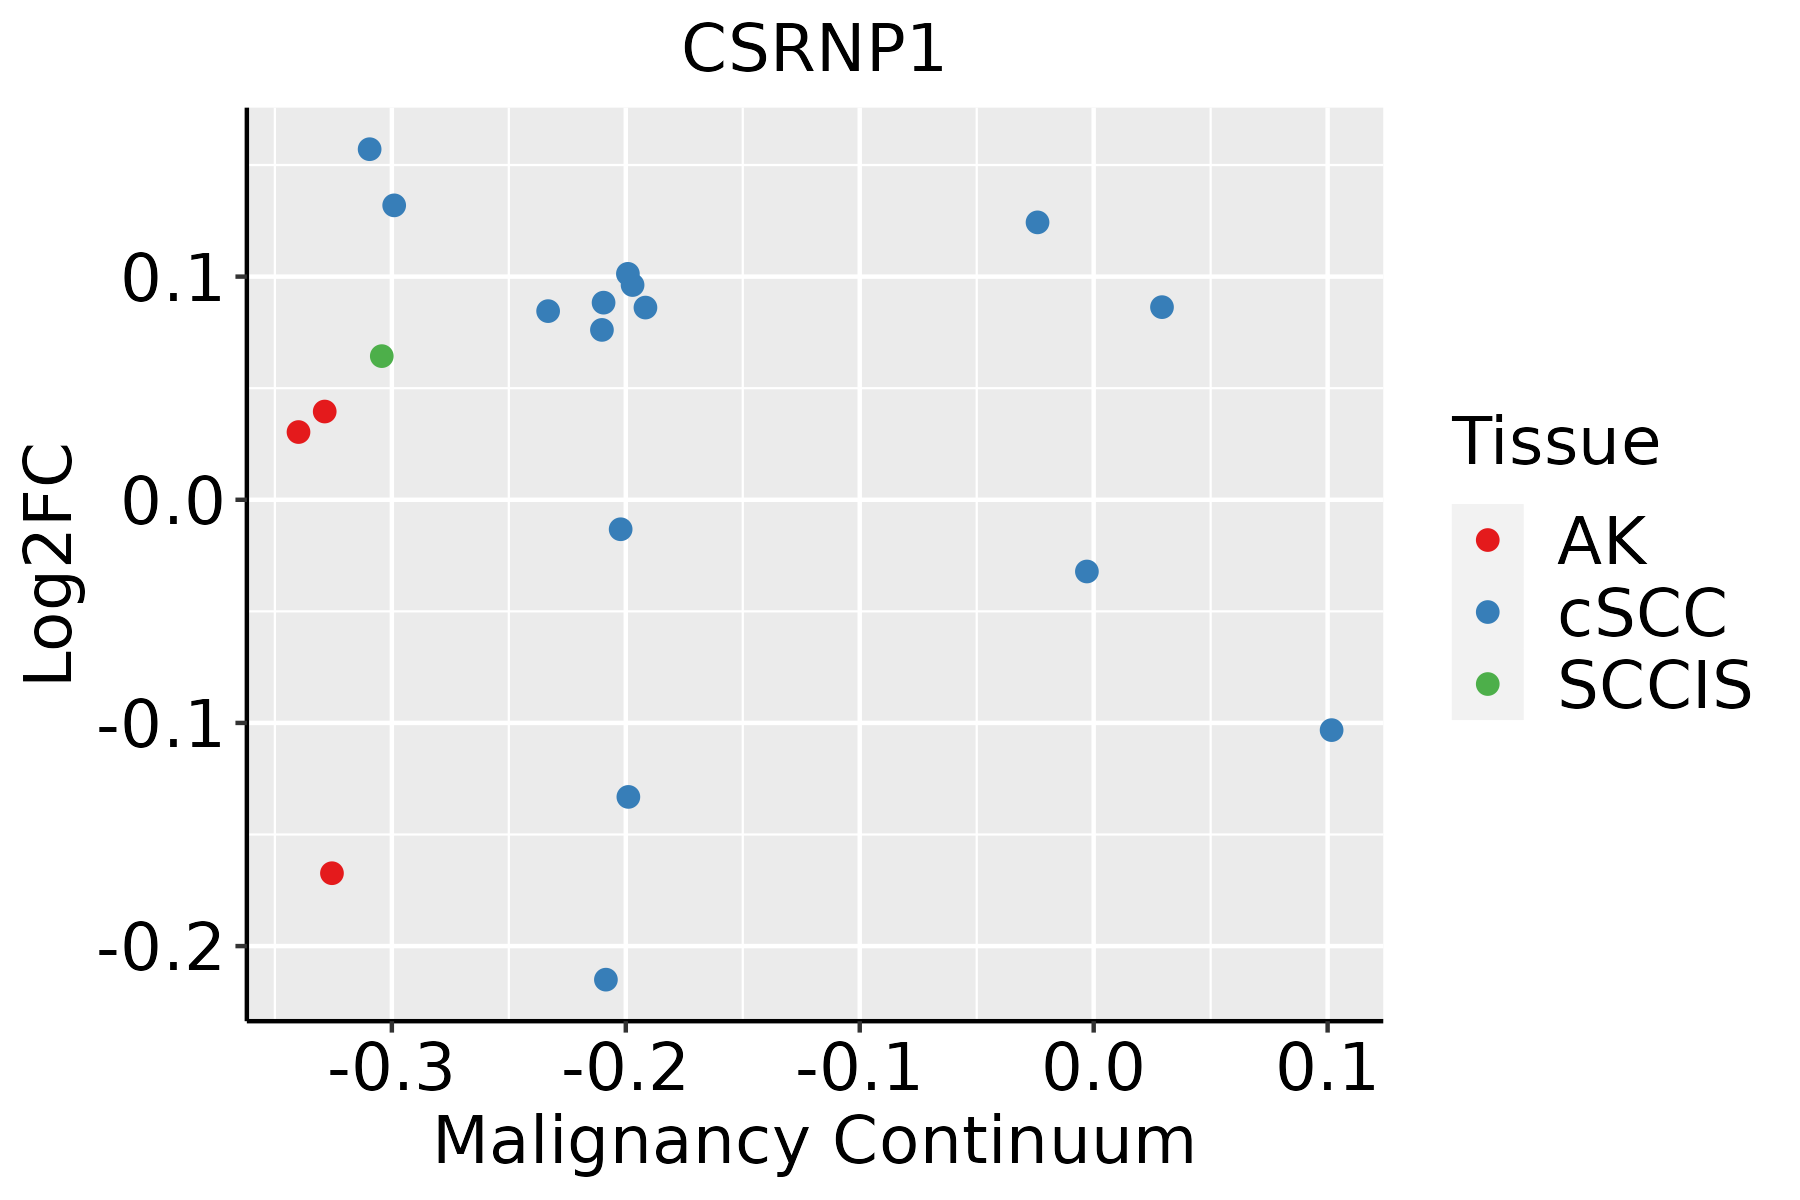 | AK: Actinic keratosis |
| cSCC: Cutaneous squamous cell carcinoma | ||
| SCCIS:squamous cell carcinoma in situ | ||
| Thyroid | 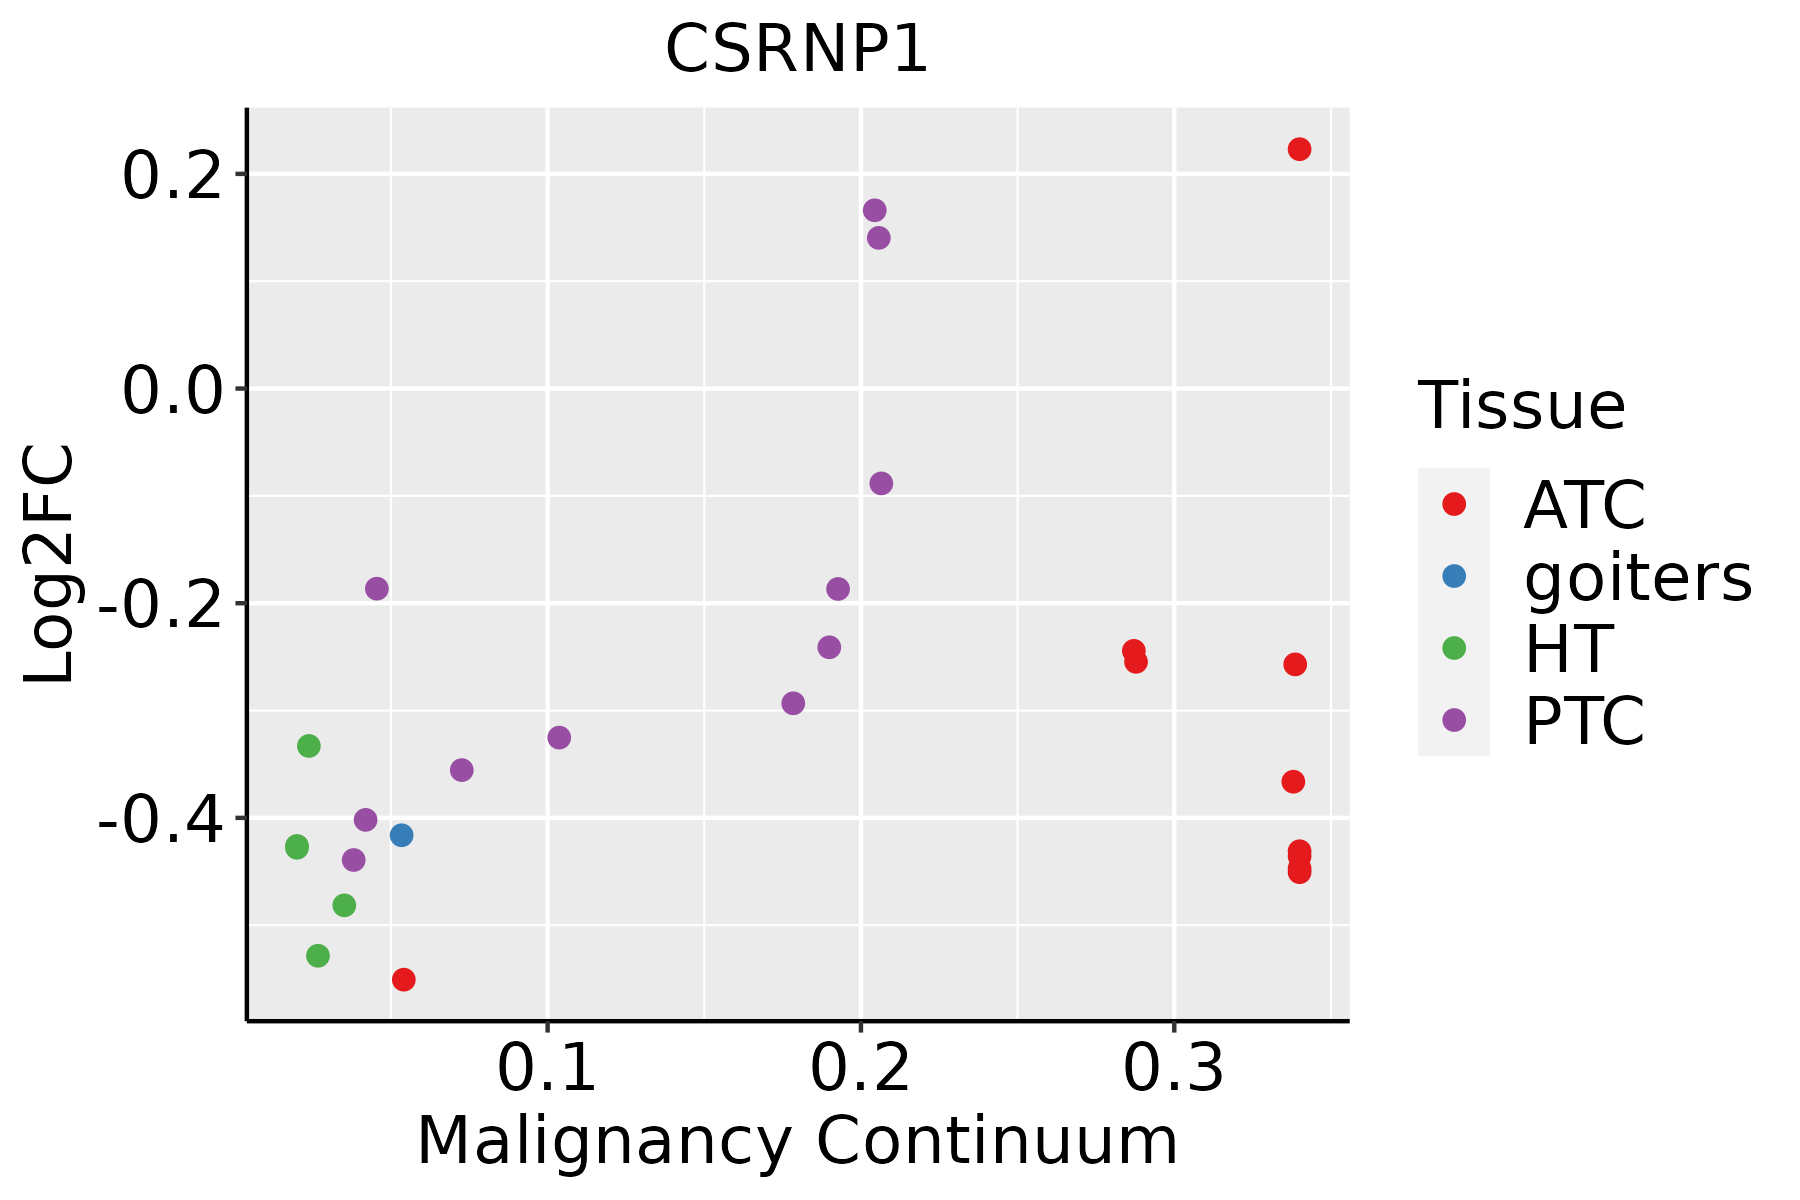 | ATC: Anaplastic thyroid cancer |
| HT: Hashimoto's thyroiditis | ||
| PTC: Papillary thyroid cancer |
| ∗log2FC in expression of this searched gene in stem-like cells from each diseased tissue sample relative to stem-like cells in normal samples in each tissue plotted against the malignancy continuum. Samples are colored based on if they are from different disease stage. |
Top |
Malignant transformation related pathway analysis |
| Find out the enriched GO biological processes and KEGG pathways involved in transition from healthy to precancer to cancer |
| Tissue | Disease Stage | Enriched GO biological Processes |
| Colorectum | AD |  |
| Colorectum | SER |  |
| Colorectum | MSS |  |
| Colorectum | MSI-H |  |
| Colorectum | FAP |  |
| ∗Top 15 enriched GO BP terms are showed in the bar plot of each disease state in each tissue. Each row represents a significant GO biological process which is colored according to the -log10(p.adjust). |
| Page: 1 2 3 4 5 6 7 8 9 |
| GO ID | Tissue | Disease Stage | Description | Gene Ratio | Bg Ratio | pvalue | p.adjust | Count |
| GO:00480087 | Esophagus | ESCC | platelet-derived growth factor receptor signaling pathway | 42/8552 | 56/18723 | 7.62e-06 | 7.54e-05 | 42 |
| GO:00097919 | Esophagus | ESCC | post-embryonic development | 56/8552 | 80/18723 | 9.08e-06 | 8.71e-05 | 56 |
| GO:00603242 | Esophagus | ESCC | face development | 34/8552 | 44/18723 | 1.90e-05 | 1.67e-04 | 34 |
| GO:00101711 | Esophagus | ESCC | body morphogenesis | 30/8552 | 43/18723 | 1.21e-03 | 5.88e-03 | 30 |
| GO:00603253 | Esophagus | ESCC | face morphogenesis | 21/8552 | 28/18723 | 1.57e-03 | 7.33e-03 | 21 |
| GO:00487052 | Esophagus | ESCC | skeletal system morphogenesis | 120/8552 | 220/18723 | 4.90e-03 | 1.89e-02 | 120 |
| GO:00603232 | Esophagus | ESCC | head morphogenesis | 22/8552 | 32/18723 | 7.12e-03 | 2.58e-02 | 22 |
| GO:0060021 | Esophagus | ESCC | roof of mouth development | 50/8552 | 85/18723 | 1.00e-02 | 3.42e-02 | 50 |
| GO:00097918 | Oral cavity | OSCC | post-embryonic development | 51/7305 | 80/18723 | 6.43e-06 | 7.13e-05 | 51 |
| GO:0060324 | Oral cavity | OSCC | face development | 28/7305 | 44/18723 | 8.15e-04 | 4.35e-03 | 28 |
| GO:00480086 | Oral cavity | OSCC | platelet-derived growth factor receptor signaling pathway | 34/7305 | 56/18723 | 8.17e-04 | 4.35e-03 | 34 |
| GO:00603252 | Oral cavity | OSCC | face morphogenesis | 18/7305 | 28/18723 | 5.96e-03 | 2.27e-02 | 18 |
| GO:0060323 | Oral cavity | OSCC | head morphogenesis | 19/7305 | 32/18723 | 1.56e-02 | 5.00e-02 | 19 |
| GO:000979112 | Oral cavity | LP | post-embryonic development | 31/4623 | 80/18723 | 3.69e-03 | 2.44e-02 | 31 |
| GO:00097917 | Prostate | BPH | post-embryonic development | 28/3107 | 80/18723 | 4.93e-05 | 5.11e-04 | 28 |
| GO:00480085 | Prostate | BPH | platelet-derived growth factor receptor signaling pathway | 19/3107 | 56/18723 | 1.19e-03 | 7.31e-03 | 19 |
| GO:000979111 | Prostate | Tumor | post-embryonic development | 26/3246 | 80/18723 | 7.05e-04 | 4.94e-03 | 26 |
| GO:004800812 | Prostate | Tumor | platelet-derived growth factor receptor signaling pathway | 18/3246 | 56/18723 | 5.05e-03 | 2.45e-02 | 18 |
| GO:000979122 | Skin | cSCC | post-embryonic development | 32/4864 | 80/18723 | 4.18e-03 | 2.21e-02 | 32 |
| GO:004800822 | Skin | cSCC | platelet-derived growth factor receptor signaling pathway | 24/4864 | 56/18723 | 4.44e-03 | 2.29e-02 | 24 |
| Page: 1 2 |
| Pathway ID | Tissue | Disease Stage | Description | Gene Ratio | Bg Ratio | pvalue | p.adjust | qvalue | Count |
| Page: 1 |
Top |
Cell-cell communication analysis |
| Identification of potential cell-cell interactions between two cell types and their ligand-receptor pairs for different disease states |
| Ligand | Receptor | LRpair | Pathway | Tissue | Disease Stage |
| Page: 1 |
Top |
Single-cell gene regulatory network inference analysis |
| Find out the significant the regulons (TFs) and the target genes of each regulon across cell types for different disease states |
| TF | Cell Type | Tissue | Disease Stage | Target Gene | RSS | Regulon Activity |
| ∗The dot plots of a searched regulon are shown for all cell subpopulations in each disease state of each tissue based on the regulon specific score inferred using pySCENIC and by calculating the average expression. |
| Page: 1 |
Top |
Somatic mutation of malignant transformation related genes |
| Annotation of somatic variants for genes involved in malignant transformation |
| Hugo Symbol | Variant Class | Variant Classification | dbSNP RS | HGVSc | HGVSp | HGVSp Short | SWISSPROT | BIOTYPE | SIFT | PolyPhen | Tumor Sample Barcode | Tissue | Histology | Sex | Age | Stage | Therapy Types | Drugs | Outcome |
| CSRNP1 | deletion | Frame_Shift_Del | novel | c.381delN | p.Glu127AspfsTer18 | p.E127Dfs*18 | Q96S65 | protein_coding | TCGA-EW-A2FV-01 | Breast | breast invasive carcinoma | Female | <65 | III/IV | Chemotherapy | docetaxel | SD | ||
| CSRNP1 | SNV | Missense_Mutation | rs759995863 | c.53N>T | p.Ser18Leu | p.S18L | Q96S65 | protein_coding | tolerated(0.62) | benign(0.003) | TCGA-AA-3811-01 | Colorectum | colon adenocarcinoma | Female | >=65 | III/IV | Unknown | Unknown | PD |
| CSRNP1 | SNV | Missense_Mutation | novel | c.683A>G | p.Gln228Arg | p.Q228R | Q96S65 | protein_coding | tolerated(0.14) | benign(0.007) | TCGA-AA-3950-01 | Colorectum | colon adenocarcinoma | Female | >=65 | I/II | Unknown | Unknown | SD |
| CSRNP1 | SNV | Missense_Mutation | c.1368N>T | p.Glu456Asp | p.E456D | Q96S65 | protein_coding | tolerated(0.11) | possibly_damaging(0.569) | TCGA-AA-3977-01 | Colorectum | colon adenocarcinoma | Male | >=65 | I/II | Unknown | Unknown | SD | |
| CSRNP1 | SNV | Missense_Mutation | c.793G>A | p.Ala265Thr | p.A265T | Q96S65 | protein_coding | tolerated(0.11) | benign(0.085) | TCGA-AA-A010-01 | Colorectum | colon adenocarcinoma | Female | <65 | I/II | Chemotherapy | folinic | CR | |
| CSRNP1 | SNV | Missense_Mutation | novel | c.619N>G | p.Arg207Gly | p.R207G | Q96S65 | protein_coding | deleterious(0.04) | possibly_damaging(0.589) | TCGA-AA-A01K-01 | Colorectum | colon adenocarcinoma | Female | >=65 | III/IV | Chemotherapy | folinic | CR |
| CSRNP1 | SNV | Missense_Mutation | rs200794258 | c.1178N>A | p.Arg393His | p.R393H | Q96S65 | protein_coding | deleterious(0.01) | possibly_damaging(0.783) | TCGA-AZ-6598-01 | Colorectum | colon adenocarcinoma | Female | >=65 | I/II | Unknown | Unknown | SD |
| CSRNP1 | SNV | Missense_Mutation | rs112383054 | c.1690N>A | p.Ala564Thr | p.A564T | Q96S65 | protein_coding | tolerated(0.44) | benign(0.007) | TCGA-AZ-6601-01 | Colorectum | colon adenocarcinoma | Male | >=65 | I/II | Unknown | Unknown | PD |
| CSRNP1 | SNV | Missense_Mutation | c.596N>C | p.Leu199Pro | p.L199P | Q96S65 | protein_coding | deleterious(0.04) | possibly_damaging(0.553) | TCGA-AZ-6601-01 | Colorectum | colon adenocarcinoma | Male | >=65 | I/II | Unknown | Unknown | PD | |
| CSRNP1 | SNV | Missense_Mutation | rs149009984 | c.407N>A | p.Arg136Gln | p.R136Q | Q96S65 | protein_coding | deleterious(0.03) | benign(0.078) | TCGA-CM-5861-01 | Colorectum | colon adenocarcinoma | Female | <65 | I/II | Unknown | Unknown | PD |
| Page: 1 2 3 4 5 6 |
Top |
Related drugs of malignant transformation related genes |
| Identification of chemicals and drugs interact with genes involved in malignant transfromation |
| (DGIdb 4.0) |
| Entrez ID | Symbol | Category | Interaction Types | Drug Claim Name | Drug Name | PMIDs |
| Page: 1 |

Copyright 2023-Present -The University of Texas Health Science Center at Houston |