| Tissue | Expression Dynamics | Abbreviation |
| Cervix | 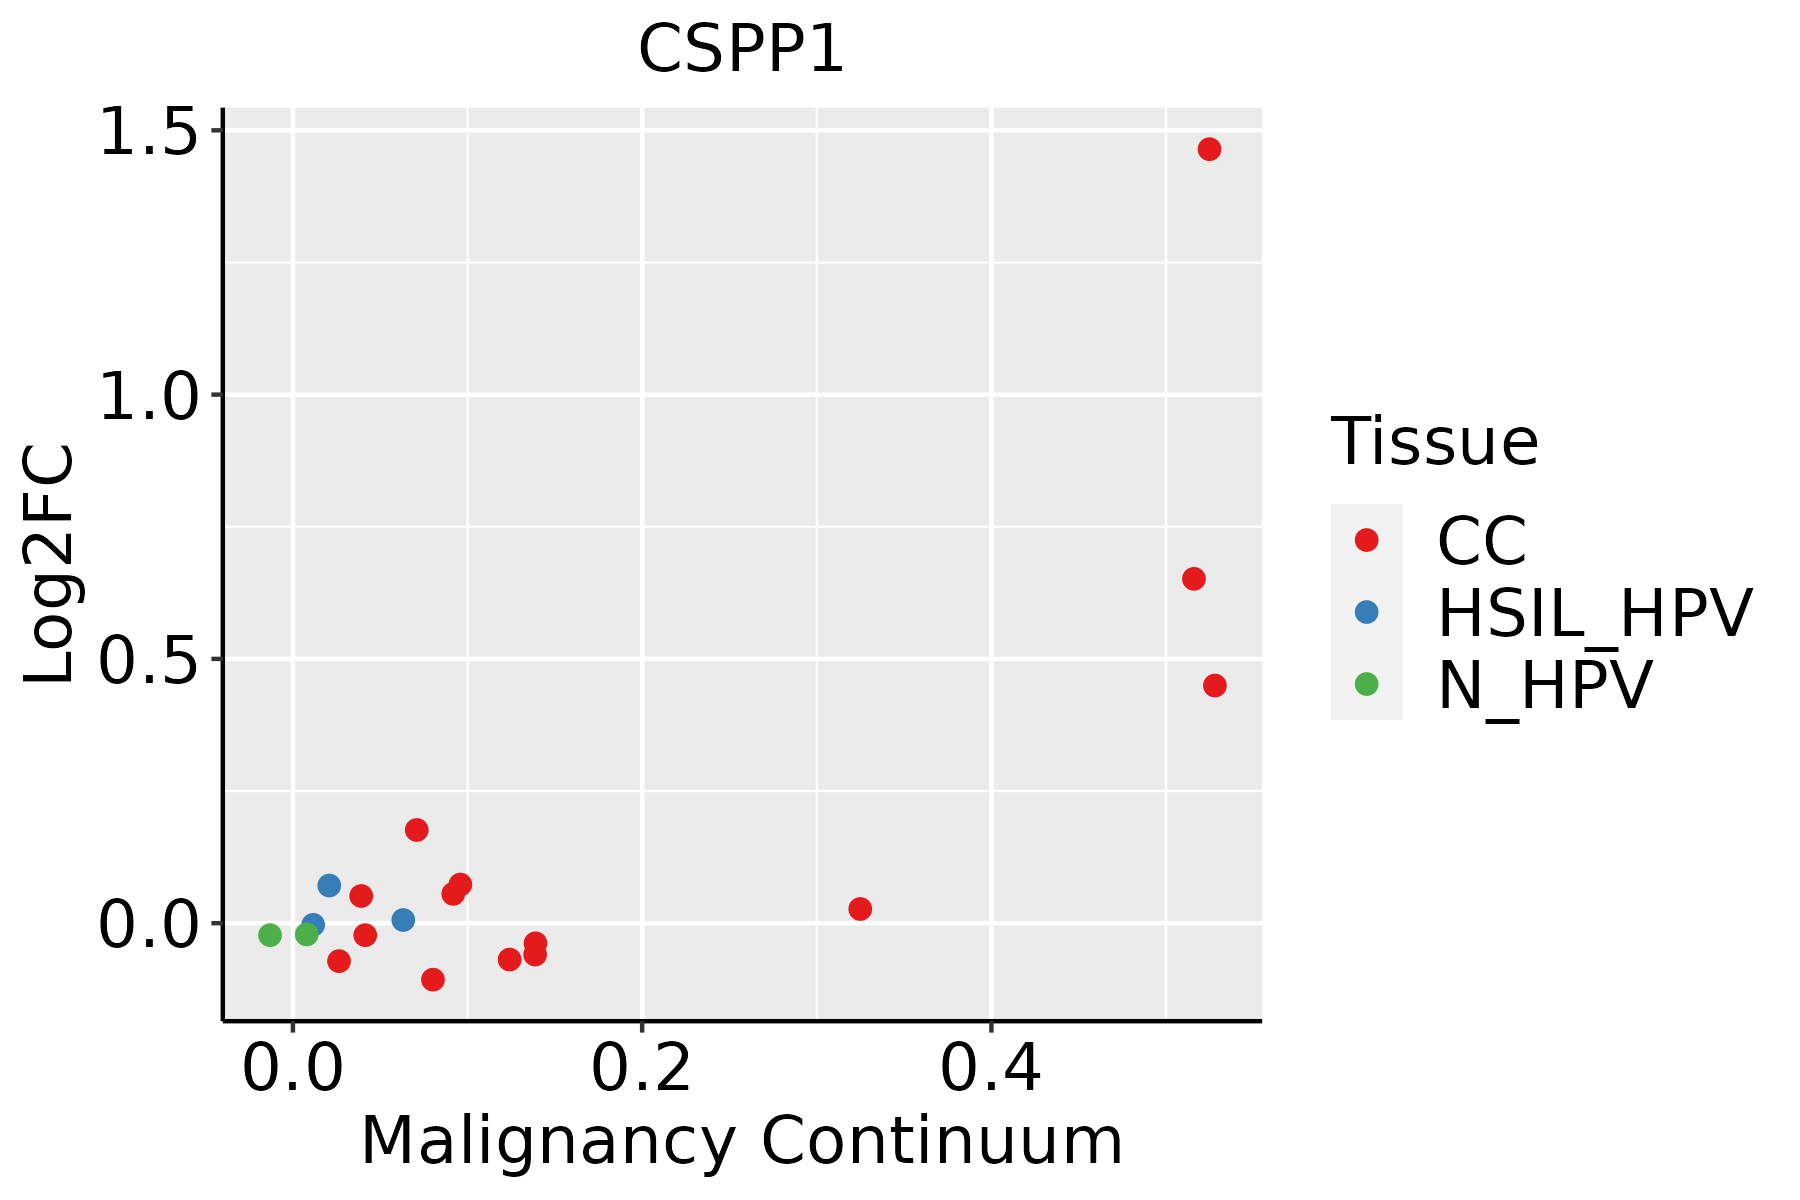 | CC: Cervix cancer |
| HSIL_HPV: HPV-infected high-grade squamous intraepithelial lesions |
| N_HPV: HPV-infected normal cervix |
| Colorectum (GSE201348) |  | FAP: Familial adenomatous polyposis |
| CRC: Colorectal cancer |
| Colorectum (HTA11) |  | AD: Adenomas |
| SER: Sessile serrated lesions |
| MSI-H: Microsatellite-high colorectal cancer |
| MSS: Microsatellite stable colorectal cancer |
| Endometrium | 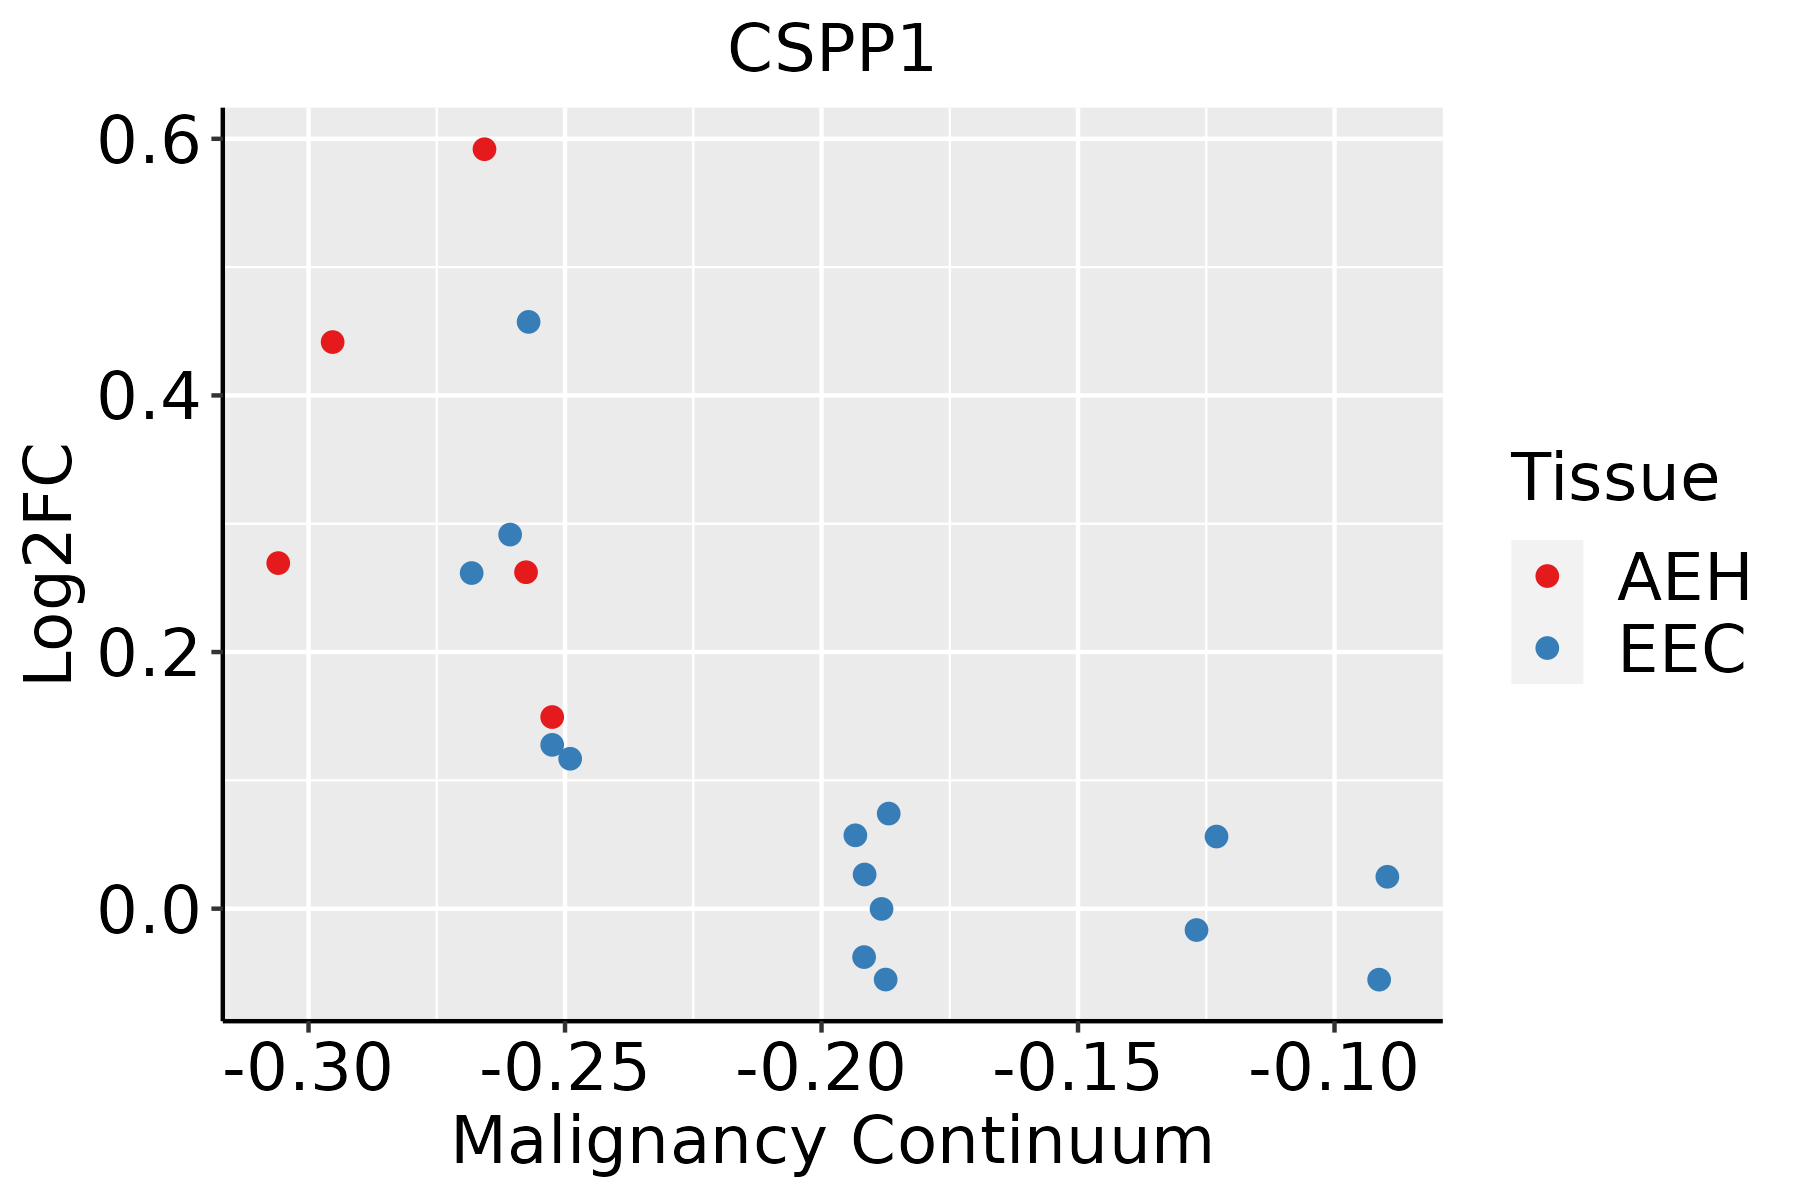 | AEH: Atypical endometrial hyperplasia |
| EEC: Endometrioid Cancer |
| Esophagus |  | ESCC: Esophageal squamous cell carcinoma |
| HGIN: High-grade intraepithelial neoplasias |
| LGIN: Low-grade intraepithelial neoplasias |
| Liver | 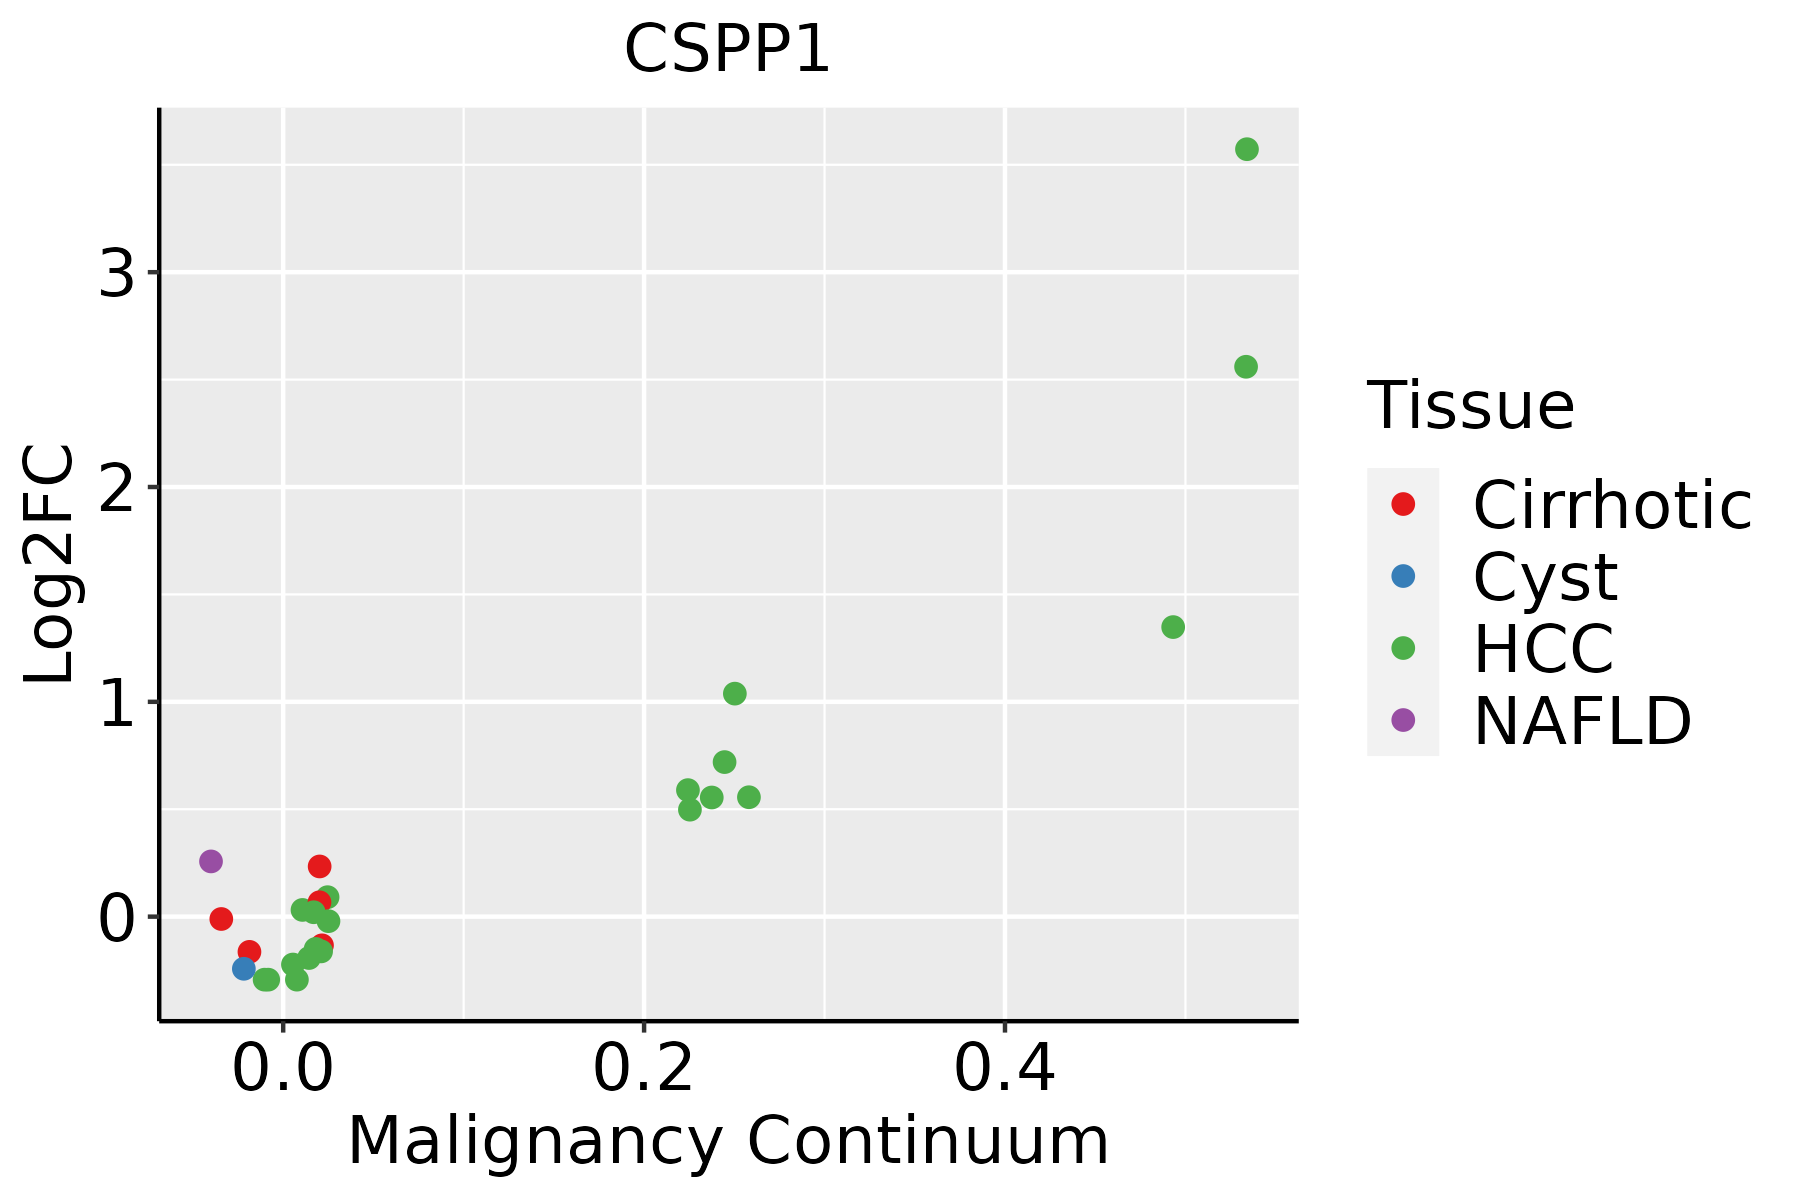 | HCC: Hepatocellular carcinoma |
| NAFLD: Non-alcoholic fatty liver disease |
| Lung | 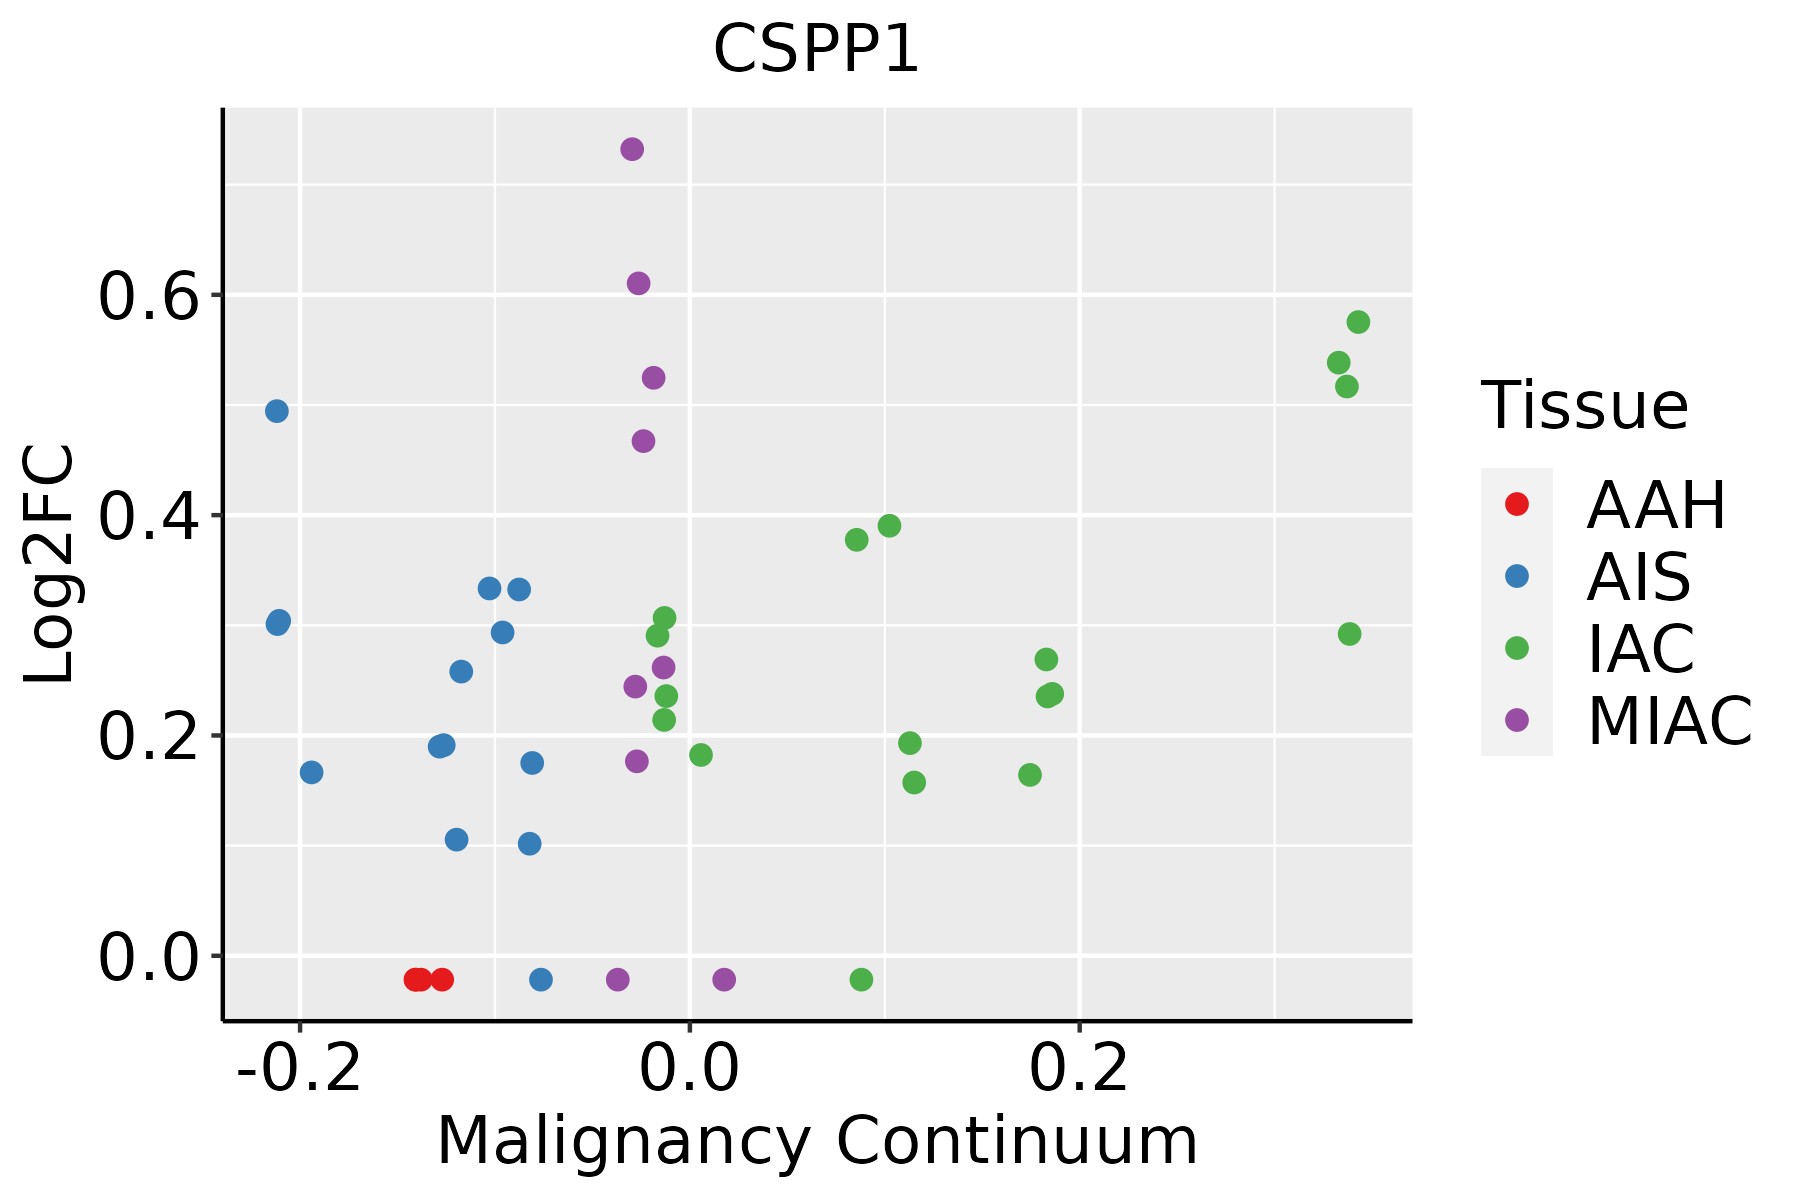 | AAH: Atypical adenomatous hyperplasia |
| AIS: Adenocarcinoma in situ |
| IAC: Invasive lung adenocarcinoma |
| MIA: Minimally invasive adenocarcinoma |
| Oral Cavity |  | EOLP: Erosive Oral lichen planus |
| LP: leukoplakia |
| NEOLP: Non-erosive oral lichen planus |
| OSCC: Oral squamous cell carcinoma |
| Prostate |  | BPH: Benign Prostatic Hyperplasia |
| Thyroid |  | ATC: Anaplastic thyroid cancer |
| HT: Hashimoto's thyroiditis |
| PTC: Papillary thyroid cancer |
| GO ID | Tissue | Disease Stage | Description | Gene Ratio | Bg Ratio | pvalue | p.adjust | Count |
| GO:00457876 | Cervix | CC | positive regulation of cell cycle | 66/2311 | 313/18723 | 7.78e-06 | 1.81e-04 | 66 |
| GO:00900685 | Cervix | CC | positive regulation of cell cycle process | 50/2311 | 236/18723 | 8.25e-05 | 1.11e-03 | 50 |
| GO:00513021 | Cervix | CC | regulation of cell division | 39/2311 | 177/18723 | 2.05e-04 | 2.33e-03 | 39 |
| GO:00009107 | Cervix | CC | cytokinesis | 37/2311 | 173/18723 | 5.40e-04 | 5.23e-03 | 37 |
| GO:0032465 | Cervix | CC | regulation of cytokinesis | 22/2311 | 92/18723 | 1.55e-03 | 1.20e-02 | 22 |
| GO:0000910 | Colorectum | AD | cytokinesis | 59/3918 | 173/18723 | 3.74e-05 | 6.75e-04 | 59 |
| GO:0045787 | Colorectum | AD | positive regulation of cell cycle | 85/3918 | 313/18723 | 4.76e-03 | 3.22e-02 | 85 |
| GO:00009101 | Colorectum | SER | cytokinesis | 45/2897 | 173/18723 | 2.28e-04 | 3.93e-03 | 45 |
| GO:00009102 | Colorectum | MSS | cytokinesis | 49/3467 | 173/18723 | 1.02e-03 | 1.02e-02 | 49 |
| GO:00457871 | Colorectum | MSS | positive regulation of cell cycle | 80/3467 | 313/18723 | 1.15e-03 | 1.12e-02 | 80 |
| GO:0090068 | Colorectum | MSS | positive regulation of cell cycle process | 60/3467 | 236/18723 | 5.01e-03 | 3.46e-02 | 60 |
| GO:00457872 | Colorectum | FAP | positive regulation of cell cycle | 66/2622 | 313/18723 | 3.66e-04 | 4.63e-03 | 66 |
| GO:00900681 | Colorectum | FAP | positive regulation of cell cycle process | 48/2622 | 236/18723 | 4.53e-03 | 3.08e-02 | 48 |
| GO:00009103 | Colorectum | FAP | cytokinesis | 37/2622 | 173/18723 | 5.10e-03 | 3.37e-02 | 37 |
| GO:00457873 | Colorectum | CRC | positive regulation of cell cycle | 55/2078 | 313/18723 | 3.76e-04 | 5.57e-03 | 55 |
| GO:00009104 | Colorectum | CRC | cytokinesis | 34/2078 | 173/18723 | 6.47e-04 | 8.55e-03 | 34 |
| GO:00900682 | Colorectum | CRC | positive regulation of cell cycle process | 39/2078 | 236/18723 | 7.23e-03 | 4.98e-02 | 39 |
| GO:00009108 | Endometrium | AEH | cytokinesis | 40/2100 | 173/18723 | 6.01e-06 | 1.49e-04 | 40 |
| GO:00457877 | Endometrium | AEH | positive regulation of cell cycle | 56/2100 | 313/18723 | 2.73e-04 | 3.14e-03 | 56 |
| GO:00900686 | Endometrium | AEH | positive regulation of cell cycle process | 41/2100 | 236/18723 | 2.94e-03 | 2.09e-02 | 41 |
| Hugo Symbol | Variant Class | Variant Classification | dbSNP RS | HGVSc | HGVSp | HGVSp Short | SWISSPROT | BIOTYPE | SIFT | PolyPhen | Tumor Sample Barcode | Tissue | Histology | Sex | Age | Stage | Therapy Types | Drugs | Outcome |
| CSPP1 | SNV | Missense_Mutation | rs753413923 | c.2951N>A | p.Arg984Lys | p.R984K | Q1MSJ5 | protein_coding | tolerated(0.35) | benign(0.006) | TCGA-5L-AAT1-01 | Breast | breast invasive carcinoma | Female | <65 | III/IV | Hormone Therapy | letrozol | SD |
| CSPP1 | SNV | Missense_Mutation | rs369228037 | c.2299N>T | p.Arg767Trp | p.R767W | Q1MSJ5 | protein_coding | deleterious(0) | probably_damaging(0.998) | TCGA-A2-A0EQ-01 | Breast | breast invasive carcinoma | Female | <65 | I/II | Chemotherapy | adriamycin | SD |
| CSPP1 | SNV | Missense_Mutation | | c.3101N>C | p.Leu1034Ser | p.L1034S | Q1MSJ5 | protein_coding | tolerated(0.32) | probably_damaging(0.936) | TCGA-A2-A0T0-01 | Breast | breast invasive carcinoma | Female | <65 | I/II | Chemotherapy | taxotere | SD |
| CSPP1 | SNV | Missense_Mutation | | c.2584N>G | p.Gln862Glu | p.Q862E | Q1MSJ5 | protein_coding | tolerated(0.58) | benign(0.011) | TCGA-A8-A08L-01 | Breast | breast invasive carcinoma | Female | >=65 | III/IV | Unknown | Unknown | SD |
| CSPP1 | SNV | Missense_Mutation | | c.3360N>T | p.Lys1120Asn | p.K1120N | Q1MSJ5 | protein_coding | tolerated(0.12) | benign(0.003) | TCGA-A8-A09Z-01 | Breast | breast invasive carcinoma | Female | >=65 | I/II | Unknown | Unknown | SD |
| CSPP1 | SNV | Missense_Mutation | | c.38N>T | p.Ser13Leu | p.S13L | Q1MSJ5 | protein_coding | tolerated_low_confidence(0.06) | benign(0) | TCGA-A8-A0A7-01 | Breast | breast invasive carcinoma | Female | <65 | I/II | Unknown | Unknown | SD |
| CSPP1 | SNV | Missense_Mutation | | c.124N>C | p.Asp42His | p.D42H | Q1MSJ5 | protein_coding | deleterious(0) | possibly_damaging(0.855) | TCGA-A8-A0A7-01 | Breast | breast invasive carcinoma | Female | <65 | I/II | Unknown | Unknown | SD |
| CSPP1 | SNV | Missense_Mutation | | c.520N>A | p.Gln174Lys | p.Q174K | Q1MSJ5 | protein_coding | tolerated(0.21) | benign(0.031) | TCGA-AC-A23H-01 | Breast | breast invasive carcinoma | Female | >=65 | I/II | Unknown | Unknown | PD |
| CSPP1 | SNV | Missense_Mutation | | c.1250N>C | p.Gly417Ala | p.G417A | Q1MSJ5 | protein_coding | deleterious(0.01) | probably_damaging(1) | TCGA-AC-A23H-01 | Breast | breast invasive carcinoma | Female | >=65 | I/II | Unknown | Unknown | PD |
| CSPP1 | SNV | Missense_Mutation | | c.3004G>C | p.Asp1002His | p.D1002H | Q1MSJ5 | protein_coding | deleterious(0) | probably_damaging(0.999) | TCGA-C8-A12K-01 | Breast | breast invasive carcinoma | Female | >=65 | I/II | Unknown | Unknown | SD |


