
|
|||||
|
 | |
| |
| |
| |
| |
| |
|
Gene: CSPG4 |
Gene summary for CSPG4 |
| Gene information | Species | Human | Gene symbol | CSPG4 | Gene ID | 1464 |
| Gene name | chondroitin sulfate proteoglycan 4 | |
| Gene Alias | CSPG4A | |
| Cytomap | 15q24.2 | |
| Gene Type | protein-coding | GO ID | GO:0000165 | UniProtAcc | Q6UVK1 |
Top |
Malignant transformation analysis |
| Identification of the aberrant gene expression in precancerous and cancerous lesions by comparing the gene expression of stem-like cells in diseased tissues with normal stem cells |
| Entrez ID | Symbol | Replicates | Species | Organ | Tissue | Adj P-value | Log2FC | Malignancy |
| 1464 | CSPG4 | P2T-E | Human | Esophagus | ESCC | 9.20e-06 | 1.47e-01 | 0.1177 |
| 1464 | CSPG4 | P10T-E | Human | Esophagus | ESCC | 3.95e-30 | 6.04e-01 | 0.116 |
| 1464 | CSPG4 | P11T-E | Human | Esophagus | ESCC | 6.08e-06 | 2.61e-01 | 0.1426 |
| 1464 | CSPG4 | P15T-E | Human | Esophagus | ESCC | 1.31e-02 | 1.06e-01 | 0.1149 |
| 1464 | CSPG4 | P16T-E | Human | Esophagus | ESCC | 1.51e-64 | 1.09e+00 | 0.1153 |
| 1464 | CSPG4 | P19T-E | Human | Esophagus | ESCC | 4.64e-06 | 6.68e-01 | 0.1662 |
| 1464 | CSPG4 | P21T-E | Human | Esophagus | ESCC | 1.75e-25 | 4.74e-01 | 0.1617 |
| 1464 | CSPG4 | P22T-E | Human | Esophagus | ESCC | 1.47e-14 | 2.75e-01 | 0.1236 |
| 1464 | CSPG4 | P26T-E | Human | Esophagus | ESCC | 8.84e-05 | 1.16e-01 | 0.1276 |
| 1464 | CSPG4 | P31T-E | Human | Esophagus | ESCC | 8.73e-28 | 5.44e-01 | 0.1251 |
| 1464 | CSPG4 | P37T-E | Human | Esophagus | ESCC | 6.35e-38 | 7.03e-01 | 0.1371 |
| 1464 | CSPG4 | P40T-E | Human | Esophagus | ESCC | 8.35e-06 | 1.87e-01 | 0.109 |
| 1464 | CSPG4 | P42T-E | Human | Esophagus | ESCC | 9.46e-03 | 1.72e-01 | 0.1175 |
| 1464 | CSPG4 | P49T-E | Human | Esophagus | ESCC | 1.17e-11 | 1.01e+00 | 0.1768 |
| 1464 | CSPG4 | P52T-E | Human | Esophagus | ESCC | 1.66e-02 | 1.07e-01 | 0.1555 |
| 1464 | CSPG4 | P56T-E | Human | Esophagus | ESCC | 7.62e-17 | 1.28e+00 | 0.1613 |
| 1464 | CSPG4 | P74T-E | Human | Esophagus | ESCC | 8.25e-13 | 4.46e-01 | 0.1479 |
| 1464 | CSPG4 | P75T-E | Human | Esophagus | ESCC | 7.90e-03 | 9.22e-02 | 0.1125 |
| 1464 | CSPG4 | P76T-E | Human | Esophagus | ESCC | 7.31e-14 | 3.49e-01 | 0.1207 |
| 1464 | CSPG4 | P79T-E | Human | Esophagus | ESCC | 1.97e-10 | 2.49e-01 | 0.1154 |
| Page: 1 2 |
| Tissue | Expression Dynamics | Abbreviation |
| Esophagus |  | ESCC: Esophageal squamous cell carcinoma |
| HGIN: High-grade intraepithelial neoplasias | ||
| LGIN: Low-grade intraepithelial neoplasias | ||
| Oral Cavity |  | EOLP: Erosive Oral lichen planus |
| LP: leukoplakia | ||
| NEOLP: Non-erosive oral lichen planus | ||
| OSCC: Oral squamous cell carcinoma | ||
| Skin | 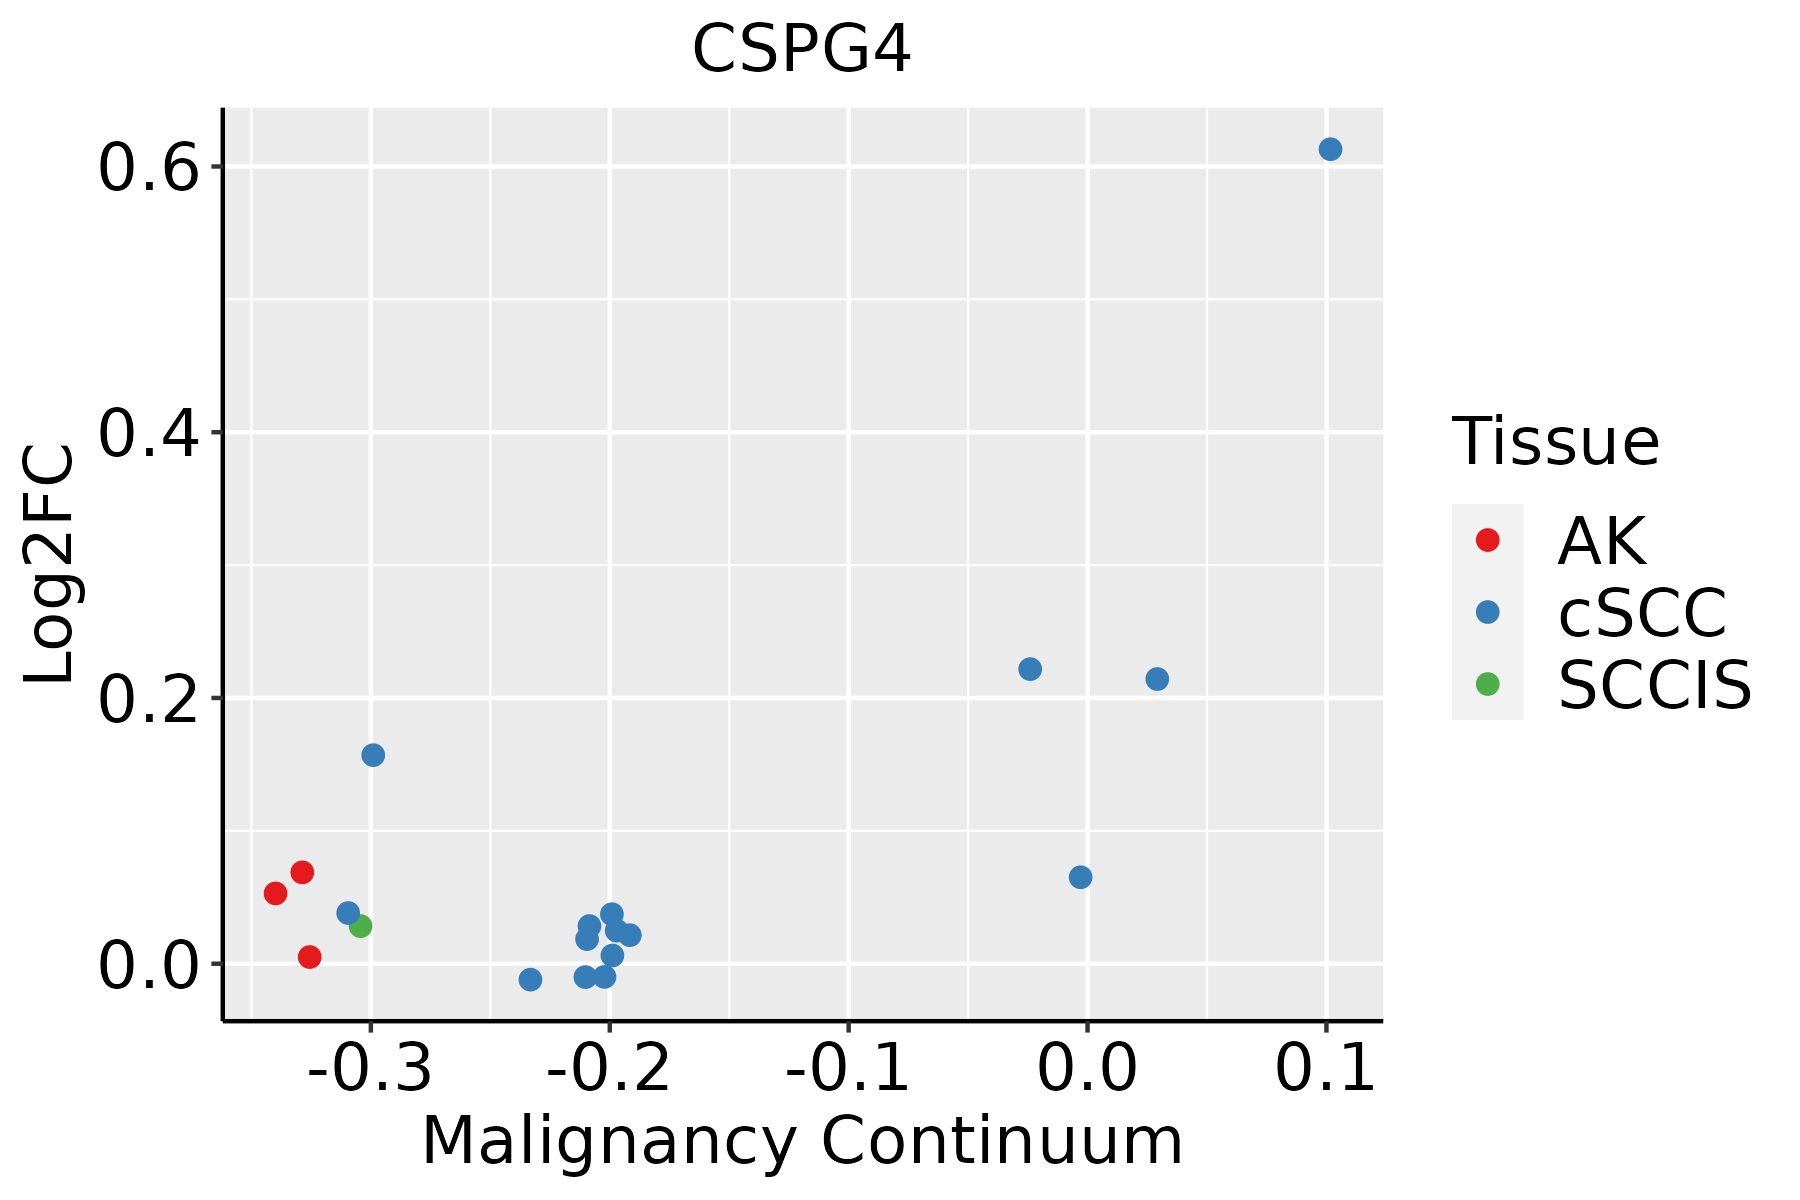 | AK: Actinic keratosis |
| cSCC: Cutaneous squamous cell carcinoma | ||
| SCCIS:squamous cell carcinoma in situ |
| ∗log2FC in expression of this searched gene in stem-like cells from each diseased tissue sample relative to stem-like cells in normal samples in each tissue plotted against the malignancy continuum. Samples are colored based on if they are from different disease stage. |
Top |
Malignant transformation related pathway analysis |
| Find out the enriched GO biological processes and KEGG pathways involved in transition from healthy to precancer to cancer |
| Tissue | Disease Stage | Enriched GO biological Processes |
| Colorectum | AD |  |
| Colorectum | SER |  |
| Colorectum | MSS |  |
| Colorectum | MSI-H |  |
| Colorectum | FAP |  |
| ∗Top 15 enriched GO BP terms are showed in the bar plot of each disease state in each tissue. Each row represents a significant GO biological process which is colored according to the -log10(p.adjust). |
| Page: 1 2 3 4 5 6 7 8 9 |
| GO ID | Tissue | Disease Stage | Description | Gene Ratio | Bg Ratio | pvalue | p.adjust | Count |
| GO:00480087 | Esophagus | ESCC | platelet-derived growth factor receptor signaling pathway | 42/8552 | 56/18723 | 7.62e-06 | 7.54e-05 | 42 |
| GO:00420636 | Esophagus | ESCC | gliogenesis | 172/8552 | 301/18723 | 3.75e-05 | 3.04e-04 | 172 |
| GO:00315299 | Esophagus | ESCC | ruffle organization | 39/8552 | 56/18723 | 2.44e-04 | 1.51e-03 | 39 |
| GO:00971789 | Esophagus | ESCC | ruffle assembly | 32/8552 | 44/18723 | 2.50e-04 | 1.54e-03 | 32 |
| GO:00182124 | Esophagus | ESCC | peptidyl-tyrosine modification | 202/8552 | 378/18723 | 1.34e-03 | 6.39e-03 | 202 |
| GO:00181084 | Esophagus | ESCC | peptidyl-tyrosine phosphorylation | 200/8552 | 375/18723 | 1.60e-03 | 7.45e-03 | 200 |
| GO:00507303 | Esophagus | ESCC | regulation of peptidyl-tyrosine phosphorylation | 144/8552 | 264/18723 | 2.22e-03 | 9.78e-03 | 144 |
| GO:00069294 | Esophagus | ESCC | substrate-dependent cell migration | 17/8552 | 23/18723 | 5.73e-03 | 2.13e-02 | 17 |
| GO:00420635 | Oral cavity | OSCC | gliogenesis | 154/7305 | 301/18723 | 1.10e-05 | 1.14e-04 | 154 |
| GO:00315298 | Oral cavity | OSCC | ruffle organization | 37/7305 | 56/18723 | 3.74e-05 | 3.32e-04 | 37 |
| GO:00971788 | Oral cavity | OSCC | ruffle assembly | 29/7305 | 44/18723 | 2.74e-04 | 1.74e-03 | 29 |
| GO:00182123 | Oral cavity | OSCC | peptidyl-tyrosine modification | 180/7305 | 378/18723 | 3.63e-04 | 2.22e-03 | 180 |
| GO:0050730 | Oral cavity | OSCC | regulation of peptidyl-tyrosine phosphorylation | 129/7305 | 264/18723 | 6.70e-04 | 3.75e-03 | 129 |
| GO:00181083 | Oral cavity | OSCC | peptidyl-tyrosine phosphorylation | 177/7305 | 375/18723 | 6.86e-04 | 3.83e-03 | 177 |
| GO:00480086 | Oral cavity | OSCC | platelet-derived growth factor receptor signaling pathway | 34/7305 | 56/18723 | 8.17e-04 | 4.35e-03 | 34 |
| GO:0008347 | Oral cavity | OSCC | glial cell migration | 30/7305 | 53/18723 | 7.03e-03 | 2.61e-02 | 30 |
| GO:00434107 | Oral cavity | OSCC | positive regulation of MAPK cascade | 213/7305 | 480/18723 | 8.71e-03 | 3.16e-02 | 213 |
| GO:00487713 | Oral cavity | OSCC | tissue remodeling | 84/7305 | 175/18723 | 9.39e-03 | 3.36e-02 | 84 |
| GO:00069293 | Oral cavity | OSCC | substrate-dependent cell migration | 15/7305 | 23/18723 | 9.84e-03 | 3.46e-02 | 15 |
| GO:004206322 | Skin | cSCC | gliogenesis | 103/4864 | 301/18723 | 8.48e-04 | 5.85e-03 | 103 |
| Page: 1 2 |
| Pathway ID | Tissue | Disease Stage | Description | Gene Ratio | Bg Ratio | pvalue | p.adjust | qvalue | Count |
| Page: 1 |
Top |
Cell-cell communication analysis |
| Identification of potential cell-cell interactions between two cell types and their ligand-receptor pairs for different disease states |
| Ligand | Receptor | LRpair | Pathway | Tissue | Disease Stage |
| CSPG4 | ITGA3_ITGB1 | CSPG4_ITGA2_ITGB1 | CSPG4 | Cervix | ADJ |
| CSPG4 | ITGA3_ITGB1 | CSPG4_ITGA2_ITGB1 | CSPG4 | CRC | MSI-H |
| CSPG4 | ITGA3_ITGB1 | CSPG4_ITGA2_ITGB1 | CSPG4 | CRC | MSS |
| CSPG4 | ITGA3_ITGB1 | CSPG4_ITGA2_ITGB1 | CSPG4 | Endometrium | ADJ |
| CSPG4 | ITGA3_ITGB1 | CSPG4_ITGA2_ITGB1 | CSPG4 | Endometrium | AEH |
| CSPG4 | ITGA3_ITGB1 | CSPG4_ITGA2_ITGB1 | CSPG4 | Esophagus | ESCC |
| CSPG4 | ITGA3_ITGB1 | CSPG4_ITGA2_ITGB1 | CSPG4 | HNSCC | OSCC |
| CSPG4 | ITGA3_ITGB1 | CSPG4_ITGA2_ITGB1 | CSPG4 | HNSCC | Precancer |
| CSPG4 | ITGA3_ITGB1 | CSPG4_ITGA2_ITGB1 | CSPG4 | Liver | HCC |
| CSPG4 | ITGA3_ITGB1 | CSPG4_ITGA2_ITGB1 | CSPG4 | THCA | Cancer |
| CSPG4 | ITGA3_ITGB1 | CSPG4_ITGA2_ITGB1 | CSPG4 | THCA | PTC |
| Page: 1 |
Top |
Single-cell gene regulatory network inference analysis |
| Find out the significant the regulons (TFs) and the target genes of each regulon across cell types for different disease states |
| TF | Cell Type | Tissue | Disease Stage | Target Gene | RSS | Regulon Activity |
| ∗The dot plots of a searched regulon are shown for all cell subpopulations in each disease state of each tissue based on the regulon specific score inferred using pySCENIC and by calculating the average expression. |
| Page: 1 |
Top |
Somatic mutation of malignant transformation related genes |
| Annotation of somatic variants for genes involved in malignant transformation |
| Hugo Symbol | Variant Class | Variant Classification | dbSNP RS | HGVSc | HGVSp | HGVSp Short | SWISSPROT | BIOTYPE | SIFT | PolyPhen | Tumor Sample Barcode | Tissue | Histology | Sex | Age | Stage | Therapy Types | Drugs | Outcome |
| CSPG4 | SNV | Missense_Mutation | c.6957N>C | p.Gln2319His | p.Q2319H | Q6UVK1 | protein_coding | deleterious(0) | probably_damaging(0.998) | TCGA-A7-A26E-01 | Breast | breast invasive carcinoma | Female | >=65 | III/IV | Chemotherapy | cytoxan | SD | |
| CSPG4 | SNV | Missense_Mutation | c.2462T>C | p.Phe821Ser | p.F821S | Q6UVK1 | protein_coding | deleterious(0) | possibly_damaging(0.608) | TCGA-BH-A18T-01 | Breast | breast invasive carcinoma | Female | >=65 | I/II | Unknown | Unknown | PD | |
| CSPG4 | SNV | Missense_Mutation | c.3142G>A | p.Asp1048Asn | p.D1048N | Q6UVK1 | protein_coding | deleterious(0) | probably_damaging(0.999) | TCGA-C8-A26Y-01 | Breast | breast invasive carcinoma | Female | >=65 | I/II | Unknown | Unknown | SD | |
| CSPG4 | SNV | Missense_Mutation | rs544521420 | c.5365N>A | p.Gly1789Ser | p.G1789S | Q6UVK1 | protein_coding | tolerated(0.13) | benign(0.269) | TCGA-E2-A15E-01 | Breast | breast invasive carcinoma | Female | <65 | I/II | Chemotherapy | doxorubicin | SD |
| CSPG4 | SNV | Missense_Mutation | rs772682347 | c.4099N>A | p.Val1367Ile | p.V1367I | Q6UVK1 | protein_coding | tolerated(0.1) | benign(0.013) | TCGA-E2-A15G-01 | Breast | breast invasive carcinoma | Female | >=65 | I/II | Hormone Therapy | arimidex | SD |
| CSPG4 | insertion | Frame_Shift_Ins | novel | c.1174_1175insGG | p.Tyr392TrpfsTer42 | p.Y392Wfs*42 | Q6UVK1 | protein_coding | TCGA-BH-A0GY-01 | Breast | breast invasive carcinoma | Female | >=65 | I/II | Chemotherapy | cyotxan | SD | ||
| CSPG4 | SNV | Missense_Mutation | rs767886749 | c.3998N>T | p.Ser1333Leu | p.S1333L | Q6UVK1 | protein_coding | deleterious(0.04) | benign(0.017) | TCGA-C5-A902-01 | Cervix | cervical & endocervical cancer | Female | <65 | I/II | Chemotherapy | cisplatin | SD |
| CSPG4 | SNV | Missense_Mutation | c.1508A>T | p.Lys503Met | p.K503M | Q6UVK1 | protein_coding | deleterious(0) | probably_damaging(0.998) | TCGA-DR-A0ZM-01 | Cervix | cervical & endocervical cancer | Female | <65 | III/IV | Unspecific | Cisplatin | SD | |
| CSPG4 | SNV | Missense_Mutation | novel | c.4111N>C | p.Gly1371Arg | p.G1371R | Q6UVK1 | protein_coding | deleterious(0.01) | probably_damaging(0.927) | TCGA-DS-A1OA-01 | Cervix | cervical & endocervical cancer | Female | >=65 | I/II | Chemotherapy | carboplatin | PD |
| CSPG4 | SNV | Missense_Mutation | rs376418566 | c.2050N>A | p.Ala684Thr | p.A684T | Q6UVK1 | protein_coding | tolerated(0.11) | benign(0.003) | TCGA-DS-A1OA-01 | Cervix | cervical & endocervical cancer | Female | >=65 | I/II | Chemotherapy | carboplatin | PD |
| Page: 1 2 3 4 5 6 7 8 9 10 11 12 13 14 15 16 17 18 19 |
Top |
Related drugs of malignant transformation related genes |
| Identification of chemicals and drugs interact with genes involved in malignant transfromation |
| (DGIdb 4.0) |
| Entrez ID | Symbol | Category | Interaction Types | Drug Claim Name | Drug Name | PMIDs |
| 1464 | CSPG4 | CELL SURFACE, DRUGGABLE GENOME | TPA | ALTEPLASE | 18000864 |
| Page: 1 |

Copyright 2023-Present -The University of Texas Health Science Center at Houston |